

 CC-BY 4.0
1. Introduction
The chevkinite group of REE, Ti-silicates are increasingly being recognized as widespread accessory minerals in a wide range of igneous and metamorphic rocks. Hundreds of localities are known globally, and hundreds more undoubtedly wait to be discovered [Macdonald et al. 2019a]. The two most common members of the group, chevkinite and perrierite, have the general formula A4BC2D2(Si2O7)2, where the dominant cations in each site are: A, REE, Ca, Sr; B, Fe2+; C, Fe2+, Fe3+, Mn, Mg, Ti; D, Ti. In igneous systems, chevkinite and perrierite occupy different paragenesis; chevkinite occurs mainly in evolved, salic rocks, such as syenites and alkali granites (and their extrusive equivalents), and perrierite is known only from rocks of intermediate composition, such as syenodiorites, diorites, latites and trachyandesites [Macdonald and Belkin 2002; Macdonald et al. 2019a]. Here we report on the unusual case of the occurrence of the two phases in a strongly peralkaline (pantelleritic) rhyolite, which, in addition, is the only record of a chevkinite-group mineral (CGM) crystallizing in a pantelleritic magma.
The CGM under study also displays an unusual textural feature, which has not been reported from the group before. It occurs as lamellae which may be related to some form of exsolution. The lamellae are sufficiently thin (⩽2 μm), so that they could not be studied by techniques such as TEM or IR. We chose, therefore, to employ Atomic Force Microscopy (AFM) and electron back-scattered diffraction (EBSD) to examine the nature of the lamellae. The host pantellerite is the Gold Flat Tuff, an ash-flow tuff from the Black Mountain Volcanic Centre in Nevada, USA.
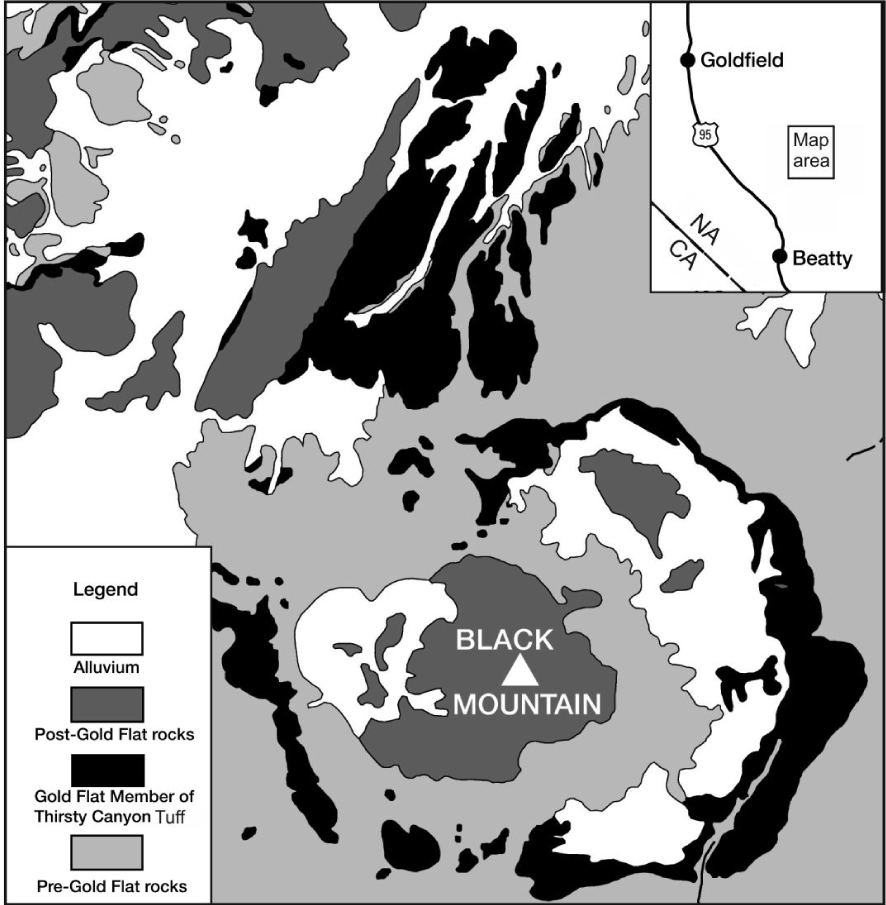
Generalized geological map showing the distribution of the Gold Flat Member of the Thirsty Canyon Group, modified from Noble [1965].
2. Gold Flat Tuff
The multicaldera silicic SW Nevada volcanic field (SWNVF) erupted, over the period 16–7 Ma, more than 20 major ash-flow sheets with the formation of at least eight collapse calderas [Byers et al. 1989; Sawyer et al. 1994]. Associated with the ash-flow tuffs are lava flows and minor pyroclastic rocks which erupted from a large number of smaller vents. The youngest major centre in the field is the Black Mountain Volcanic Centre (BMVC; Figure 1). The centre is a set of nested collapse structures and constructional volcanoes some 14 km across. Eruptive units of the centre, which are termed the Thirsty Canyon Tuff, comprise ash-flow sheets, lavas and nonwelded tuffs erupted from the Black Mountain caldera between 9.43 and 9.15 Ma [Fleck et al. 1991].
The Gold Flat Tuff is the youngest of the ash-flow sheets (9.15 Ma) in the BMVC, and the only pantelleritic rhyolite in the SW Nevada field, although several earlier BMVC units are comenditic. Noble [1965] reported that the tuff is a compound cooling unit, made up of at least a dozen individual ash-flows in a total thickness of only 30 m and an estimated volume of 20 km3 [Vogel et al. 1983]. The tuff shows complex vertical and lateral variations in composition and texture, related to a very complex evolutionary history which is still poorly understood. For example, Macdonald et al. [2019b] presented mineral chemical evidence, such as a range in feldspar compositions from An79-0 and in olivine compositions from Fo54.5-1.9, indicating that melts ranging from basaltic through trachyandesitic to comenditic mixed with the pantellerite prior to, or during, eruption.
The pantelleritic component of the tuff has Peralkalinity Indices (P.I.: mol. (Na2O + K2O∕Al2O3)) in the range 1.41–1.83 [Macdonald et al. 2019b]. SiO2 ranges from 70.7 to 73.5 wt% and FeO* from 5 to 7 wt%. Abundances of MgO and CaO are very low, ⩽0.03 wt% and ⩽0.24 wt%, respectively. Notable features are the unusually high contents of F (⩽2.2 wt%), F + Cl (⩽2.9 wt%), LREE (La–Sm: ⩽1517 ppm) and ZrO2 (⩽1.04 wt%). We know of no other peralkaline rhyolite with such elevated contents of these elements.
Macdonald et al. [2019b] used trachybasalts (belonging to the Basalt of Thirsty Mountain, geographically associated with the Gold Flat Tuff but ∼4.5 Ma older than it) as proxies for the intermediate component of the tuff. They are hy ± ol ± q- normative, with SiO2 50–51 wt% and Mg-number 0.35–0.46 (Mg∕(Mg + Fe), with all Fe calculated as Fe2+).
3. Samples and analytical methods
CGMs were studied in two samples of the tuff. Sample GF1 comes from a partially welded tuff, probably of fall origin, at the base of the sheet in Oasis Valley [N37° 05.583′ W116° 39.919′]. Sample Ttg-hg#1 is from a glassy, welded layer immediately above the basal fall at N37° 20.333′ W116° 39.666′ and is from the earliest erupted ash flow of the Gold Flat Tuff [Noble 1965].
Mineral compositions were determined by electron microprobe analysis (EPMA) using a Cameca SX-100 microprobe equipped with four wavelength dispersive spectrometers. The analytical conditions were: accelerating voltage 15 kV and probe current 20–40 nA, with counting times of 20 s on peak and 10 s on each of the two background positions. The standards, crystals and X-ray lines used and generalized detection limits are given in the Appendix. The ‘PAP’φ(ρZ) program [Pouchou and Pichoir 1991] was used for corrections. Estimates of analytical precision (1σ; wt%) are: Si 0.07, Ti 0.03, Al 0.02, Cr 0.02, Ni 0.03, Fe 0.09, Mn 0.03, Mg 0.04, Ca 0.08, Na 0.01, K 0.01. Representative analyses are given in Table 1; the full data set is given in Supplementary Table 1a.
Analyses were also made of glass in sample GF1 (Supplementary Table 1b). Analyses were conducted with a 10 nA defocused (20 μm) beam. Certain problems can arise with the analysis of glass, related especially to Na volatility. The glass analytical protocol was optimized by first measuring Na, F and Cl simultaneously, with the interception method to the initial time.
Representative compositions of chevkinite-group minerals
| Chevkinite-(Ce) | Perrierite-(Ce) | |||||||
|---|---|---|---|---|---|---|---|---|
| 1 | 2 | 3 | 4 | 5 | 6 | 7 | 8 | |
| wt% | ||||||||
| P2O5 | bd | 0.07 | - | - | 0.13 | 0.06 | 0.05 | 0.11 |
| Nb2O5 | 1.76 | 1.13 | 0.99 | 1.26 | 0.15 | bd | bd | bd |
| Ta2O5 | 0.10 | 0.11 | 0.11 | bd | 0.06 | 0.09 | 0.13 | 0.11 |
| SiO2 | 18.70 | 18.37 | 19.23 | 19.85 | 19.89 | 20.37 | 20.62 | 20.00 |
| TiO2 | 16.70 | 16.92 | 17.31 | 18.87 | 18.18 | 19.07 | 18.92 | 18.29 |
| ZrO2 | 1.50 | 0.20 | 0.37 | 1.47 | 0.57 | 2.03 | 1.67 | 0.85 |
| ThO2 | 0.55 | 0.47 | 1.15 | 0.78 | 2.47 | 0.71 | 0.43 | 0.48 |
| Al2O3 | bd | bd | 0.05 | 0.27 | 2.46 | 2.66 | 2.69 | 2.29 |
| Sc2O3 | bd | bd | - | - | 0.24 | 0.16 | 0.12 | 0.19 |
| Y2O3 | 0.48 | 0.22 | 0.32 | 0.38 | 0.40 | 0.25 | 0.22 | 0.30 |
| La2O3 | 14.41 | 13.85 | 12.40 | 11.94 | 11.14 | 11.02 | 11.53 | 12.01 |
| Ce2O3 | 21.29 | 23.32 | 23.22 | 21.13 | 19.25 | 18.64 | 19.42 | 20.57 |
| Pr2O3 | 1.73 | 1.87 | 3.00 | 1.94 | 1.87 | 1.35 | 1.70 | 1.99 |
| Nd2O3 | 4.38 | 5.88 | 6.57 | 5.47 | 5.67 | 4.95 | 5.08 | 5.87 |
| Sm2O3 | 0.36 | 0.41 | 0.52 | 0.54 | 0.77 | 0.48 | 0.33 | 0.52 |
| Gd2O3 | bd | 0.43 | 0.30 | 0.32 | 0.25 | bd | 0.28 | 0.44 |
| MgO | 0.03 | 0.04 | 0.05 | 0.19 | 0.88 | 0.92 | 0.92 | 1.14 |
| CaO | 3.15 | 1.52 | 1.85 | 4.12 | 5.01 | 6.68 | 6.54 | 4.85 |
| MnO | 0.31 | 0.27 | bd | 0.17 | 0.37 | 0.24 | 0.29 | 0.41 |
| FeO* | 10.64 | 11.38 | 12.24 | 11.31 | 7.80 | 6.63 | 6.76 | 7.32 |
| BaO | bd | bd | - | - | 0.14 | bd | bd | bd |
| Total | 96.09 | 96.46 | 99.68 | 100.01 | 97.70 | 96.31 | 97.70 | 97.74 |
| Formulae on the basis of 22 oxygens | ||||||||
| Ca | 0.725 | 0.356 | 0.418 | 0.891 | 1.082 | 1.415 | 1.375 | 1.045 |
| Ba | 0.000 | 0.000 | 0.000 | 0.000 | 0.011 | 0.000 | 0.000 | 0.000 |
| Y | 0.055 | 0.026 | 0.036 | 0.041 | 0.043 | 0.026 | 0.023 | 0.032 |
| La | 1.142 | 1.115 | 0.964 | 0.889 | 0.828 | 0.804 | 0.835 | 0.891 |
| Ce | 1.675 | 1.864 | 1.792 | 1.561 | 1.421 | 1.349 | 1.396 | 1.514 |
| Pr | 0.135 | 0.149 | 0.230 | 0.143 | 0.137 | 0.097 | 0.122 | 0.146 |
| Nd | 0.336 | 0.458 | 0.494 | 0.394 | 0.408 | 0.350 | 0.356 | 0.421 |
| Sm | 0.027 | 0.031 | 0.038 | 0.038 | 0.053 | 0.033 | 0.022 | 0.036 |
| Gd | 0.000 | 0.031 | 0.021 | 0.021 | 0.017 | 0.000 | 0.018 | 0.029 |
| Th | 0.027 | 0.023 | 0.055 | 0.036 | 0.113 | 0.032 | 0.019 | 0.022 |
| Sum A | 4.122 | 4.053 | 4.048 | 4.014 | 4.113 | 4.106 | 4.166 | 4.136 |
| Fe2+ ( =B) | 1.000 | 1.000 | 1.000 | 1.000 | 1.000 | 1.000 | 1.000 | 1.000 |
| Fe2+ | 0.912 | 1.078 | 1.157 | 0.909 | 0.315 | 0.096 | 0.110 | 0.231 |
| Mn | 0.056 | 0.050 | 0.000 | 0.029 | 0.063 | 0.040 | 0.048 | 0.070 |
| Mg | 0.010 | 0.013 | 0.016 | 0.057 | 0.264 | 0.271 | 0.269 | 0.342 |
| Al | 0.000 | 0.000 | 0.012 | 0.064 | 0.584 | 0.620 | 0.622 | 0.543 |
| Sc | 0.000 | 0.000 | 0.000 | 0.000 | 0.042 | 0.028 | 0.021 | 0.033 |
| Zr | 0.157 | 0.021 | 0.038 | 0.145 | 0.056 | 0.196 | 0.160 | 0.083 |
| Nb | 0.171 | 0.112 | 0.094 | 0.115 | 0.014 | 0.000 | 0.000 | 0.000 |
| Ti | 0.698 | 0.778 | 0.743 | 0.864 | 0.755 | 0.835 | 0.793 | 0.765 |
| Sum B | 2.004 | 2.051 | 2.061 | 2.183 | 2.094 | 2.086 | 2.022 | 2.067 |
| Ti ( =D) | 2.000 | 2.000 | 2.000 | 2.000 | 2.000 | 2.000 | 2.000 | 2.000 |
| Si | 4.018 | 4.010 | 4.052 | 4.006 | 4.008 | 4.027 | 4.047 | 4.021 |
| P | 0.000 | 0.013 | 0.000 | 0.000 | 0.022 | 0.010 | 0.008 | 0.019 |
| Sum T | 4.018 | 4.023 | 4.052 | 4.006 | 4.031 | 4.037 | 4.055 | 4.040 |
| 𝛴 cations | 13.14 | 13.13 | 13.16 | 13.20 | 13.24 | 13.23 | 13.24 | 13.24 |
Analyses 3 and 4 from sample Ttg-hg#1, others from GF1. FeO*, all Fe as Fe2+; bd, below detection; Dash, not determined. Descriptions of crystals are in Supplementary Table 1.
The nature of the lamellar stripes in the CGM was examined using two techniques. Atomic Force Microscopy (AFM) measurements were carried out with a 5500 AFM (Agilent Technologies, Santa Clara, CA, USA). The images were collected in contact mode using PPP-CONT probes (Nanosensors, Neuchâtel, Switzerland) with nominal force constants in the range 0.02–0.77 N/m. Force spectroscopy experiments were performed using AFM PPP-CONT probes. Force versus distance curves were used to obtain the adhesion force with regard to material morphology. Before each experiment, thermal tune methods were employed to determine the spring constants of cantilevers. For each sample, three different 500 nm × 500 nm squares were probed by force–distance measurements. All experiments were conducted at 23 ± 1 °C.
A diffraction pattern from polished thin sections of chevkinite crystals in sample GF1 exhibiting the lamellar striping feature was captured for Electron Back-Scatter Diffraction (EBSD) analysis. The sample was covered with a 4 nm carbon layer for better surface discharge and measured in a Zeiss Auriga equipped with a Bruker e-FlashHR+ detector with integrated ARGUS imaging device. The sample was tilted to 70° using the dedicated stage (tilt about sample X axis) for an optimal EBSD signal. Image tilt correction was used on the Zeiss SmartSEM software and no image rotation was applied. The system was calibrated in Bruker ESPRIT 1.9. The crystal was composed of two differently orientated domains, that were measured as Euler angles: 𝜙1 = 169(1)°, Φ = 120(1)°, 𝜙2 = 141(1)° and 𝜙1 = 349(1)°, Φ = 61(3)°, 𝜙2 = 39(2)°. The pattern centre (PC), in Bruker fractional coordinates, was measured as PCx = 0.48, PCy = 0.15 with a pattern aspect ratio of 1.39 (width/height), detector distance 17.31 mm. Another chevkinite crystal with striping analysed with EBSD had an orientation measured as Euler angles: 𝜙1 = 124.7(9)°, Φ = 42.0(9)°, 𝜙2 = 197(2)°; PCx = 0.47, PCy = 0.47, detector distance 16.8 mm. The EBSD system uses nonstandard settings of monoclinic unit cells for Euler angle determination. For the chevkinite-type crystal structure it is a = 11.1 , b = 13.4 , c = 5.7 , γ = 79°. Further analysis and interpretation were conducted with respect to standard settings of the unit cell axes for chevkinite.
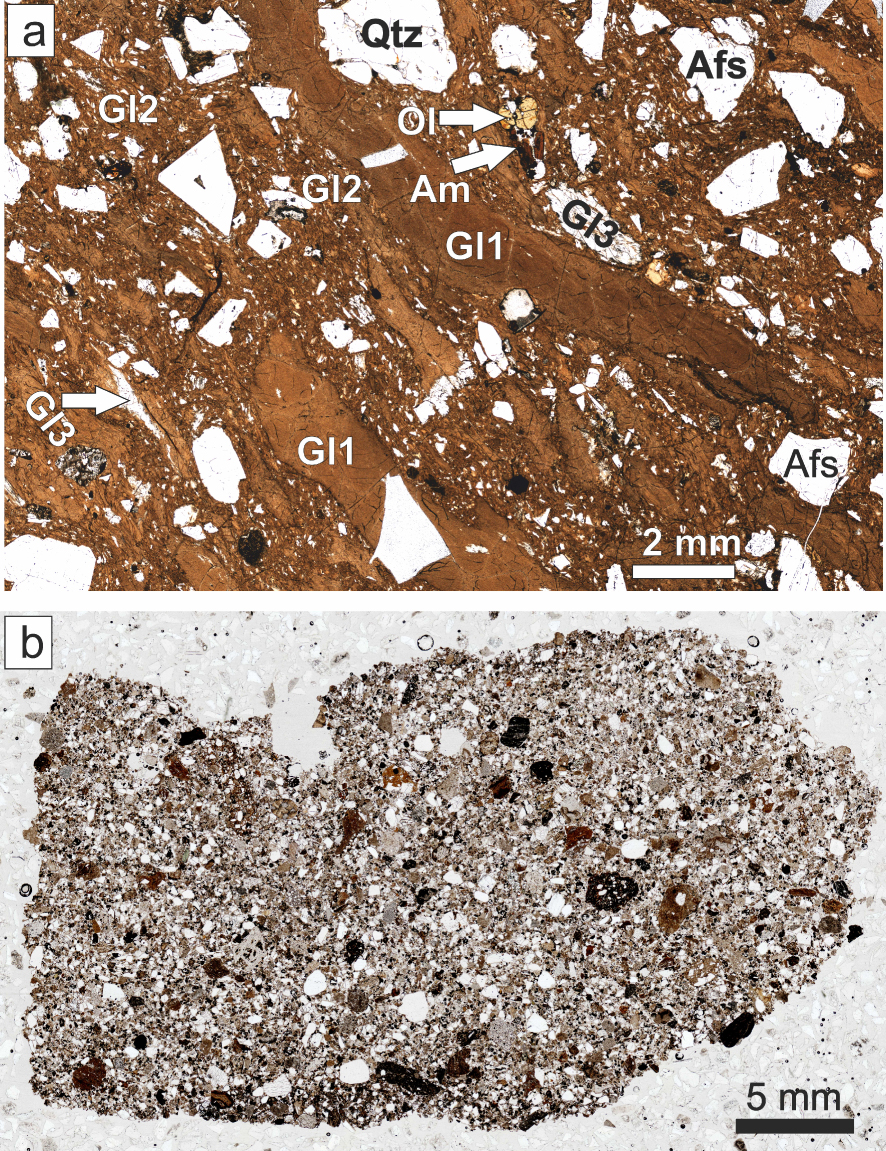
Transmitted-light scans of thin sections of (a) Ttg-hg#1 and (b) GF1. The various types of glass in (a) are described in the text.
4. Petrography
The pantellerite (Ttg-hg#1) contains 35% modally of megacrysts of feldspar (An39Ab59Or2– An0Ab54Or46), quartz, fayalite (Fo2-8), ferrorichterite (Mg∕(Mg + Fe2+) 0.02–0.20), hedenbergite (Ca43.6Mg18.6Fe37.9–Ca41.3Mg8.7Fe47.3), ilmenite (Xilm 94.4–98.1), fluorapatite, CGM and fluorite. With the exception of CGM and fluorite, this is a standard phenocryst assemblage for pantellerites [White et al. 2005, 2009]. The matrix consists of, in addition to the ash matrix, three types of glass (Figure 2a): two (Gl1 and Gl2) are pantelleritic and the third (Gl3) is scarce, poorly phyric or aphyric and comenditic. Sample GF1 contains the same phenocrysts as Ttg-hg#1 except fluorite, and, in addition, phenocrysts of andesine–oligoclase, diopside/augite, forsteritic olivine, calcic amphibole and zircon. The matrix is almost completely devitrified, such that it is difficult to identify the original glassy components (Figure 2b). However, some phenocrysts have thin glassy rims and there are some small glassy fragments, which we were able to analyse.
White et al. [2005] showed that the assemblage of mafic phenocrysts in pantellerites varies with whole-rock peralkalinity; in rocks with P.I. ∼1.5−1.8, as in the Gold Flat pantellerite, the phenocryst assemblage is hedenbergite–fayalite–ilmenite–aenigmatite. Amphibole is present when the P.I. is ∼1.9. Gold Flat differs, therefore, in that amphibole crystallized at slightly lower P.I. and aenigmatite is absent. The large number of “phenocrysts” in GF1 cannot represent an equilibrium assemblage; Macdonald et al. [2019b] argued that the assemblages record magma mixing, the more mafic member in the mixing being of intermediate composition. For example, mixing a magma with SiO2 content of 60 wt% with a magma of Ttg-hg#1 composition (SiO2 69.6 wt%; [Macdonald et al. 2019b]) in the proportion 27:73, would produce a magma of GF1 composition (65.5 wt%).
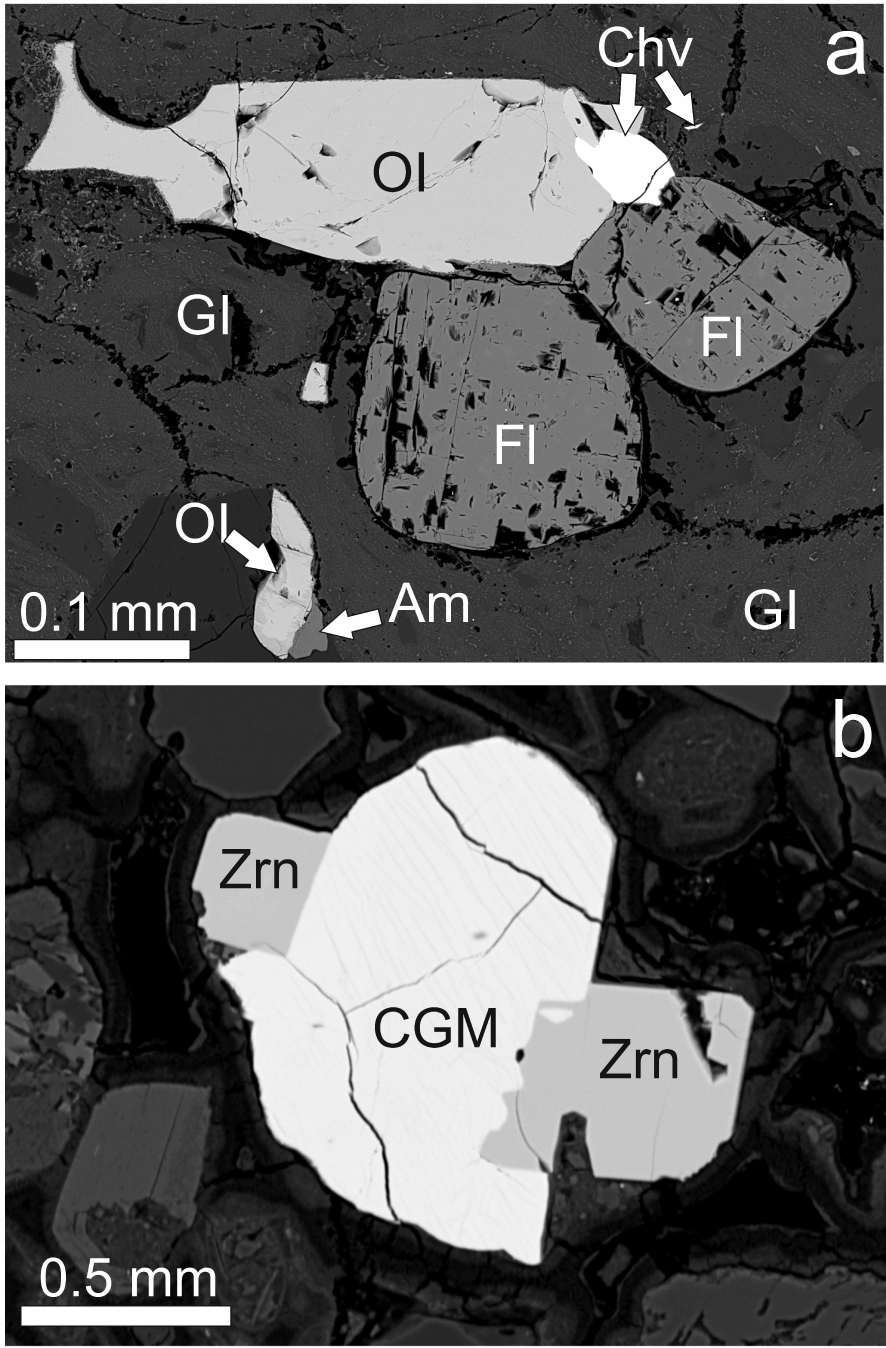
(a) BSE image of chevkinite-(Ce) phenocryst (Chv) associated with olivine and fluorite phenocrysts. Sample Ttg-hg#1. (b) Perrierite-(Ce) associated with phenocrysts of zircon (Zrn). Sample GF1. The CGM shows faint striping, muted by the contrast used.
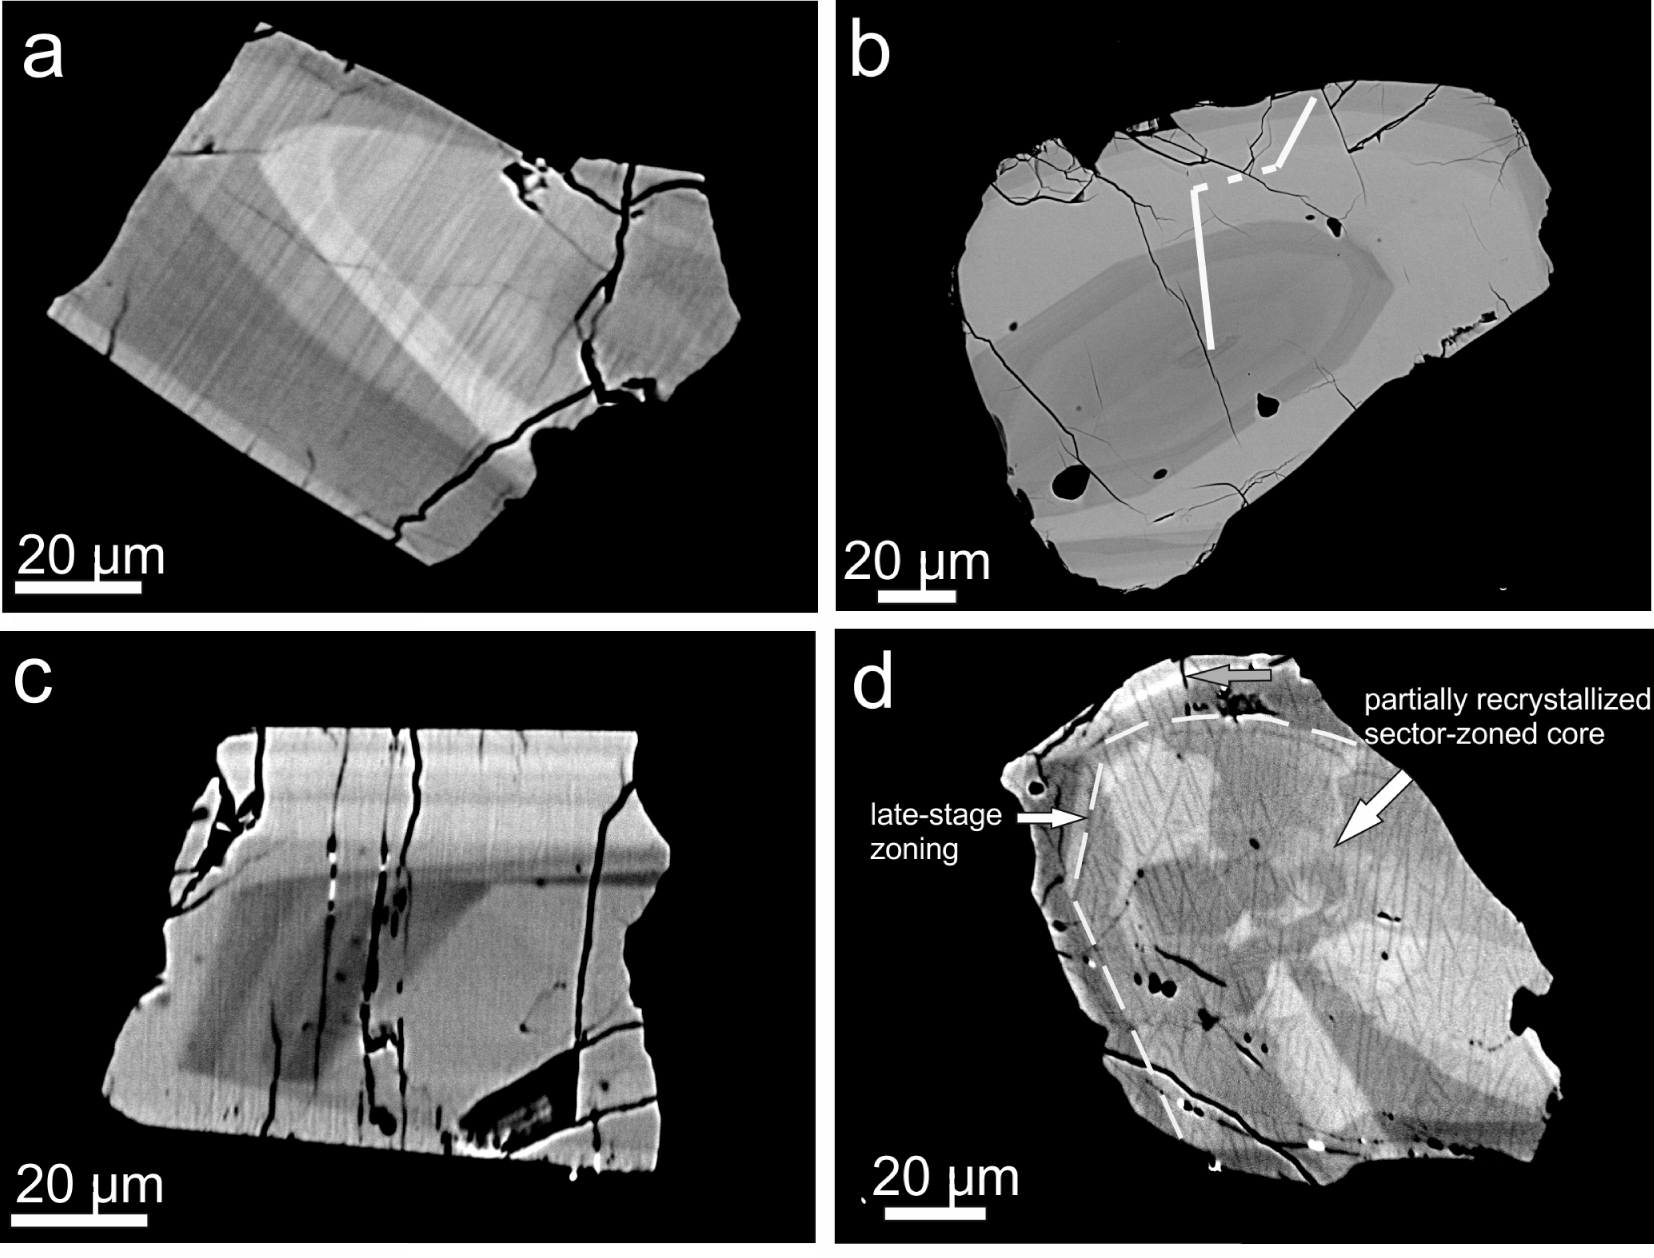
BSE images showing zonation patterns in CGM, all from sample GF1. (a) Oscillatory zonation in chevkinite-(Ce) showing three zones of differing BSE intensity; Supplementary Table 1a, analyses 6–15. (b) Magmatic zonation in chevkinite-(Ce); the compositional range along the marked profile is shown on Figure 6, with the analyses in Supplementary Table 1a, numbers 94–104. (c) Oscillatory zonation formed during two stages of crystallization in chevkinite-(Ce). (d) A partially recrystallized sector-zoned core in perrierite-(Ce) overgrown by an oscillatory-zoned region; analyses 39–50 in Supplementary Table 1a. Masquer
BSE images showing zonation patterns in CGM, all from sample GF1. (a) Oscillatory zonation in chevkinite-(Ce) showing three zones of differing BSE intensity; Supplementary Table 1a, analyses 6–15. (b) Magmatic zonation in chevkinite-(Ce); the compositional range along the marked profile ... Lire la suite
5. Occurrence of CGM
CGMs occur as phenocrysts in both Ttg-hg#1 and GF1, generally forming 10–20 crystals per thin section. They are mainly platy in form, the largest being 114 × 81 μm, varying from subhedral to anhedral. They are commonly associated with other phenocrysts (Figures 3a, b). Although some grains are homogeneous on BSE images, the majority show variably complex magmatic zoning (Figure 4). Two types of zoning are most common: oscillatory and sector. The crystal shown in Figure 4a is oscillatory-zoned, with zones showing three main BSE intensities. That shown in Figure 4b also shows magmatic zonation; a compositional profile was made along the marked line (see below). An earlier core with oscillatory zoning has been mantled by a later oscillatory zonation in Figure 4c. A considerably more complex zonation (Figure 4d) shows an unusual “flower-shaped” sector-zoned, dark central zone and a mantling oscillatory-zoned area (upper left).
Most crystals in sample GF1 show, in addition to magmatic zonation, a slight patchiness on BSE images. This is most visible in dark, low-intensity regions, e.g., the upper part of the crystal in Figure 4d and the black patches in the lower-right part of Figure 5d. The patchiness is ascribed below to minor secondary hydration of the crystals (see below).
An unusual texture is the lamellar striping found in the majority of chevkinite and perrierite crystals, a feature that we have not observed before in CGM. Where present, the feature is restricted to the CGM and is not seen in adjacent crystals (Figures 3a, b). Its apparent absence from some crystals may be a function of the orientation of the texture relative to the thin section cut: the latter may have been parallel to the texture. In Figures 3a and 4b, the contrast used in the BSE images has rather muted the striping, but it is much more clearly visible in Figure 5a. The stripes are 1−2 μm thick, more or less linear, and cut across the compositional zoning. There are variations in the nature of the striping. In Figure 4a, it appears to be perpendicular to the crystal edge. The arrow in Figure 5a points to a stripe offset. The stripes may (Figure 3a) or may not (Figure 5b) reach the crystal rims. While some stripes are regular and parallel, they may also show dislocations, such as the crystal in Figure 5d.
6. Compositions of CGM
Representative compositions of CGM are presented in Table 1; the full data set is given in Supplementary Table 1a. The minerals are classified using the empirical discriminant of Macdonald et al. [2009] (Figure 6). Both chevkinite-(Ce) and perrierite-(Ce) are found in sample GF1, in the approximate ratio 2:1; only chevkinite-(Ce) is present in Ttg-hg#1.
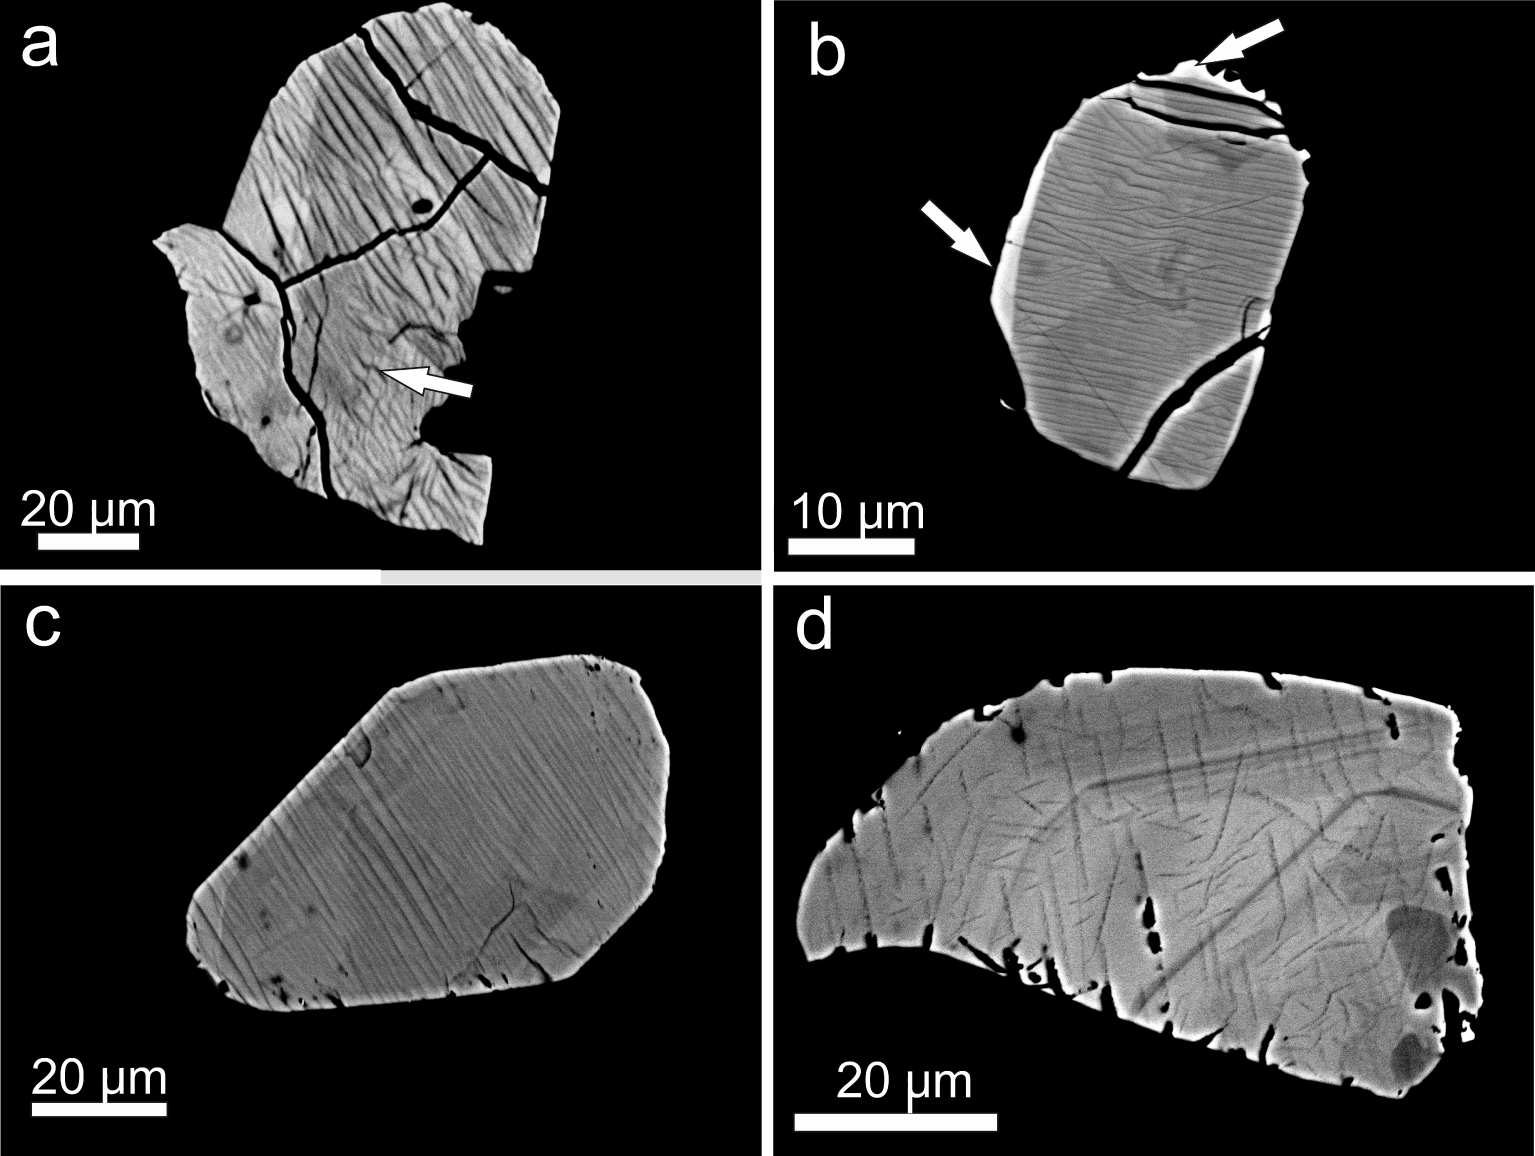
(a) Lamellae strongly developed in partly resorbed chevkinite-(Ce) in sample GF1; Supplementary Table 1a, analyses 65–75. (b) More delicate striping in chevkinite-(Ce), sample Ttg-hg#1. Note that the striping does not reach the bright rim (arrowed). (c) Regular, linear lamellae in perrierite-(Ce), sample GF1. The lamellae reach the rim. (d) Short segments of lamellae cut across oscillatory zoning in chevkinite-(Ce), sample GF1. The darker patches at lower right are slightly more calcic.
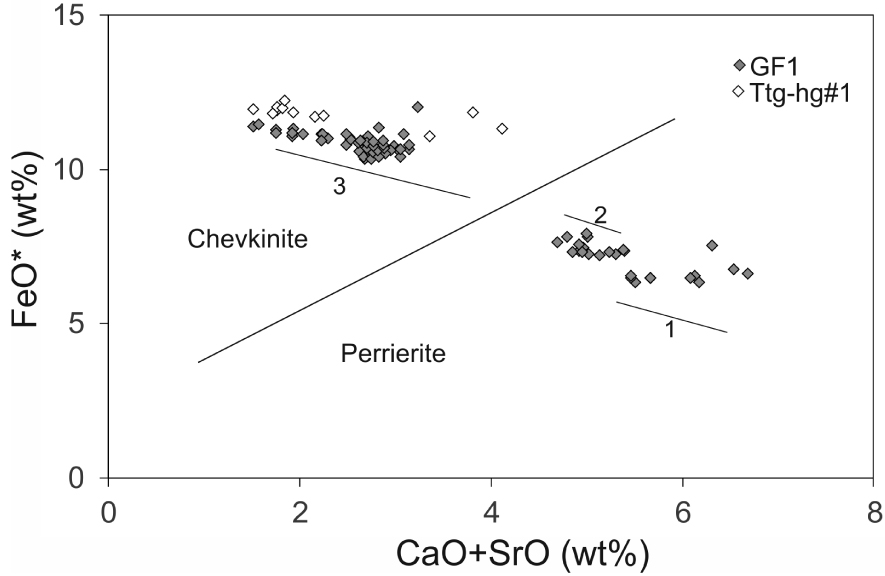
CGM plotted in the empirical discrimination diagram of Macdonald et al. [2009]. Data from Supplementary Table 1a. The thin solid lines mark the compositional ranges in three crystals: Supplementary Table 1a, anals 39–50 ( =1), 51–61 ( =2) and 94–104 ( =3; see Figure 4b).
Before discussing the compositional features, a comment is required on the analytical totals. In their compilation of 253 analyses of chevkinite and perrierite from the literature, Macdonald et al. [2019a] found that the range of analytical totals was 95.5–102.3 wt% (average 98.8 wt%). The low values are due to three effects: (i) some Fe is present in the minerals as Fe3+ but is normally reported as Fe2+ in EPMA analyses; (ii) the nondetermination of minor elements which can be present at significant levels, e.g., M- and H-REE, Nb, Ta and Hf; and (iii) the incorporation into the structure of H2O during hydrothermal alteration. In the Gold Flat case, the analytical totals for all determinations range from 93.8 to 101.4 wt% (average 97.3 wt%). The Fe3+/Fe2+ ratios in the analyses were determined, using stoichiometric criteria, by the method of Droop [1987]; the recalculated FeO and Fe2O3 (wt%) and analytical totals are shown in Supplementary Table 1a. The analytical totals now range from 94.16 to 101.86 wt% (average 97.66 wt%). However, there is an important difference between the minerals in Ttg-hg#1 (chevkinite-(Ce) only) and GF1 (chevkinite-(Ce) and perrierite-(Ce)); the range in Ttg-hg#1 is 99.4–100.5, that in GF1 is 94.2–99.5 wt%. The low values in GF1 are related to the low-BSE-intensity regions in the crystals, as discussed in the Petrography section. This textural feature, and the resulting low totals, are signals of secondary hydration of the minerals [Bagiński et al. 2015]. In Ttg-hg#1, the CGMs are found in nonhydrated pantelleritic glass and have not been secondarily hydrated. GF1 is devitrified and shows signs of late alteration, including an LOI value of 5.41 wt% and the crystals show some signs of the hydration, as noted above.
The chevkinite-(Ce) contains generally higher levels of La2O3-Sm2O3 (41.02–46.28 wt%) than the perrierite-(Ce) (36.44–40.96 wt%) and also of Nb2O5 (0.75–1.76 wt%, b.d. −0.17 wt%, respectively). It also has lower levels of MgO (b.d. −0.40 wt%, 1.35–2.11 wt%), Al2O3 (b.d. −0.34 wt%, 2.12–2.75 wt%) and Sc2O3 (b.d. −0.11 wt%, 0.12–0.24 wt%). There is a large overlap of ZrO2 abundances (0.20–1.50 wt%, 0.56–2.03 wt%). The compositions of both the chevkinite-(Ce) and perrierite-(Ce) are within the ranges compiled from the literature by Macdonald et al. [2019a]. In chevkinite-(Ce), Fe > Ti in the C site, while Ti > Fe in the perrierite-(Ce). Mineral formulae for the least and most calcic analyses can be written:
(Ce1.86La1.12Nd0.46Ca0.36Pr0.15)3.95Fe2+(Fe2+1.08Ti0.78Nb0.11)1.97(Si2O11)2 and (Ca1.42Ce1.35La0.80Nd0.35 Pr0.10)4.02Fe2+(Ti0.84Al0.62Zr0.20Mg0.27Fe2+0.10)2.03 (Si2O11)2 (Table 1, anals 2 and 6, respectively). Individual crystals show significant parts of the compositional range (Figure 6), including the profile shown in Figure 4b.
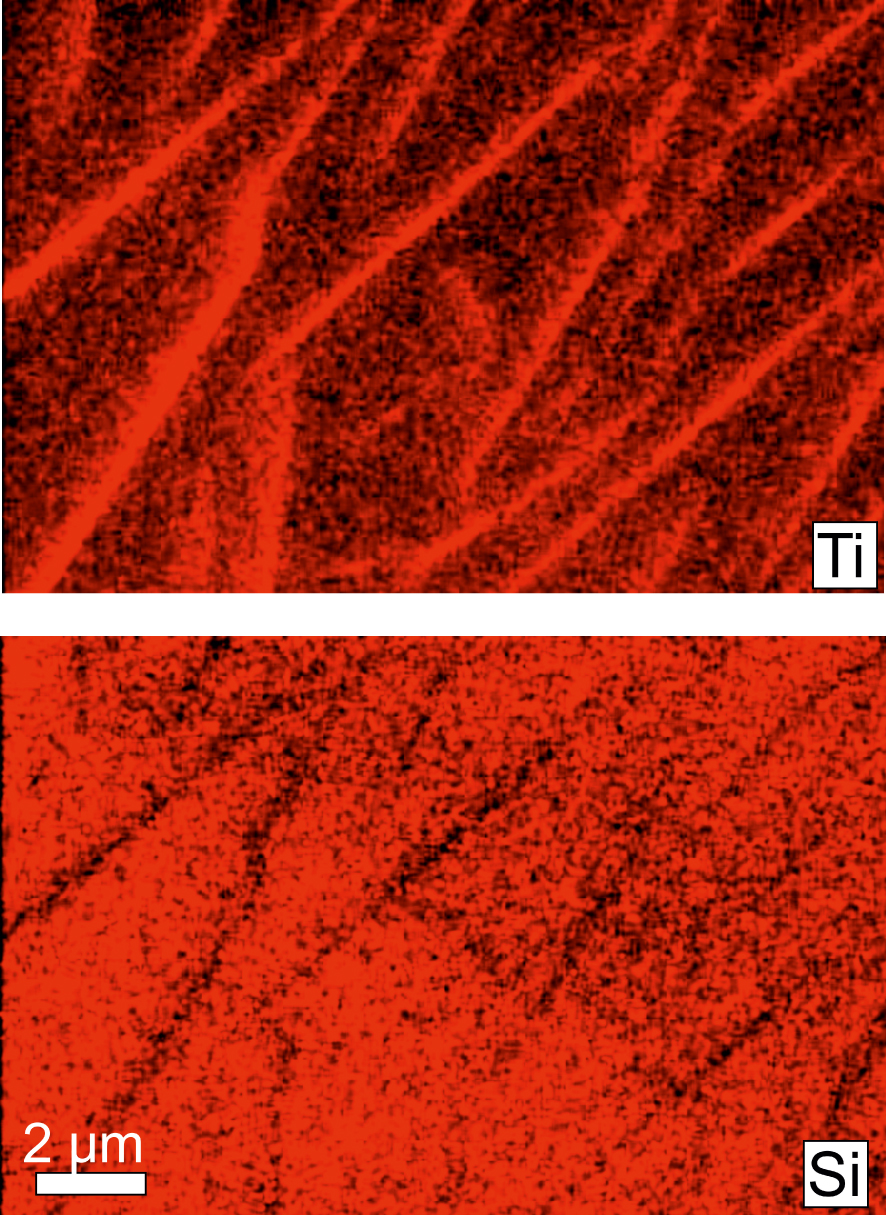
False-colour element maps (Ti and Si) of striping in part of crystal shown in Figure 4a.
7. Nature and formation of lamellae
The fine scale of the lamellar stripes (1−2 μm) means that their microprobe analyses are invariably composites of lamella and adjacent crystal. An attempt, therefore, was made to determine their nature using element maps (Figure 7). On the maps, the lamellae are higher in Ti, and to a lesser extent Fe (not shown), and lower in Si, than the host CGM. Those features suggested the possible presence of a TiO2 phase. An attempt was made, therefore, to characterize the Ti-rich zones using Atomic Force Microscopy (AFM).
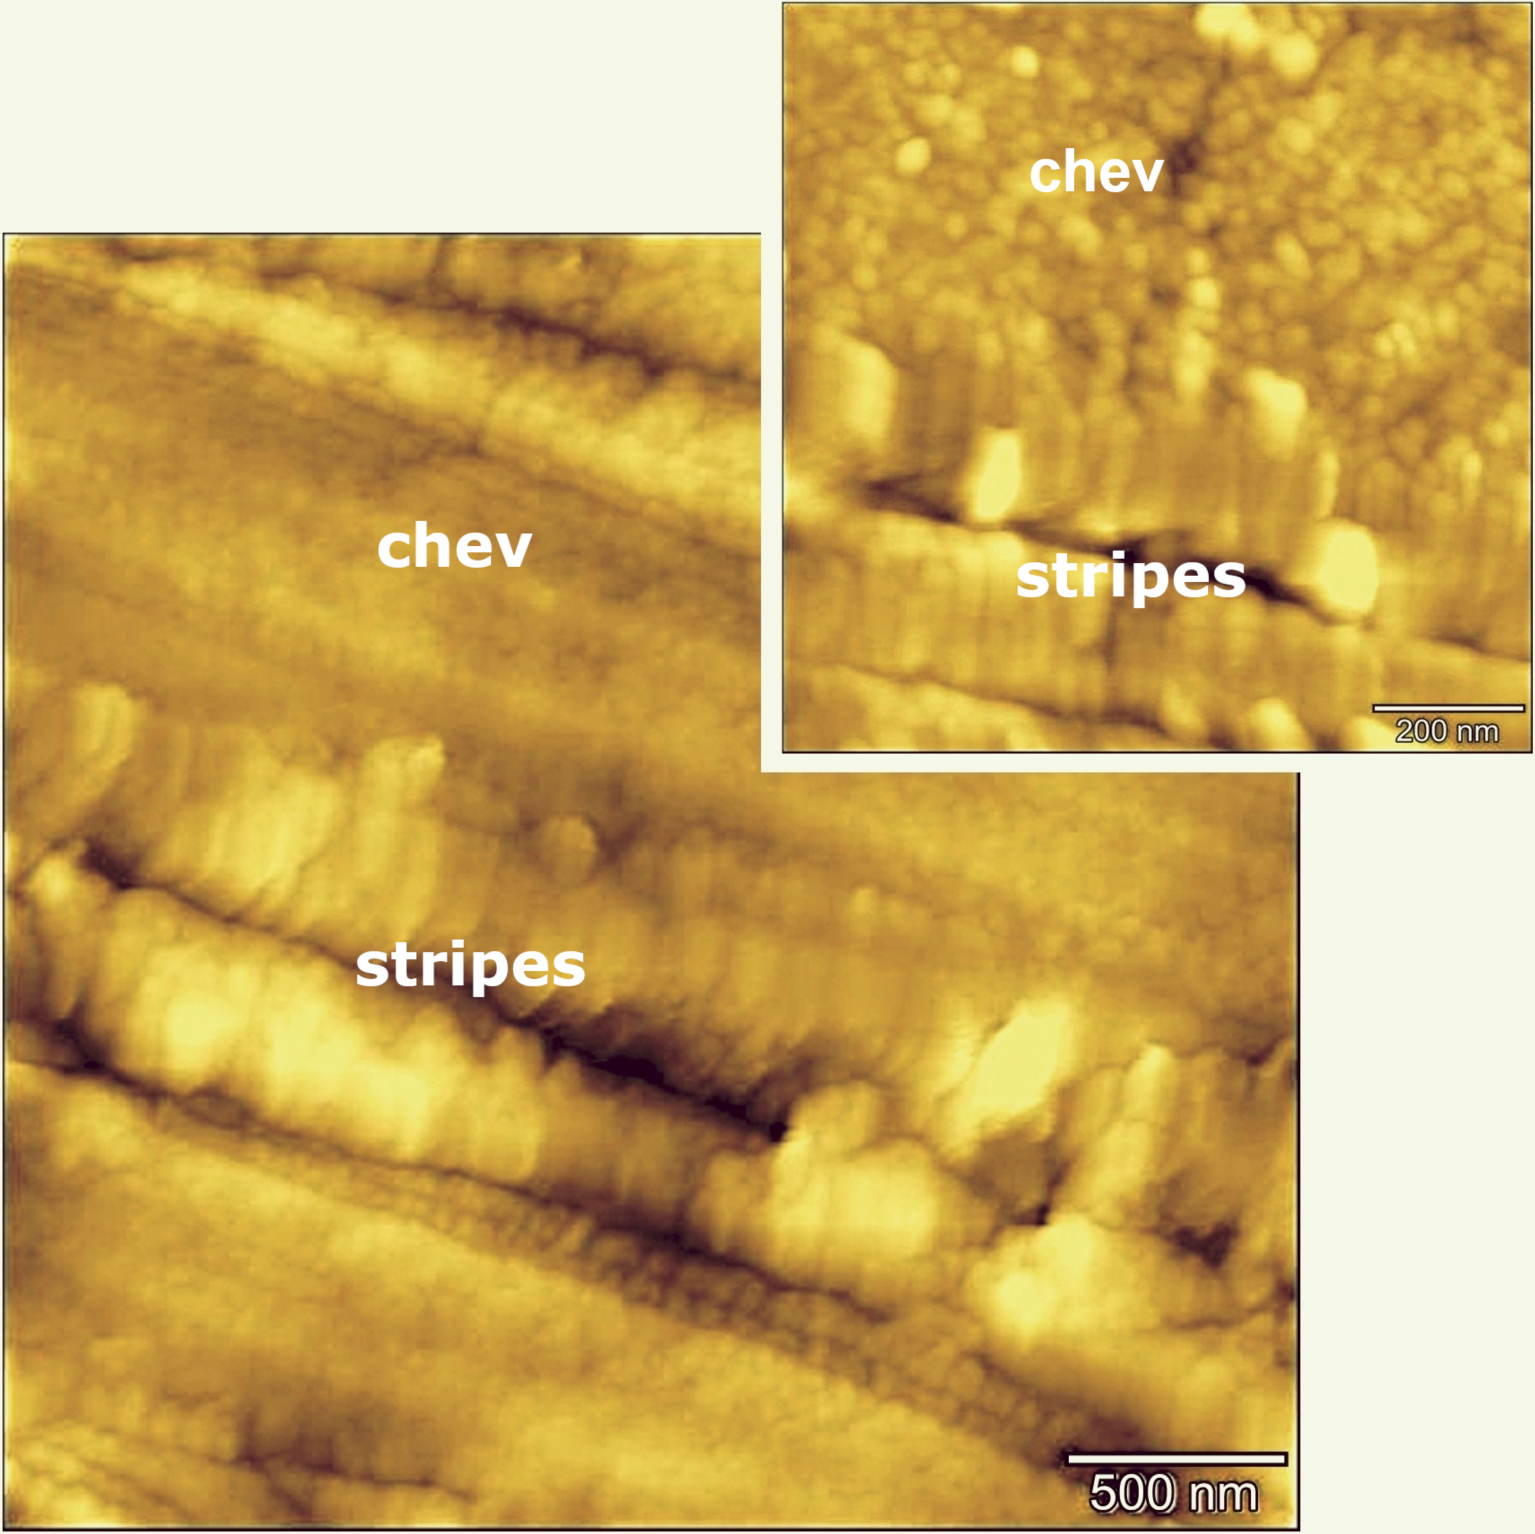
Surface topography of lamellae in chevkinite-(Ce) determined by AFM. Domains related to the host mineral and the stripes are shown. The crystal is that shown in Figure 5b.
AFM images of reference rutile and chevkinite-(Ce) free of stripes present similar, even surface topography. In contrast, an image of GF1 chevkinite-(Ce) revealed a stripe-like organization with two distinct domains; the surface topography is displayed as a pseudocolour plot in Figure 8, where the chevkinite domain with grain-like features is separated by lamellar Ti-rich structures. We cautiously suggest that the lamellar structures have an increased degree of disorder and are not fully crystalline. The histograms of counts against adhesion force were determined for a reference chevkinite and showed that its adhesion force range is 3–4 nN, and for a reference rutile to be 4–8 nN. The range across the lamellae is 3–6 and is taken to be a superposition of chevkinite and rutile histograms. The Ti-rich lamellae would appear, therefore, to consist at least partly of a rutile-like phase.
The fact that the lamellae are oriented argues for subsolidus precipitation, perhaps by exsolution. Rutile has been recorded as exsolution inclusions in several phases, including biotite [Shau et al. 1999], garnet [Hwang et al. 2007; Keller and Ague 2019], titanian columbite [Černý et al. 2007], quartz [Adachi et al. 2010] and gem corundum [Palke and Breeding 2017]. It most commonly occurs as oriented needles, indicating a crystallographic control on the exsolution [Keller and Ague 2019]. Several workers have drawn attention to the presence of a rutile-like layer in CGM, e.g., Calvo and Faggiani [1974], Gueho et al. [1995], Li et al. [2005] and Holtstam et al. [2017]. In Figure 9, the top panel shows the crystal structure of rutile and the bottom panel shows chevkinite with a rutile-like layer in the centre. The layer is formed by CO6 and DO6 distorted coordination octahedra, the distortion making the oxygen atoms (red) misaligned compared to the rutile arrangement. We speculate that the rutile lamellae in the Gold Flat CGM formed along this rutile-like layer, which might have been energetically/kinetically favourable sites for rutile nucleation.
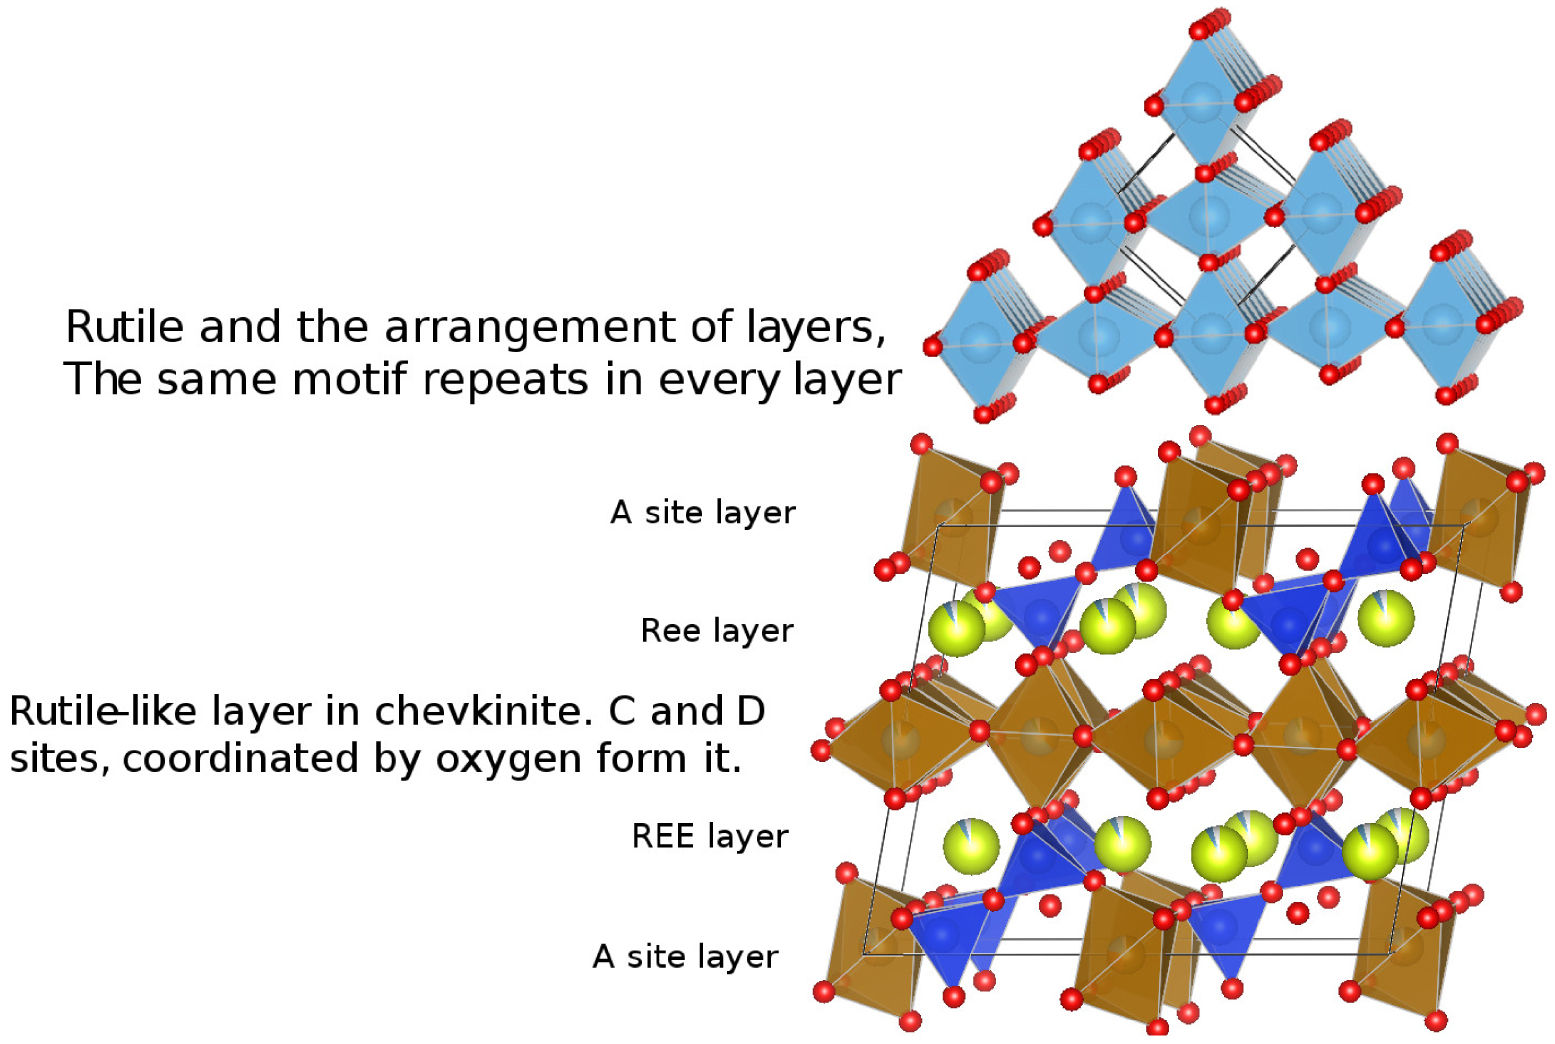
Arrangement of layers in rutile (upper) and a visualization of the rutile-like layer in chevkinite.
There are, however, some problems with this proposal. Concentration of Ti in the lamellae should have left neighbouring areas depleted in Ti, but this is not obvious on the chemical maps (Figure 7). A cautious conclusion, therefore, is that during cooling of the magmas, the CGM structure in both chevkinite-(Ce) and perrierite-(Ce) became unstable and exsolved a rutile-like phase along the rutile-like layer. That does not, however, explain why the lamellar striping is, in our experience, restricted to the Gold Flat Tuff; neither is it clear what promoted the exsolution.
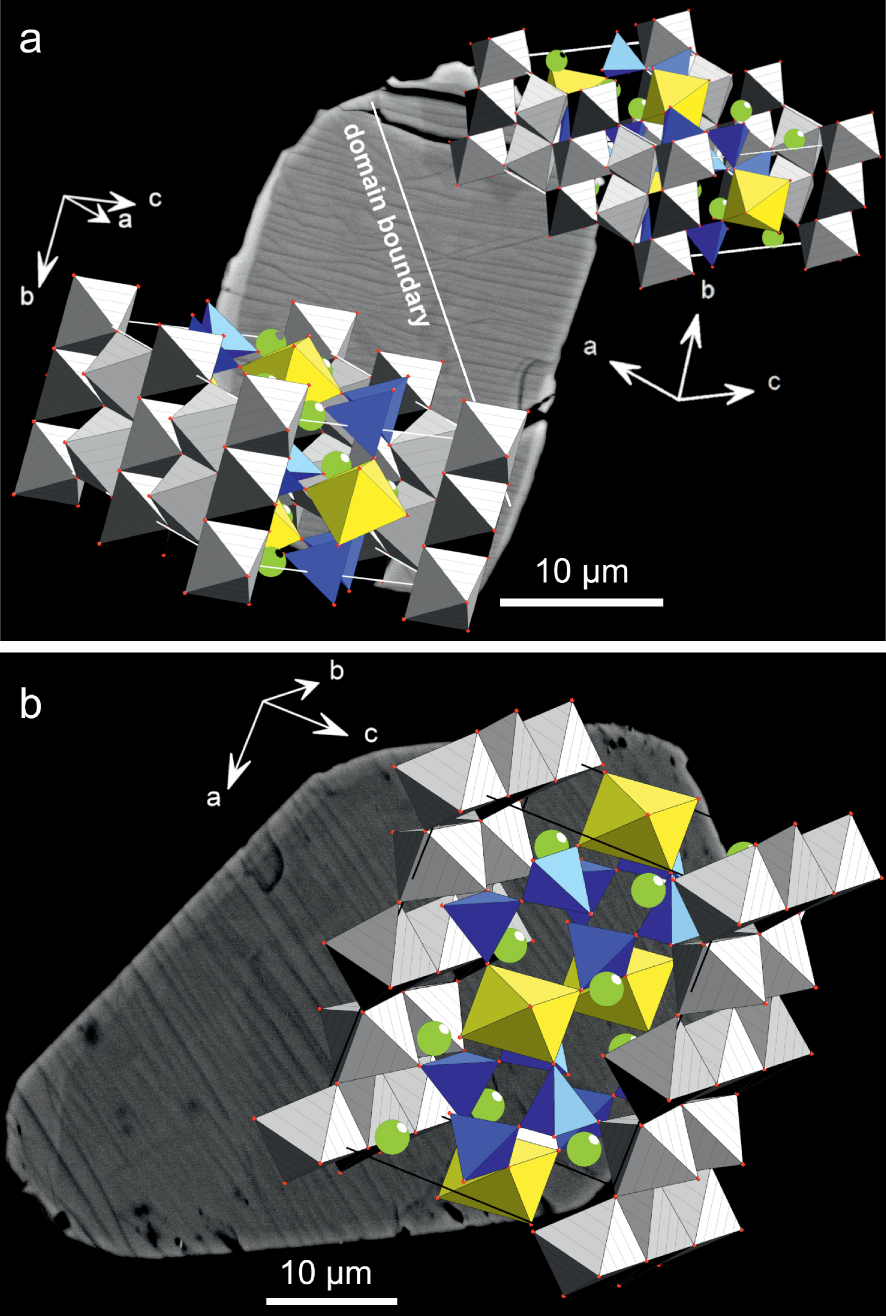
(a) Rotation of the structure in a chevkinite-(Ce) crystal revealed by EBSD, the boundary between the two domains coinciding with minor displacements of the lamellae. The crystal is that shown in Figure 5b. (b) In the crystal (Figure 5c), the lamellae are regular and the structure is not rotated.
An EBSD study revealed an unexpected aspect of the chevkinite-(Ce) structure. The crystal shown in Figure 10a shows a distinct, if minor, change in direction of the stripes along a line orientated NW–SE. The crystal consists of two structural domains, with one domain rotated relative to the other, as shown by the orientation of the a, b and c axes. The stripes are perpendicular to the crystallographic unit cell direction b = 5.7 . The grey MO6 octahedra are parallel to the ab crystallographic plane from rutile-like layers in the chevkinite-(Ce) structure. In contrast, the crystal in Figure 10b showing regular, linear stripes does not have the two-domain structure. It is unknown what caused the rotation of the structure in Figure 10a, but it is important to note that its existence was not visible in standard optical and BSE imaging, being revealed only by EBSD. The result raises the possibility that such structural dislocations occur more frequently than presently understood.
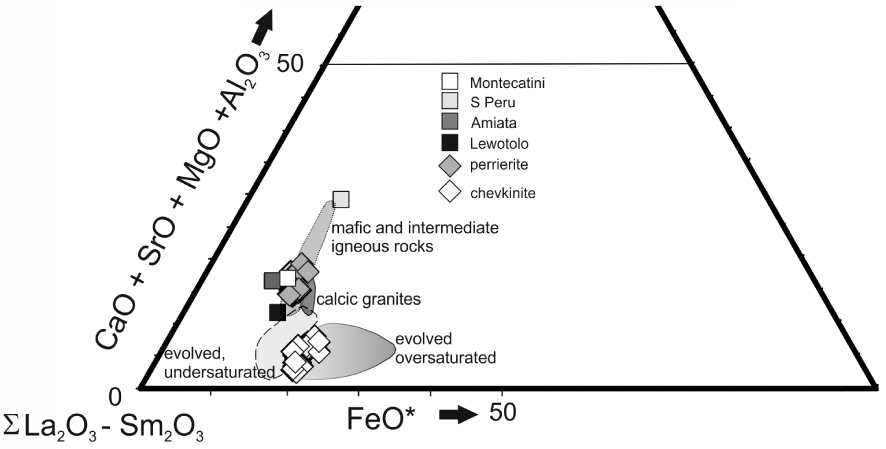
Triangular plot to show the different paragenesis of chevkinite and perrierite (slightly simplified from [Macdonald and Belkin 2002]). Data from Supplementary Table 1a. Perrierites from various “trachyandesitic” hosts overlap the Gold Flat field: Mt Amiata, Italy [Van Bergen 1984]; Montecatini, Italy [Cellai et al. 1993]; Lewotolo, Indonesia [de Hoog and van Bergen 2000]; southern Peru [Carlier and Lorand 2008].
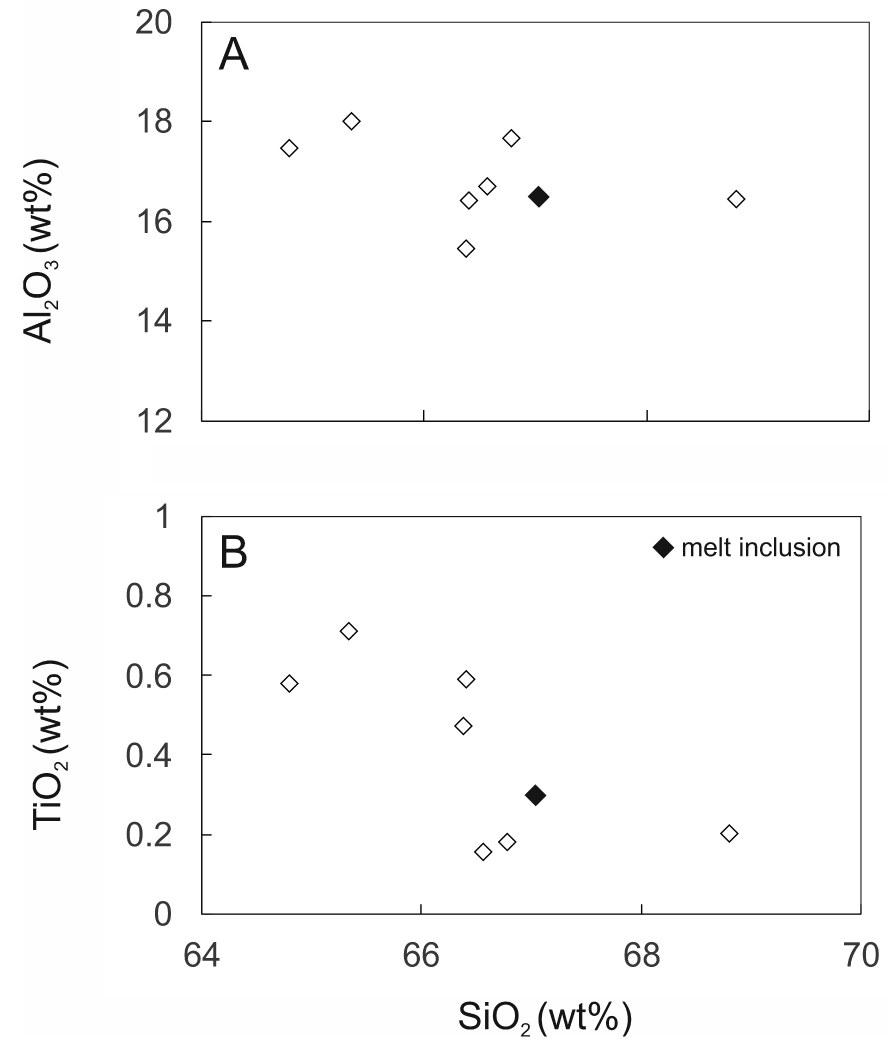
SiO2 plotted against (a) Al2O3 and (b) TiO2 in matrix glass from GF1. Data from Supplementary Table 1b, recalculated to 100% anhydrous. Also shown is the composition of a trachytic melt inclusion from the Gold Flat Tuff [Macdonald et al. 2019b].
8. Discussion
8.1. Paragenesis of the CGM
Using a (CaO + SrO + MgO + Al2O3) −𝛴(La2O3 −Sm2O3) – FeO* plot, Macdonald and Belkin [2002] showed that in igneous rocks chevkinite generally occurs in evolved rock types, such as rhyolites, granites and nepheline syenites, whereas perrierite is normally found in intermediate rocks. In such a plot (Figure 11), the Gold Flat CGM form two clusters, consistent with formation in different magmas, as already shown by the different phenocryst assemblages. Also shown are perrierites from rocks of intermediate (broadly trachyandesitic) composition, suggesting that more perrieritic minerals at Gold Flat are also formed from intermediate magmas. This is confirmed by the analyses of glassy fragments and crystal rims in GF1 (Supplementary Table 1b). Important features of the analyses are: (i) Some of the analytical totals are low (92.2–100.5 wt%), which can be ascribed to secondary hydration of the glass; (ii) There has clearly been some mobilization of the alkalis and Ca; (iii) Aluminium, Ti (Figure 12) and Fe show negative trends, and Na a positive trend, plotted against SiO2; (iv) The spread of data encloses for all elements the composition of a trachytic melt inclusion found in a clinopyroxene in a feldspar cluster [Macdonald et al. 2019b]. In the SiO2–alkalis classification, the analyses (with SiO2 in the range 64.8–66.8 wt%, calculated anhydrous to 100%) plot in the trachyte field, close to the border with trachyandesite.
With the caveat that the vertical and lateral variations in lithology in the Gold Flat tuff are not well constrained, the following crystallization history of CGM in the tuff can be proposed. As shown by glass analyses in sample Ttg-hg#1, the tuff comprises pantelleritic and comenditic magmas. Using various SiO2 plots, Macdonald et al. [2019b] showed that the two magmas had evolved along different trends and were derived from two evolving magma reservoirs. As discussed above, there is also petrographic, and mineral and glass compositional, evidence that intermediate magmas were components in the tuff.
Some information on the crystallization history comes from crystal zoning. Most common in the CGM is oscillatory zoning (Figures 4a, b), generally ascribed to repetitive kinetic effects during crystallization [Paterson and Stephens 1992; Tepper and Kuehner 1999]. The other type, particularly well shown in Figure 4d, is sector zoning and we suggest that the texture in that image represents a sector-zoned core which was partially recrystallized during a later stage of crystallization. Sector zoning has been ascribed to slow growth and low diffusivity during crystallization [Schaltegger et al. 1999; Watson and Liang 1995]. A possible model for the Gold Flat case is, therefore, of a relatively prolonged stage of perrierite-(Ce) growth in an intermediate magma and chevkinite-(Ce) in a pantelleritic magma, followed by more rapid changes promoting oscillatory zoning around the core and recrystallization of the core before magma mixing. The intermediate magma was then mingled with the chevkinite-(Ce)–bearing pantellerite magma but with insufficient time before eruption for new mantles to form on existing crystals.
8.2. Formation of chevkinite-(Ce) in a pantellerite
It was noted earlier that the Gold Flat Tuff is the only pantelleritic extrusive known to carry CGM phenocrysts. Possible explanations for this unusual paragenesis are that it was related to a compositional effect or unusual P–T–fO2–aSiO2 conditions of crystallization. For example, the high LREE contents (La–Sm ⩽1517 ppm; [Macdonald et al. 2019b]), the highest levels in a pantellerite of which we are aware, may have been a critical factor in forming the chevkinite-(Ce). However, chevkinite is a common phase in the comendites in the BMVC which have lower LREE contents (⩽600 ppm) than the pantellerite (e.g., [Vogel et al. 1983, 1989]). Unfortunately, no compositional or structural information is available on these phases and it is possible that they are antecrystic perrierite, able to crystallize from magmas poorer in REE.
Alternatively, the appearance of CGM may have been related to the crystallization conditions. Little is known about the P–T conditions under which the various Gold Flat magmas evolved, but Macdonald et al. [2019b] cautiously suggested, on the basis of comparisons with high P–T experiments on compositionally similar pantellerites from Eburru, Kenya [Scaillet and Macdonald 2006] and Pantelleria [Di Carlo et al. 2010], that the pantelleritic magma started crystallizing at a temperature of ∼740 °C, close to or at water saturation, at fO2 below FMQ. However, the Kenyan and Pantescan rocks and the experiments did not form chevkinite under any conditions. In contrast, Scaillet and Macdonald [2001] synthesized chevkinite-(Ce) in two comendites from the Olkaria complex, Kenya, although its stability field was poorly constrained.
However, the explanation for the formation of chevkinite-(Ce) may lie in the absence of aenigmatite from the Gold Flat pantellerite. On the basis of thermodynamic modelling, Macdonald et al. [2011] found the antipathetic relationship between fayalite and aenigmatite to be a function of T, P and aSiO2, with aenigmatite crystallizing at the expense of fayalite at T < 750 °C at aSiO2 close to quartz saturation at 150 MPa. Macdonald et al. [2011] showed that the aenigmatite–phyric pantellerites of Pantelleria crystallized at aSiO2 = 1. Using the QUILF programme from olivine–magnetite–ilmenite equilibrium, Andersen et al. [1993], Macdonald et al. [2019b] calculated the aSiO2 relative to quartz saturation for the Gold Flat pantellerite to be 0.633 at P = 1000 bar, potentially favouring the absence of aenigmatite in favour of fayalite + ilmenite. Titanium was not, therefore, partitioned into aenigmatite but instead partitioned between ilmenite and chevkinite-(Ce). In addition to its unusual compositional features and complex evolutionary history, the Gold Flat Tuff pantellerite may have crystallized in an unusual corner of P–T–fO2–aSiO2 space.
9. Conclusions
The study has revealed unusual features of the occurrence and textures of CGM which may be of more general significance in studies of accessory minerals. More generally, we suggest that the use of AFM will offer to geologists another technique to apply to the study of such phases.
- (1) The coexistence of chevkinite-(Ce) and perrierite-(Ce) in the Gold Flat Tuff was a result of the mixing of pantelleritic and intermediate magmas.
- (2) The unique occurrence of a CGM in a pantelleritic extrusive may have been due to the host magmas crystallizing at a relatively low aSiO2, favouring the formation of ilmenite and chevkinite rather than aenigmatite. The unusually high contents of LREE may also have played a role in its formation.
- (3) An unusual lamellar texture in the CGM, not previously recorded in the group, may have formed by exsolution of a Ti-rich phase from a rutile-like layer in the crystal structure. We provide no explanation of why the texture has been described only from the Gold Flat Tuff.
- (4) An EBSD study unexpectedly revealed a structural rotation in the crystal, which was not visible optically or by electron back-scattered imaging. The phenomenon may be of wider occurrence than currently recognized.
- (5) Zonation patterns in the CGM have established a complex pre-eruptive evolutionary history in the magma reservoir.
Acknowledgements
We thank Bruno Scaillet for the invitation to contribute this paper to the Special Issue and Donald C. Noble for supplying the sample of Ttg-hg#1. We also thank Lidia Jeżak and Petras Jokubauskas (EPMA) and Marcin Syczewski (SEM) for analytical support. Two anonymous reviewers provided very helpful comments and suggestions, which are much appreciated. The research was funded by National Science Centre, Poland, grant number 2017/26/M/ST10/00407. The work was also supported through the Innovative Economy Operational Program POIG.02.02.00-00-409 025/09 (NanoFun; Cryo-SEM microscopy lab).
Vous devez vous connecter pour continuer.
S'authentifier