


 CC-BY 4.0
1. Introduction
On 10 May 2018, the seismic stations on the western Indian Ocean recorded seismic activity that quickly became an intense sequence, with hundreds of felt earthquakes, including several events of magnitude above 5.0 recorded by the international networks [Cesca et al. 2020; Lemoine et al. 2020a; Bertil et al. 2021]. This unusually deep (40 km) seismicity [Cesca et al. 2020; Lemoine et al. 2020a] occurs in the eastern part of the Comoros archipelago, east of Mayotte, in a region not known previously for being seismically active [Figure 1; Bertil and François 2016; Bertil et al. 2021]. The magnitude of the seismic events and the duration of the sequence surprised the population, the local authorities, and the scientific community. Past volcanic episodes in the Comoros archipelago, including Mayotte and offshore areas, remain poorly documented [e.g., Zinke et al. 2003a, b; Michon 2016; Famin et al. 2020], except for the recent volcanic-related seismicity of the Karthala volcano, on Grande Comore [Figures 1 and 2; Bachèleryet al. 2016]. In 2019, one year after the beginning of the sequence, a new 820 m-high volcanic edifice (called “NVE” in Feuillet et al. [2021]) and several subsequent lava flows, corresponding to an estimated volume of 6.55 km3, were discovered on the seafloor 50 km east of Mayotte [Figure 1c; Rinnert et al. 2019; Feuillet et al. 2021; REVOSIMA 2022]. This seismo-volcanic event is the largest and best-monitored submarine eruption to date [Feuillet et al. 2021].
Regional historical and instrumental seismicity over the period 1900 to 2020 across the Mozambique channel and the Comoros, and surrounding areas [Bertil et al. 2021]. Black lines are plate boundaries [modified from Stamps et al. 2018]. (a, b) Bathymetry from GEBCO 2014 [Weatherall et al. 2015]. (c) Compilation from Lemoine et al. [2020b] including HOMONIM data [SHOM 2015] and MAYOBS data [Feuillet et al. 2021]. Red triangle in (c) indicates the position of the Fani Maoré volcano. All figures have been done using GMT 5 [Wessel et al. 2013].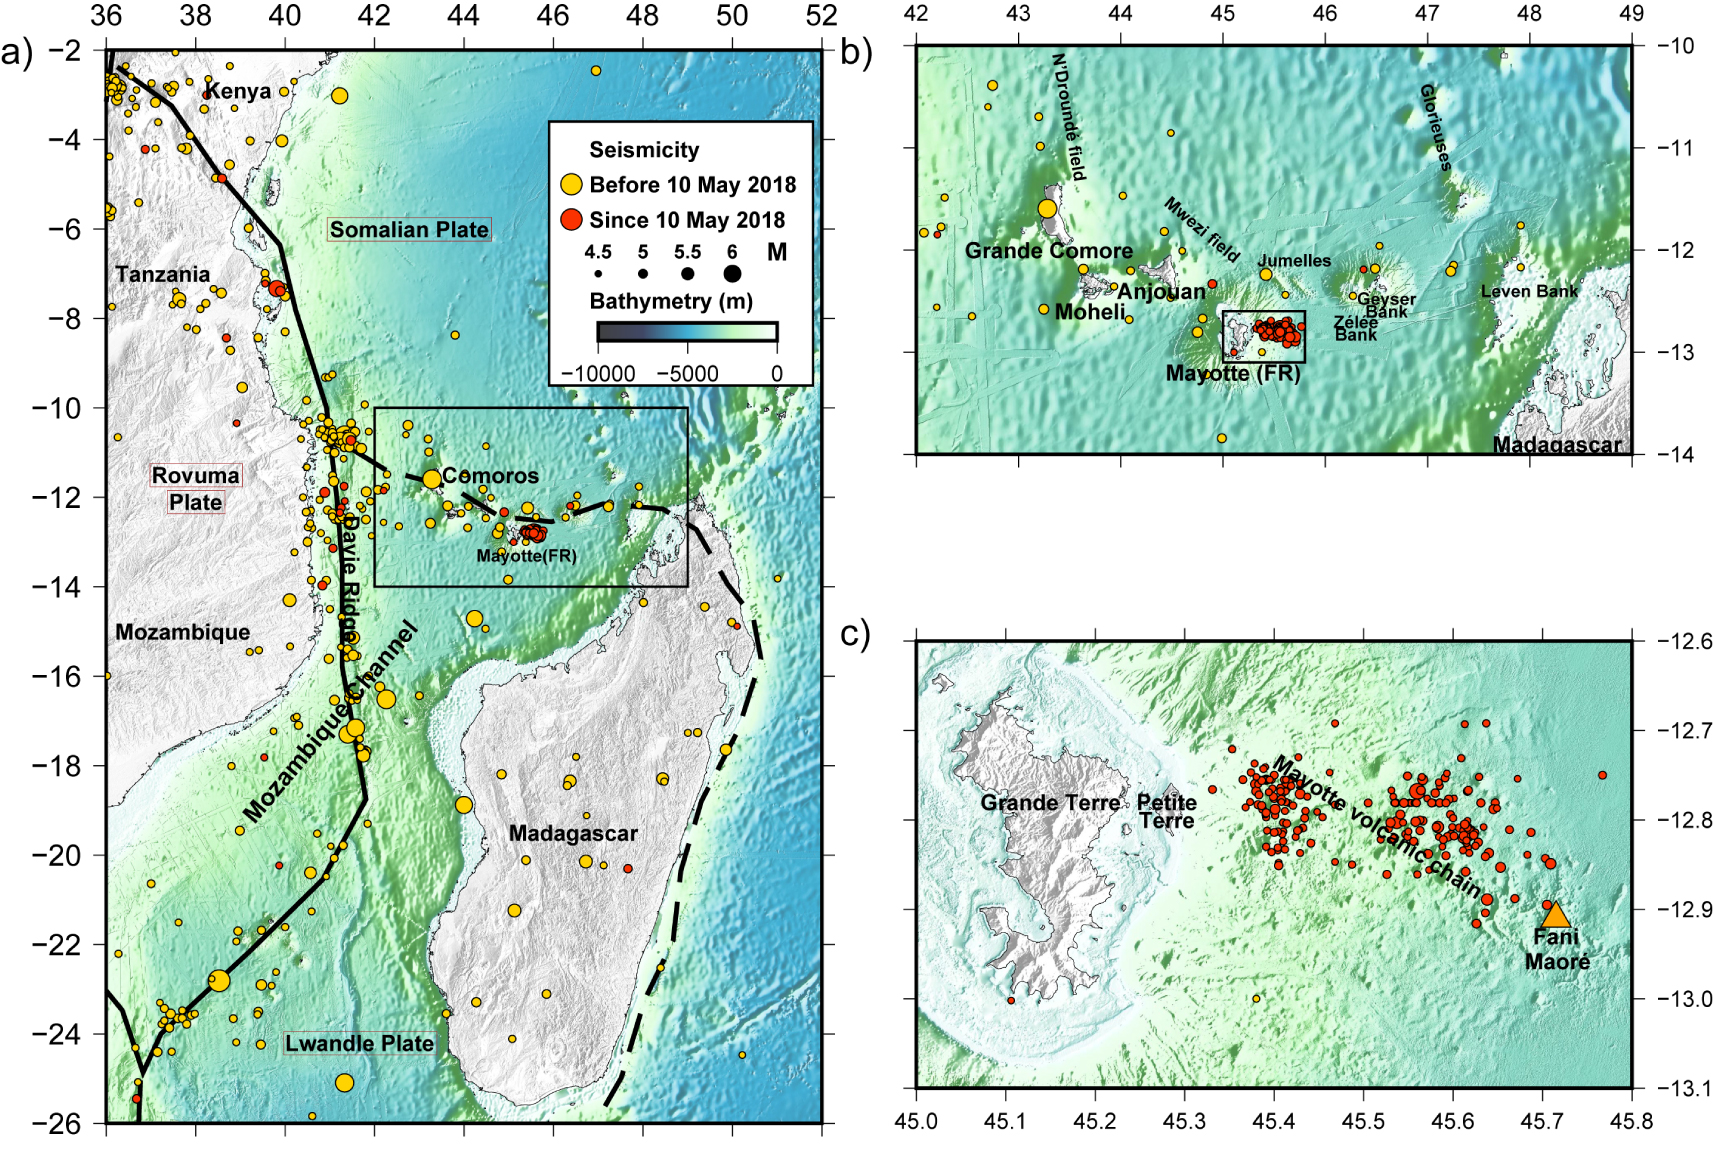
(a) Regional seismic stations network. (b) Karthala broadband station network. (c, d) Inland seismic network in Mayotte at two dates, 1 September 2018 and 1 April 2019, respectively. See also Table 1. (e) Period of data acquisition of local and regional stations over the period May 2018 to August 2018. Network geometries N1 to N8 are indicated (see Supplementary document 1). Vertical red and green lines correspond to the loss of the North Madagascar seismic station GE.SBV, and addition or restart of a seismic station, respectively. (f) Azimuthal gap evolution over time. White and grey shading are successive phases (see text for details). Bathymetry: (a) and (b) same as Figure 1a,c and (d) same as Figure 1c.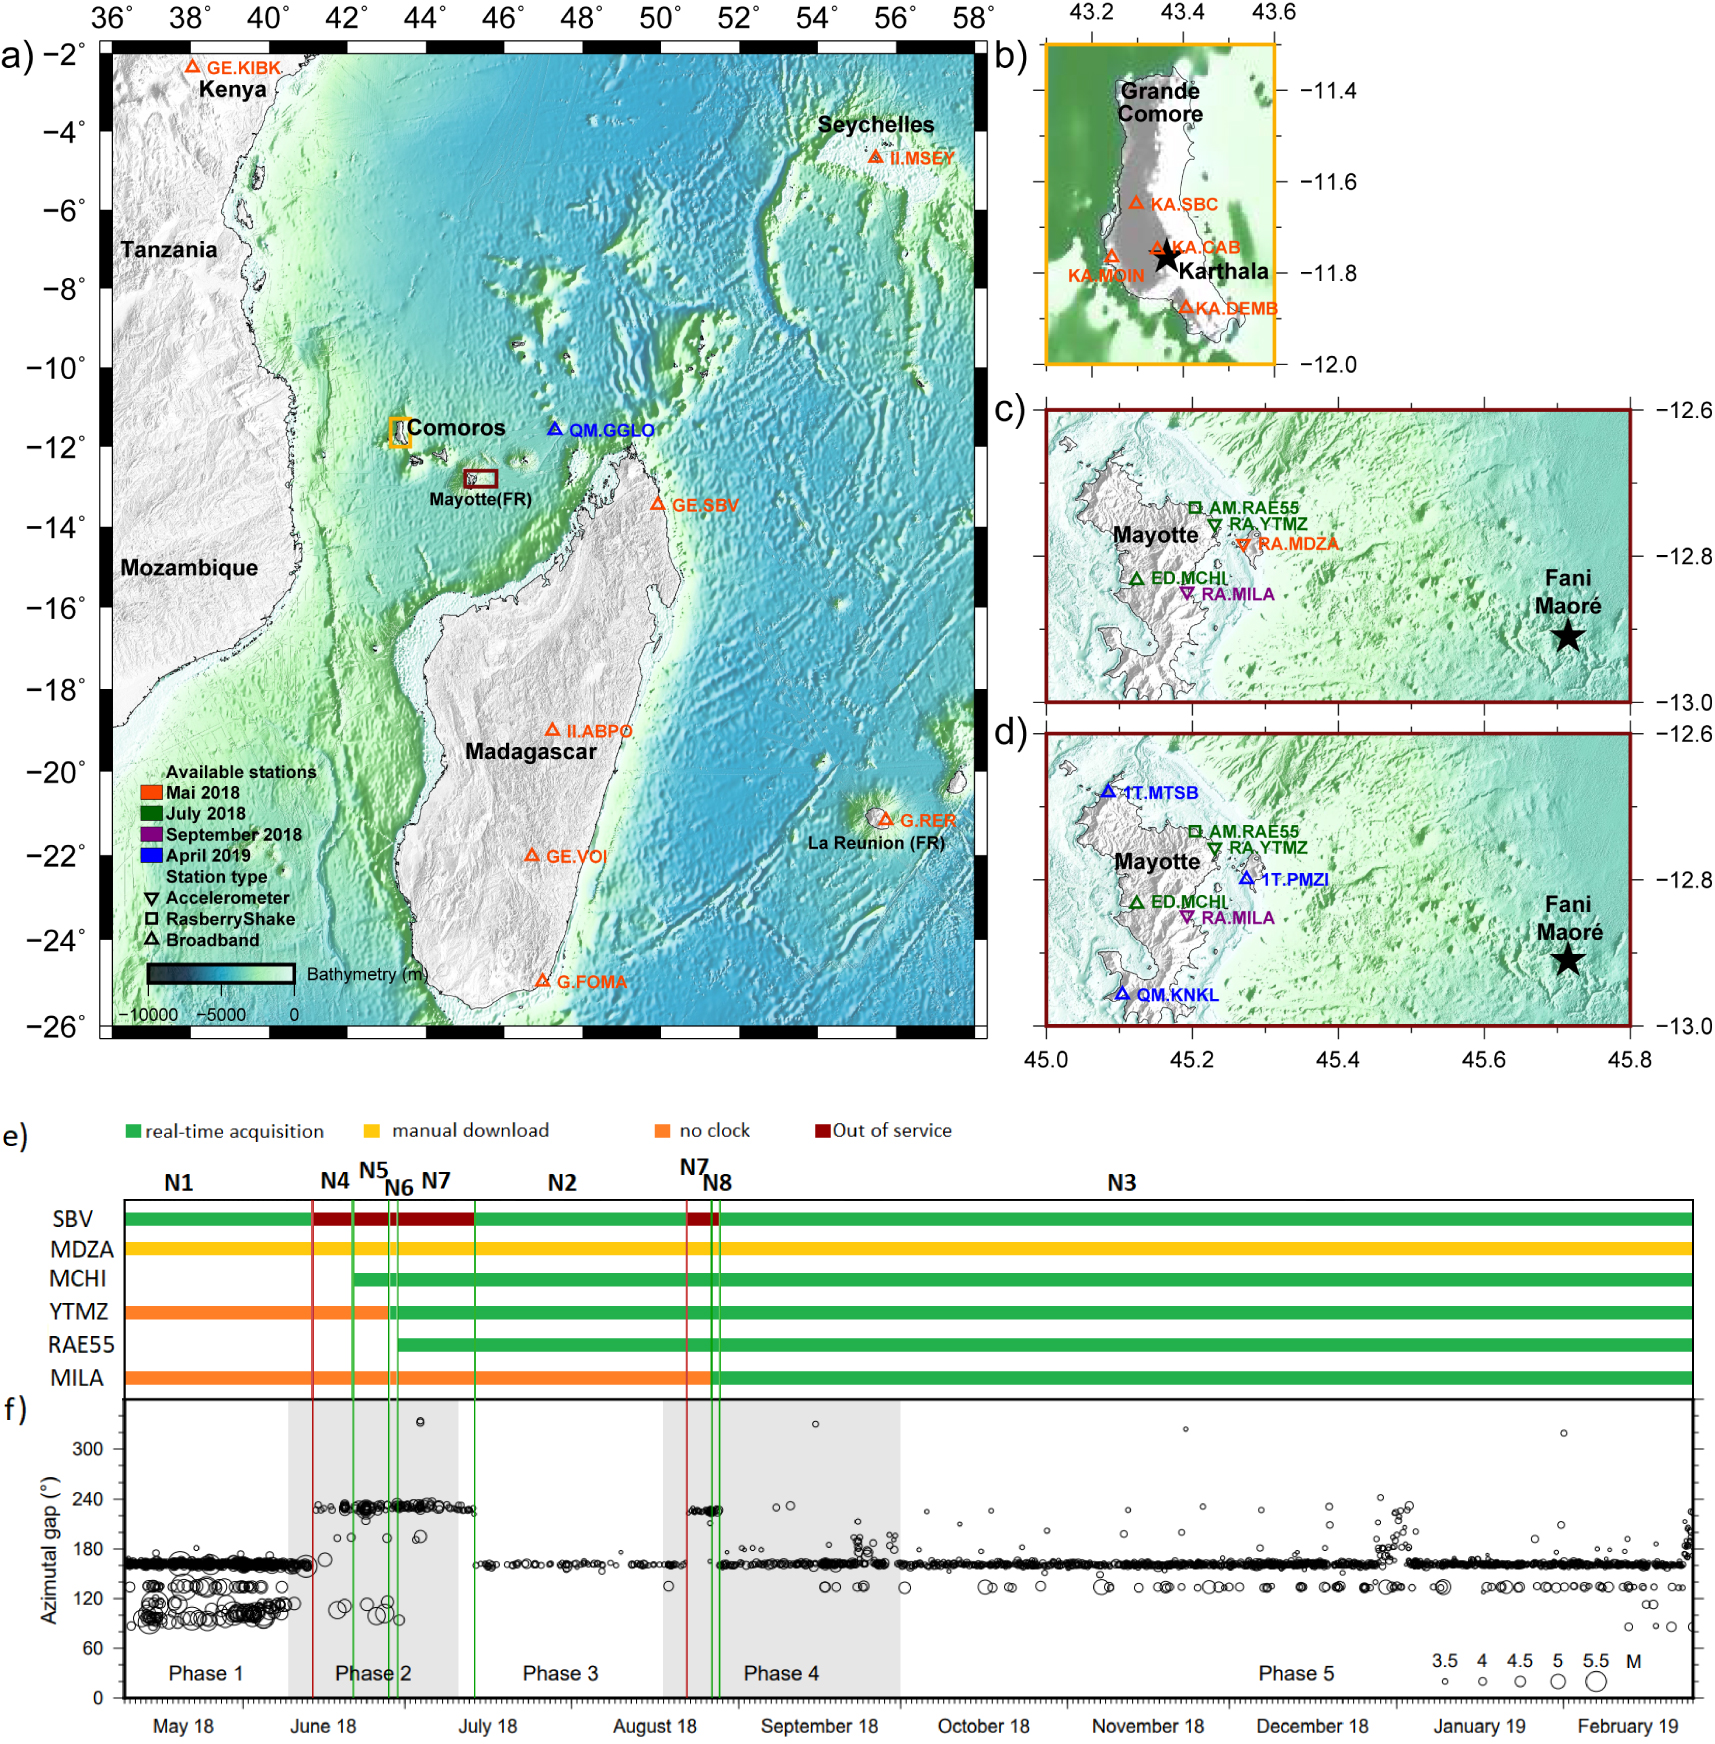
The largest amount of seismic movement was released within the first two months of the sequence, when the initial seismic monitoring network included only a few stations in Mayotte, Grande Comore, Madagascar and a few further off (Figure 2). Later, through collaborative work of the French scientific community, several additional seismic stations were progressively installed on Mayotte Island at the end of June 2018, at the end of August 2018, and then in March 2019 (Figure 2b,c,d).
In addition, since the end of February 2019, the deployment of a network of 4 to 16 ocean bottom seismometers (OBS) on the seafloor east of Mayotte have been providing better constraints of the seismicity and seismogenic structures [Rinnert et al. 2019; Feuillet et al. 2021; REVOSIMA 2022; Saurel et al. 2022]. For the first year of the sequence, from May 2018 to February 2019, the geodetic and seismic monitoring has been crucial to understand the processes involved at the onset of this magmatic/volcanic activity, and the building of such an exceptional volcanic edifice [Lemoine et al. 2020a]. Several scenarios are proposed to outline the timeline of magma ascent, based on geophysical and petrological data [Cesca et al. 2020; Lemoine et al. 2020a; Feuillet et al. 2021; Berthod et al. 2021a]. In May 2018, the first cluster of seismicity extended southeast, then a swift upward migration started in early June, going from a depth of 40 km up to the surface within a month. The seismicity highlights the propagation of magma through the lithosphere, from a deep and exceptionally large reservoir up to the seafloor, until the eruption that started between 28 June and 5 July 2018 [Cesca et al. 2020; Lemoine et al. 2020a]. In July 2018, a second cluster progressively appeared, closer to Mayotte, along with intense, very-long-period seismicity (VLP) at more shallow levels [Poli et al. 2019; Satrianoet al. 2019; Cesca et al. 2020; Lemoine et al. 2020a; Feuillet et al. 2021; Laurentet al. 2021]. Those two clusters are still active as of October 2022 [REVOSIMA 2022]. We refer to them as the proximal and distal clusters, relative to Mayotte, following Saurel et al. [2022] (Figures 1c and 3).
Hypocenter distribution of new catalog for the events above Mlv 3.5 of the 10 first months of Mayotte sequence (10 May 2018 to 24 February 2019). (a) N–S section view for the proximal cluster. (b) Map view for both clusters. (c) N–S section view for the distal cluster. (d) E–W section view for both clusters. (e) NW–SE section view for the distal cluster. Relative HypoDD locations and uncertainties are in black, absolute Hypo71 locations and uncertainties are in pale grey. Pale pink star indicates the position of the main shock on 15 May 2018, 15:48 UTC. Red triangle indicates the location of the Fani Maoré volcano. Bathymetry source is the same as Figure 1c.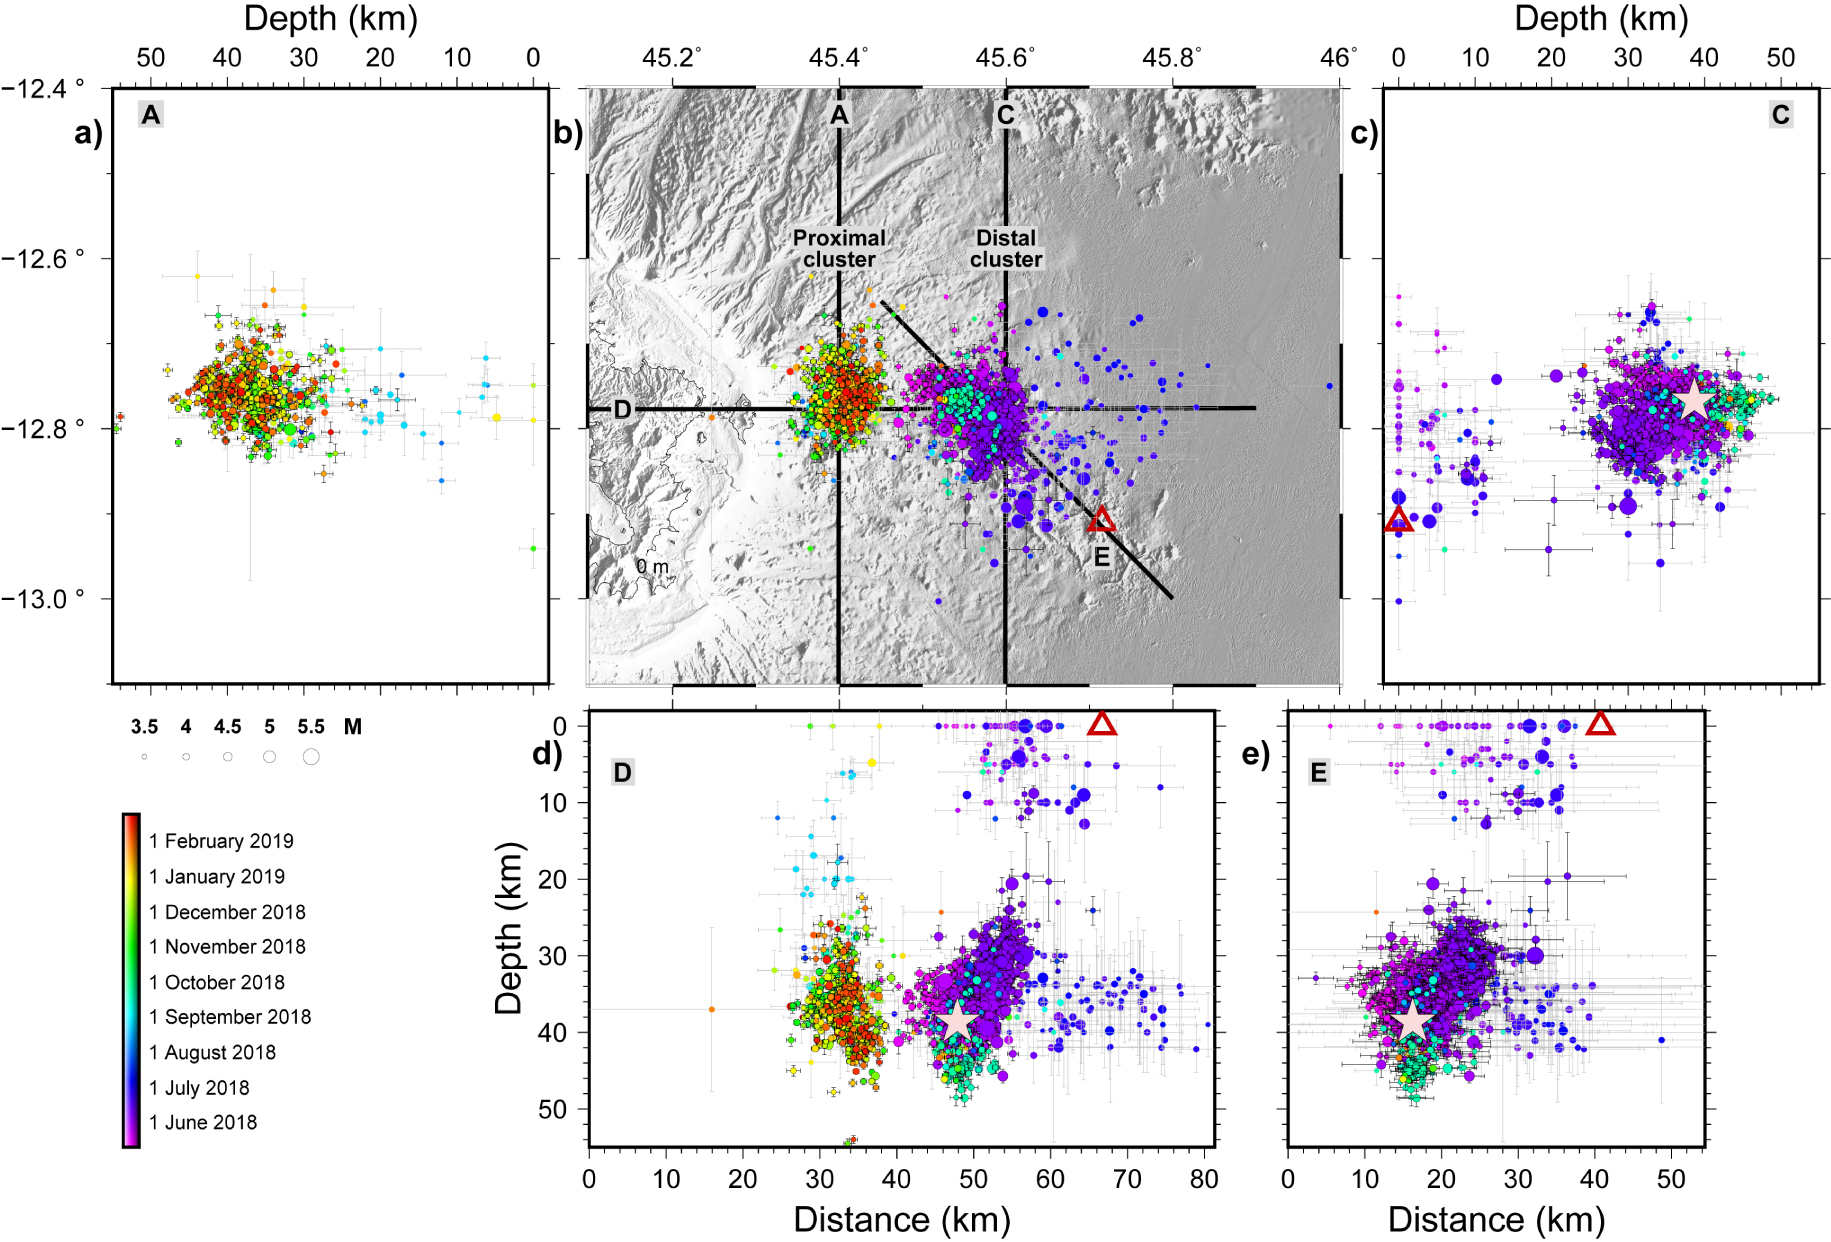
The analysis of the seismicity of the first year is challenging due to the poor initial quality of the monitoring network. Therefore, we integrate complementary phases that have been manually picked at a few seismic stations not included in the initial monitoring network, to better specify the locations of the earthquakes over the first ten months of seismicity near Mayotte and to help complete the catalog. We estimate the instrumental bias due to both the network scarcity and geometry, by comparing our locations to those obtained using the subsequent improved monitoring network, including OBS and more inland stations from March 2019. We then relocate 77% of this catalog using a double-difference algorithm to image the seismogenic structures more precisely. Based on this new catalog, we describe the various phases of the rapidly evolving seismicity. Finally, in the light of already published work, we propose a synthetic scenario of the first ten months of the seismo-volcanic sequence of Mayotte.
2. Geodynamic and seismo-tectonic context of Mayotte
2.1. Tectonic and magmatic activity in the Comoros archipelago
The four major volcanic islands of the Comoros archipelago are Grande Comore, Moheli, Anjouan, and Mayotte from west to east (Figure 1b). Several marine surveys reveal recent volcanic and tectonic features northward of the archipelago [e.g., N’Droundé and Mwezi fields, Thinon et al. 2022] as well as numerous individual structures [Figure 1b, Audru et al. 2006; Tzevahirtzian et al. 2021; Thinon et al. 2022]. Submarine volcanic ridges connect the four islands [Tzevahirtzian et al. 2021; Thinon et al. 2022]. Major submarine volcano-tectonic structures follow an east–west alignment between Mayotte and the northern part of Madagascar, namely the Jumelles, Geyser, Zélée, and Leven banks. Mayotte is mainly composed of one major island (Grande Terre) and a smaller island to the east (Petite Terre). From Petite Terre, a 50 km long, WNW–ESE volcanic chain is observed on the seafloor, divided into two segments: a western part on the island slope, and an eastern N130°E part mainly composed of what are probably monogenetic cones, up to 500 m high and 2 km wide [Figure 1c; Rinnert et al. 2019; Feuillet et al. 2021; Tzevahirtzian et al. 2021].
Before the ongoing eruption of Mayotte, the active volcanism in the Comoros archipelago was limited to the Karthala volcano, in Grande Comore. The Karthala is one of the world’s largest active alkaline basalt shield volcanoes, with almost 20 eruptive sequences within the last century [Bachèleryet al. 2016]. The last eruptive sequence, between 2005 and 2007, resulted in the installation of four broadband seismic stations in 2017 to better estimate the volcano hazard. In Mayotte, no active volcanism has been reported prior to the submarine eruption that started in 2018. The southern part of the island is composed of an old volcanic complex, emplaced from 10 Ma to 1.95 Ma. A second phase of volcanism built the northern part of the island, between 8 Ma and 3.8 Ma. Then recent volcanism formed the northeastern part, from 4.4 Ma to 0.15 Ma, with more recent activity that shaped the cones of Petite Terre [Nougier et al. 1986; Zinke et al. 2003a, b; Debeuf 2009; Nehlig et al. 2013; Michon 2016].
Although the timing of the formation of the Comoros archipelago is still under debate [e.g., Quidelleur et al. 2022], it is suggested that the volcanism of Mayotte is the oldest [ca 20 Ma in Michon 2016; ca. 26–27 Ma in Masquelet et al. 2022], whereas volcanism in Anjouan, Moheli, and Grande Comore started later at c.a. 10 Ma [Michon 2016]. Therefore, there is no simple decrease or increase of the age of volcanism along the Comoros archipelago, as expected in the case of hotspot-related intraplate volcanism. The link between tectonic deformation and volcanic development is under study [Michon 2016; Famin et al. 2020; Feuillet et al. 2021; Boymondet al. 2022; Thinon et al. 2022], this issue. Geological, geochronological, geomorphological and geophysical datasets tend to confirm the hypothesis of a strong magmatic supply reaching the surface through fractures induced by lithospheric deformation [Michon 2016; Tzevahirtzian et al. 2021; Famin et al. 2020; Feuillet et al. 2021; Thinon et al. 2022]. The geodynamical context of the east–west trending Comoros archipelago, linking the south-eastern tip of the East African rift to the Madagascar graben system [Figure 1a; e.g., Feuillet et al. 2021], suggests an immature boundary between the tectonic plates of Lwandle and Somalia [Stamps et al. 2018, 2021; Famin et al. 2020, Figure 1a]. Strain from plate tectonics may thus play a role in the origin of the volcanism [Michon 2016; Famin et al. 2020], in addition to the influence of inherited structures from old oceanic fabric, and of regional mantle dynamics [Thinon et al. 2022].
2.2. Past seismic activity along the Comoros archipelago
The Comoros archipelago is considered an area of moderate seismicity [Bertil and François 2016]. The poorly developed monitoring seismic network in the area prevents an exhaustive analysis of the small and moderate magnitude seismicity. According to a recent 120-year compilation of regional seismicity in the North Mozambique channel (1900–2021), most of the earthquakes are concentrated offshore, along the north–south Davie oceanic ridge, and along the east–west trending Comoros archipelago [Figure 1; Bertil et al. 2021]. This regional catalog includes 10 events of magnitude above 5.0, five of them being located around Mayotte [Bertil et al. 2021]. Furthermore, over the previous three centuries, 17th to 19th, only four earthquakes, causing moderate damages on the island, remain in the collective memory of Mayotte [Hachim 2004; Sira et al. 2018].
2.3. The recent Mayotte seismo-volcanic sequence
The Mayotte seismic activity started abruptly, unexpectedly, and with intense swarms. Several dozen low to moderate earthquakes occurred daily, and about 280 of them were likely felt during the first two months [according to Peak Ground Acceleration criteria PGA ⩾ 0.01 m⋅s−2 on the YTMZ station, Bertil and Hoste-Colomer 2020]. Quick volunteer response teams organized to estimate the number of events, located the strong magnitude earthquakes, and developed a monitoring network [Sira et al. 2018; Bertil et al. 2019; Lemoine et al. 2020a]. The existing geodetic stations network and InSAR data indicate subsidence and eastward displacement of the island of Mayotte from early July 2018 [Lemoine et al. 2020a].
Given the knowledge of present and past seismicity in the region [Bertil et al. 2021], the pattern of seismicity that occurred east of Mayotte is unprecedented, in light of recorded time sequence data, considering the number and magnitudes of reported seismic events. However, the monogenic volcanoes and more complex submarine systems similar to the NVE covering the seafloor may indicate the previous occurrence of similar episodes [Feuillet et al. 2021; Tzevahirtzian et al. 2021; Thinon et al. 2022].
This seismic activity starts suddenly on 10 May 2018. First seismological catalogs show thousands of events occurring within a year, up to Mw 5.9. The majority of the seismic energy is released during the first six weeks of activity [Cesca et al. 2020; Lemoine et al. 2020a]. This seismicity starts as a swarm 40 km east of Mayotte and around 30–40 km deep, hence below the Moho, estimated to be around 17 km [Jacqueset al. 2019; Dofal et al. 2021]. From there, the local and regional networks record a migration of earthquakes southeastwards and upwards, interpreted as magma migration from a deep large reservoir ( >10 km3) to the surface [Cesca et al. 2020; Lemoine et al. 2020a; Berthod et al. 2021a]. Seafloor eruption is thought to have started between late June and early July of 2018, hence seven weeks after the onset of the seismic activity, as attested by the beginning of a noticeable deflation signal observed on GNSS stations, along with relative seismic quiescence [Cesca et al. 2020; Lemoine et al. 2020a; Berthod et al. 2021a]. The deep seismicity has remained active since the beginning of the eruption. Oddly intense, monochromatic VLP events were recorded in June 2018 [Laurentet al. 2021], as well as the onset of a second seismic cluster, in July 2018, 10–20 km east of Mayotte [Lemoine et al. 2020a]. Since then, the two deep swarms have remained active; the second has surpassed the first in terms of seismicity rate [Lemoine et al. 2020a; Feuillet et al. 2021; Lavayssière et al. 2022; REVOSIMA 2022; Saurel et al. 2022]. The seismic sequence is still ongoing in November 2022, with low activity relative to the initial months [REVOSIMA 2022; Lavayssière et al. 2022; Saurel et al. 2022].
Marine surveys identified the NVE southeastward in the prolongation of the eastward trending Mayotte volcanic chain. This 820 m tall, 5.0 ± 0.3 km3 volcanic edifice, now officially called “Fani Maoré”, built in one year of eruption [Rinnert et al. 2019; Feuillet et al. 2021], is interpreted as evidence of the damping of a deep and exceptionally large reservoir. This is supported by the large GPS surface displacements, implying a barycenter of deformation located 40 km eastward of Mayotte and 30 km deep [Lemoine et al. 2020a; see also Peltier et al. 2022]. Tomography, petrological studies, and precise relocations of events since March 2019 highlight several volcanic and seismic structures, such as intermediate and deep reservoirs around the seismic swarms (Figure 11), as well as complex magmatic interactions between deep reservoirs and the surface [Berthod et al. 2021a, b; Foix et al. 2021; Lavayssière et al. 2022; Masquelet et al. 2022].
3. Data and methods
3.1. Seismic network evolution and data availability
In order to build the catalog for the first ten months of the Mayotte seismic sequence (Figure 3; Table S1), we first estimated the amount of detected seismic events by performing a STA/LTA method on the vertical component of station YTMZ (Figure 4a and Figure S1). Due to the high level of noise in the signals of this continuous strong-motion station, we applied a Butterworth filter between 1.5 and 15 Hz. Then we selected only events with a STA/LTA ratio above 6.0 and a peak-to-peak amplitude of more than 200 counts. Those parameters reduced the detections of non-seismic sources, such as those of the Mayotte background noise, but likely of small seismic events too. Then, we considered two distinct time periods characterized by different monitoring seismic networks.
Evolution of seismicity from 3 May 2018 to 24 February 2019. Proximal and distal events, located with HypoDD, are identified with red and blue circles, respectively. Earthquakes located with Hypo71 only are identified with black circles. (a) Number of detected events on YTMZ continuous signal, using STA-LTA. (b) Number of events per day for all events within distal (blue) and proximal (red) clusters, and cumulative number of events (green line). (c) Magnitude (Mlv) of events, cumulative seismic moment (green line) and magnitude of completeness (in red). (d) S and P arrival time differences (S–P) at YTMZ station. (e), (f), and (g) are longitude, latitude and depth of events, respectively. The pale pink star indicates the main shock of the sequence, on 15 May 2018, 15:48 UTC. Main phases are indicated by white and grey stripes. Vertical lines correspond to seismic GE.SBV loss (red) and resume (green) of data acquisition. Red triangle in (e) and (f) indicates the position of the Fani Maoré volcano.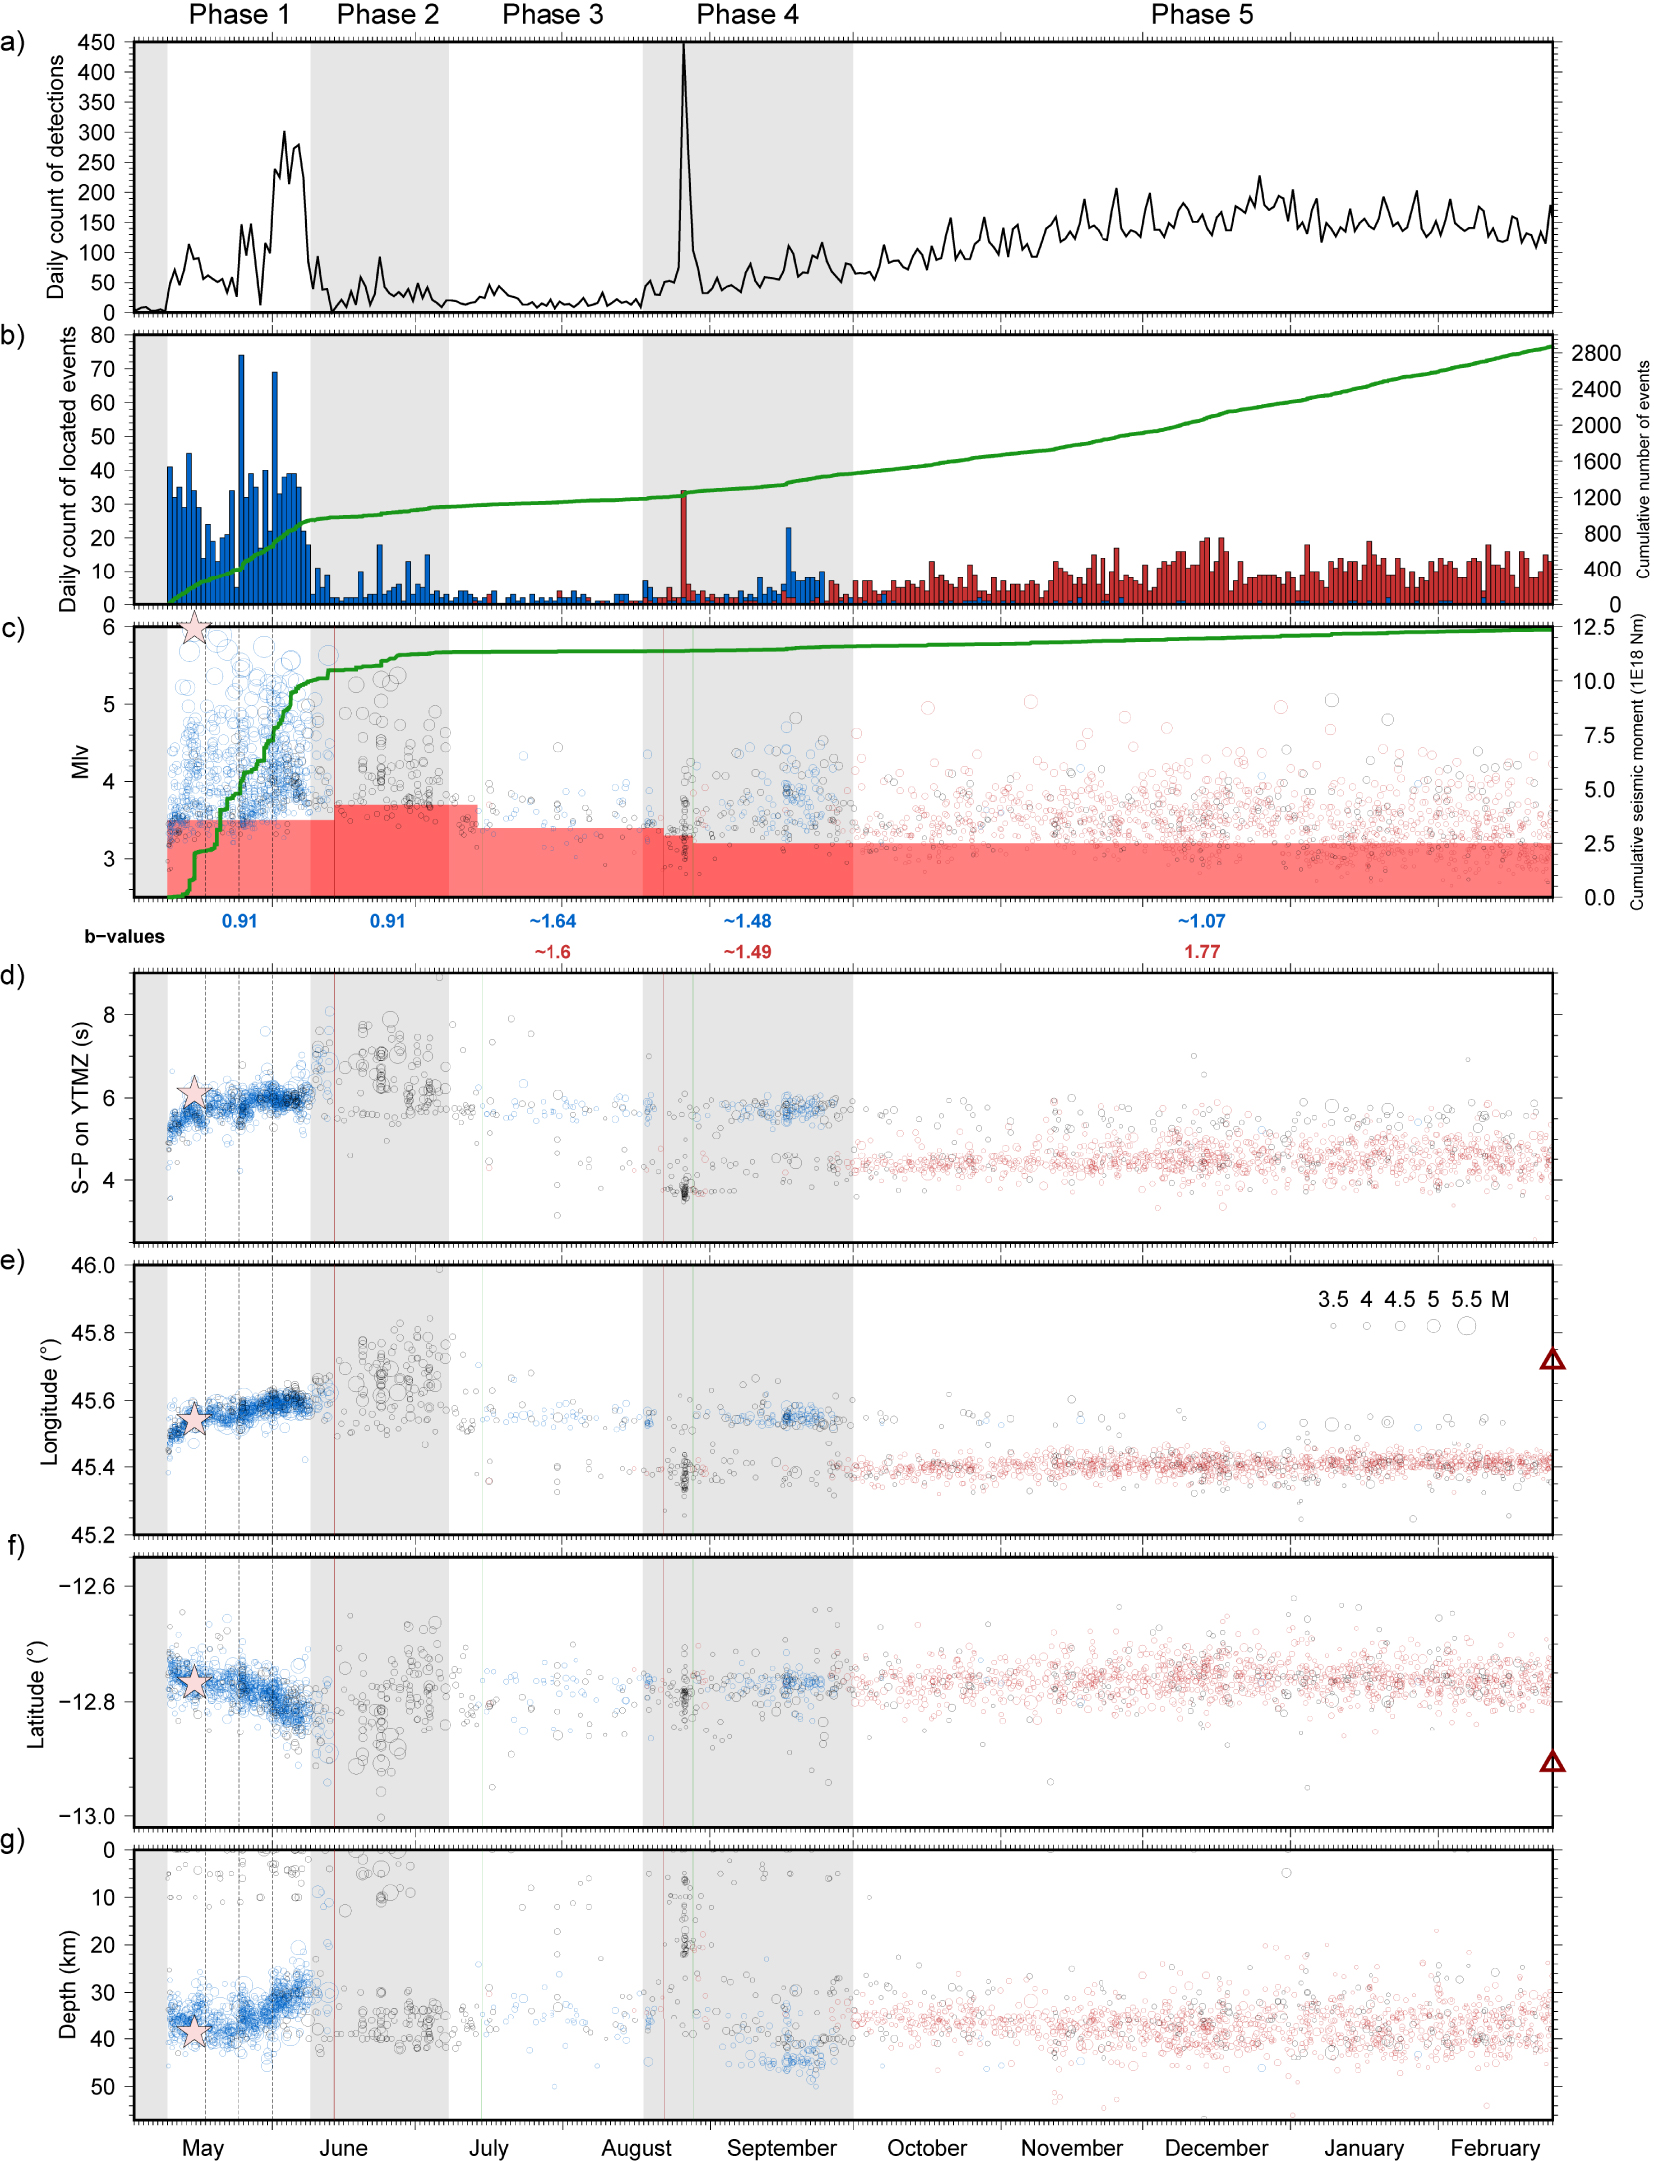
For the first four months of the sequence from 10 May to 31 August 2018, we completed the initial catalog of Lemoine et al. [2020a]. In addition to the regional stations (Figure 2a) in Madagascar (GE.SBV, II.ABPO, GE.VOI), Kenya (GE.KIBK), and sparse data from Grande Comore (KA.SBC, KA.CAB, KA.MOIN, Figure 2b), we used additional data from stations located in Seychelles (II.MSEY), La Réunion (G.RER), Madagascar (G.FOMA), and Grande Comore (KA.DEMB). Furthermore, we completed the dataset with GE.SBV signals from May and June 2018, and added missing data from the Grande Comore network (the whole month of May, and short time intervals between June and August 2018). During periods not covered by the GE.SBV station located to the east, we only analyzed events with a well-identified P phase at II.ABPO, to reduce the azimuthal gap. For the local network, since Lemoine et al. [2020a] had integrated MDZA signals only for magnitude M > 4.0 events, we enriched the dataset with MDZA signals for smaller events (Figure 2). The local Mayotte network has developed from one to five available stations between May 2018 and February 2019 (see Supplementary Material, Table 1, Figure 2). The picking of the P and S phases was done manually on the continuous signals, using the Seiscomp software [Helmholtz-Centre Potsdam - GFZ German Research Centre for Geosciences and GEMPA GmbH 2008]. We also checked the previously picked phases from the Lemoine et al. [2020a] catalog and searched for new small events, not previously detected.
List of local and regional stations
| Stationa | Longitude | Latitude | Start | End | Typeb | Min. distance to Mayotte seismic area (km) |
|---|---|---|---|---|---|---|
| RA.MDZA | 45.26°E | 12.78°S | June 2016 | February 2019 | Acc | 3 |
| AM.RCBF0 | 45.27°E | 12.80°S | 15 June 2018 | July 2018 | RaspB | 3 |
| 1T.PMZI | 45.27°E | 12.80°S | March 2019 | — | BB (HH) | 3 |
| RA.YTMZ | 45.23°E | 12.76°S | July 2015 | — | Acc | 8 |
| AM.RAE55 | 45.20°E | 12.73°S | 15 June 2018 | — | RaspB | 12 |
| RA.MILA | 45.19°E | 12.85°S | June 2016 | — | Acc | 14 |
| ED.MCHI | 45.12°E | 12.83°S | 18 June 2018 | — | BB (BH) | 20 |
| 1T.MTSB | 45.08°E | 12.68°S | March 2019 | — | BB (HH) | 28 |
| QM.KNKL | 45.10°E | 12.96°S | March 2019 | — | BB (HH) | 29 |
| KA.MOIN | 43.24°E | 11.77°S | 2017 | — | BB (HH) | 250 |
| KA.SBC | 43.30°E | 11.65°S | 2017 | — | BB (HH) | 250 |
| KA.CAB | 43.34°E | 11.75°S | 2017 | — | BB (HH) | 250 |
| KA.DEMB | 43.41°E | 11.88°S | 2017 | — | BB (HH) | 250 |
| QM.GGLO | 47.29°E | 11.58°S | March 2019 | — | BB (HH) | 250 |
| GE.SBV | 49.92°E | 13.46°S | 2009 | — | BB (HH) | 450 |
| II.ABPO | 47.23°E | 19.02°S | 4 March 2007 | — | BB (HH) | 700 |
| GE.VOI | 46.71°E | 22.03°S | 2009 | — | BB (HH) | 1000 |
| G.FOMA | 46.98°E | 24.98°S | 1 September 2008 | — | BB (HH) | >1000 |
| GE.KIBK | 38.04°E | 2.36°S | 2011 | — | BB (HH) | >1000 |
| II.MSEY | 55.48°E | 4.67°S | 1995 | — | BB (HH) | >1000 |
| G.RER | 55.74°E | 21.17°S | 10 Feb 1986 | — | BB (HH) | >1000 |
aStations come from the following networks: AM: Raspberry Shakes: doi:10.7914/SN/AM; ED: http://www.edusismo.org/; G: Geoscope: doi:10.18715/GEOSCOPE.G; GE: GEOFON: doi:10.14470/TR560404; II: Global Seismic Network IRIS-IDA: doi:10.7914/SN/II; KA: Observatoire Volcanologique du Karthala: http://volcano.ipgp.jussieu.fr/karthala/stationkar.html; RA: RESIF-RAP french accelerometric network: doi:10.15778/RESIF.RA, 1T: Temporal seismological network of Mayotte: doi:10.15778/resif.1t2018, QM: Comoros archipelago seismic and volcanic network: doi:10.18715/MAYOTTE.QM.
bStation types: Acc = accelerometer, BB (HH) broadband 0–100 Hz, BB (BH) broadband (0–50 Hz), RaspB: Raspberry Shakes.
From 1 September 2018 to 24 February 2019, events were directly extracted from the database used in Lemoine et al. [2020a] and Bertil et al. [2021], using the stations previously cited. We reviewed and improved the location of more than a hundred earthquakes.
3.2. Absolute locations
Event absolute locations were processed using the HYPO71 algorithm [Lee and Lahr 1972; Lee 1975]. The computer version of HYPO71 [Lee and Valdes 1985] uses P and S time arrivals to estimate hypocenter locations and magnitude (MLv) for local earthquakes. We used a slightly modified version of the 1D five-layer regional velocity model from Lemoine et al. [2020a], with a regional Vp∕Vs value of 1.74 (Table 2). More recent local velocity models were proposed based on the seismic data acquired since the installation of OBS around the Mayotte active zone, using lower and local Vp∕Vs values [1.66 in Dofal et al. 2021; around 1.6 in Foix et al. 2021; Saurel et al. 2022; Lavayssière et al. 2022]. However, for earthquake locations, the regional model was more suitable with our network configuration, which included stations beyond 200 km of Mayotte, and no OBS above the active zone. Locations were retained if there were at least eight picked phases on a minimum of four seismic stations, including one in Grande Comore and one in Madagascar.
1D velocity model used for the location process
| Depth (km) | Vp (km/s) | |
|---|---|---|
| Layer 1 | 0–3 | 3.5 |
| Layer 2 | 3–8 | 5.1 |
| Layer 3 | 8–15 | 6.7 |
| Layer 4 | 15–60 | 8.1 |
| Layer 5 | >60 | 8.15 |
Vp∕Vs ratio is fixed at 1.74.
We compared our MLv estimates with moment magnitudes (Mw) ranging from 4.8 to 5.9 for the 26 Mayotte events located by GCMT (Global Centroid Moment Tensor Project, https://www.globalcmt.org). The magnitude difference (MLv–Mw) varied between −0.1 and +0.7, with a mean difference of 0.1. In order to estimate a seismic moment [M0, Aki and Richards 2002], even for smaller magnitudes (Mw < 4.8), we considered at first order that MLv is equivalent to the moment magnitude Mw.
The magnitude of completeness (Mc) evolved with time, as it depended on the quality of the network. Estimated to 3.5 at the onset of the sequence, it slightly increased to 3.7 when the GE.SBV station was down between mid-June and mid-July 2018. Since the improvement of the Mayotte network in September 2018, Mc was estimated to 3.2 (Figure 4c).
We determined b-values by calculating a power-law least-square fit to the magnitude-frequency distribution limited to the magnitudes above the estimated Mc [Richter 1935; Ichimoto and Iida 1939; Gutenberg and Richter 1942; Table 3, Figure 4c].
b-value as a function of phases and location
| All data | Proximal cluster | Distal cluster | |
|---|---|---|---|
| All phases | 1.06 | 1.60 | 0.96 |
| Phase 1 10 May–08 June 2018 | 0.91 | – | 0.91 |
| Phase 2 9 June–7 July 2018 | 0.91 | – | 0.91 |
| Phase 3 8 July–17 August 2018 | 1.69a | >1.6a | 1.64a |
| Phase 4 18 August–30 September 2018 | 1.33 | 1.49a APP = 1.34–1.41 not APP = 1.69 | 1.48a |
| Phase 5 1 October 2018–24 February 2019 | 1.67 | 1.77 | 1.07a |
aCalculated with less than 100 events above the magnitude of completeness.
3.3. Uncertainties and estimation of the location reliability
The HYPO71 algorithm provided uncertainties for the hypocentral locations [Lee and Valdes 1985]. The mean uncertainties of the horizontal and vertical locations for the whole catalog were estimated to be 2.3 and 3.2 km, respectively. The mean RMS value was 0.41 s. Because most of the stations of the initial network in Grande Comore and Mayotte were located west of the seismic area, epicentral location accuracies were highly dependent on the signals from the stations GE.SBV to the east, and/or II.ABPO to the southeast (Figure 2a). The average azimuthal gap was 161° with at least one of these stations. The lack of picks in the signals recorded at GE.SBV (Figure 2a) increased the azimuthal gap to 223° (Figure 2f), and uncertainties on earthquake locations along the horizontal and vertical axis up to 4.0 km and 3.8 km, respectively. This was the case mainly for the two periods between 14 June and 14 July 2018 and between 22 and 28 August 2018. Furthermore, the improvement of the Mayotte network with three additional stations at the end of June 2018 (Figure 2d–e) reduced uncertainties by almost 50% on the horizontal axis and by 25% along the vertical axis.
Some calculated uncertainties could be artificially low due to the small number of phases for numerous small earthquakes. Hence, we tested the reliability of our locations and evaluated possible bias within the absolute epicentral positions. To do so, we compared our location procedure performance on a selection of 118 events located using the local OBS and inland stations and a local velocity model [Saurel et al. 2022]. These earthquakes, occurring between May and December 2019, were relocated using different network geometries, corresponding to the network evolution during the period of our catalog (Figure 2 and Figure S2). We used the regional velocity model of this work and the database of P and S pickings [Lemoine et al. 2020a; Bertil et al. 2021]. The results were compared to the well-constrained hypocentral locations of the corresponding events from Saurel et al. [2022] (Figure S2). Despite the challenging geometry of the onshore network, uncertainties are similar for both catalogs, remaining below 5 km along horizontal and vertical axes for most of the events. However, there is a mean horizontal shift of around 4.1 km and 5.5 km westward of our locations for the proximal and distal clusters, respectively, compared to a network including OBS stations above the seismic area, as well as an upward shift of around 4 km of our locations for the proximal cluster [similar results in Aiken et al. 2021].
3.4. Double-difference relocations
To further improve the locations of the events, we used the HypoDD computer program [Waldhauser 2001], which is a double difference earthquake location algorithm [Waldhauser and Ellsworth 2000]: through a least-square procedure, events are relatively relocated by evaluating similarities between pairs of hypocenters. Relocation with HypoDD was applied to the 2395 earthquakes with data at GE.SBV because solutions are unstable without data from this station. HypoDD relocations did not change the absolute positions of the swarms, but improved the locations of the events inside the swarms, significantly decreasing the horizontal (in particular the latitude) and vertical dispersion of the locations. Then, we controlled the HypoDD relocations using the S–P values at YTMZ (Figure 4d). Some events appeared to be located in the distal cluster when they had a low S–P value, or in the proximal cluster when they had a high S–P value. Thus, for those 184 events, we kept the Hypo71 location.
4. The 10 first months of the Mayotte seismo-volcanic sequence
The resulting catalog extends from 10 May 2018 to 24 February 2019 (Figure 3; Table S1). It contains 2874 localized earthquakes with a mean of 12 P and S phases per event, counting 43000 manually picked P and S phases: 2211 of these events (77% of the catalog) have a HypoDD relocation.
4.1. Before 10 May 2018
No significant seismic activity was reported in the area under study before the onset of the Mayotte seismic sequence, despite the installation of the first stations in Mayotte in 2016 [Bertil et al. 2021]. For confirmation we carefully inspected the seismic records of the stations in Mayotte and the whole region (Figure S2), from 1 January to 10 May 2018: no earthquake with S–P values typical of the Mayotte swarms [between 3.5 and 6.5 s] was identified.
4.2. Two clusters of focused seismic activity, east of Mayotte Island
All the epicenters of our catalog are located between the coasts of Mayotte to 60 km eastward (Figure 3). The epicentral distribution of the seismicity reveals two distinct seismic clusters, spatially separated by an aseismic zone centered around longitude 45.48°E [Cesca et al. 2020; Lemoine et al. 2020a; Feuillet et al. 2021]. The hypocenter depths range between 0 and 50 km, with 90% of them between 25 and 45 km. Overall, the magnitude (Mlv) of the events in our catalog ranges from 2.4 up to 6.0 (Table S1; Figure 4c).
The distal cluster (Figure 3b–e) is located 20 km further east of Petite Terre (Mayotte, Figure 1b), below the eastern N130°E Mayotte volcanic chain [Feuillet et al. 2021; Lavayssière et al. 2022], and nearly extends below Fani Maoré. It is composed of a short 10 km-long E–W segment and a longer 30 km-long NW–SE segment. Most of the earthquakes occur between 25 and 45 km depth, however an upward migration on the eastern segment and a more superficial seismicity (above 15 km depth) is visible during the first two months of the sequence (May–June 2018), as well as a deeper swarm in September 2018 centered around 45 km depth.
The proximal cluster (Figure 3a,b,d) is located between 6 and 20 km east of Petite-Terre (Mayotte). It is more circular in shape, centered on 45.4°E, 12.75°S, below the western and shallower part of the Mayotte volcanic chain [Tzevahirtzian et al. 2021; Feuillet et al. 2021]. Most of the seismicity is located between 25 and 45 km depth, however seismic activity is identified between 4 and 24 km at the end of August 2018 (Figure 4c–g).
In addition to their location, these two clusters differ from each other in seismicity (Figure 4). The distal cluster includes the strongest earthquakes, concentrating 45 of the 47 Mlv⩾5.0 events and more than 80% of the earthquakes above magnitude 4.0. The proximal cluster includes far more small earthquakes. Calculated from the magnitude-frequency distribution [Richter 1935; Ichimoto and Iida 1939; Gutenberg and Richter 1942], b-values are also different: whereas the b-value of the proximal cluster is 1.60, typical of volcanic environments, the estimated b-value of the distal cluster is 0.96, corresponding to a more tectonic context [Figure 4c; Table 3; Chiba and Shimizu 2018].
4.3. Phase descriptions
Our catalog of the first ten months of the Mayotte seismic sequence with improved locations confirms the previously described clusters and allows a spatio-temporal study of its onset. We identify five distinct phases (Figure 4), based on several criteria, such as the daily number of detected and located earthquakes (Figure 4a,b), the time evolution of the magnitudes (Figure 4c), the S–P value at YTMZ (Figure 4d), the position of the events (longitude, latitude, depth; Figure 4e–g), and the b-value (Figure 4c; Table 3).
4.3.1. Phase 1: 10 May to 8 June 2018
Phase 1 is characterized by the highest seismicity rate of the whole Mayotte seismic sequence, and the occurrence of numerous large earthquakes (Figures 4 and 5). We detect more than 3500 events and locate 950 events that occurred over 30 days within the distal cluster. This corresponds to an average of 32 earthquakes and 110 detections per day, with a few days peaking at 80 events and 300 detections. 80% of the events with Mlv⩾4.5 belong to Phase 1 (Figures 4a–c and 6a–c). In addition, most of the large earthquakes of the catalog occur during this phase, including 38 events (out of 47) with Mlv⩾5.0, and 7 events (out of 8) with Mlv ⩾ 5.5. The maximum Mlv magnitude reaches 6.0. The b-value is 0.91 (Figure 4c; Table 3).
Phase 1 (10 May–8 June 2018) hypocentral locations on map and sections (legend details provided in Figure 3).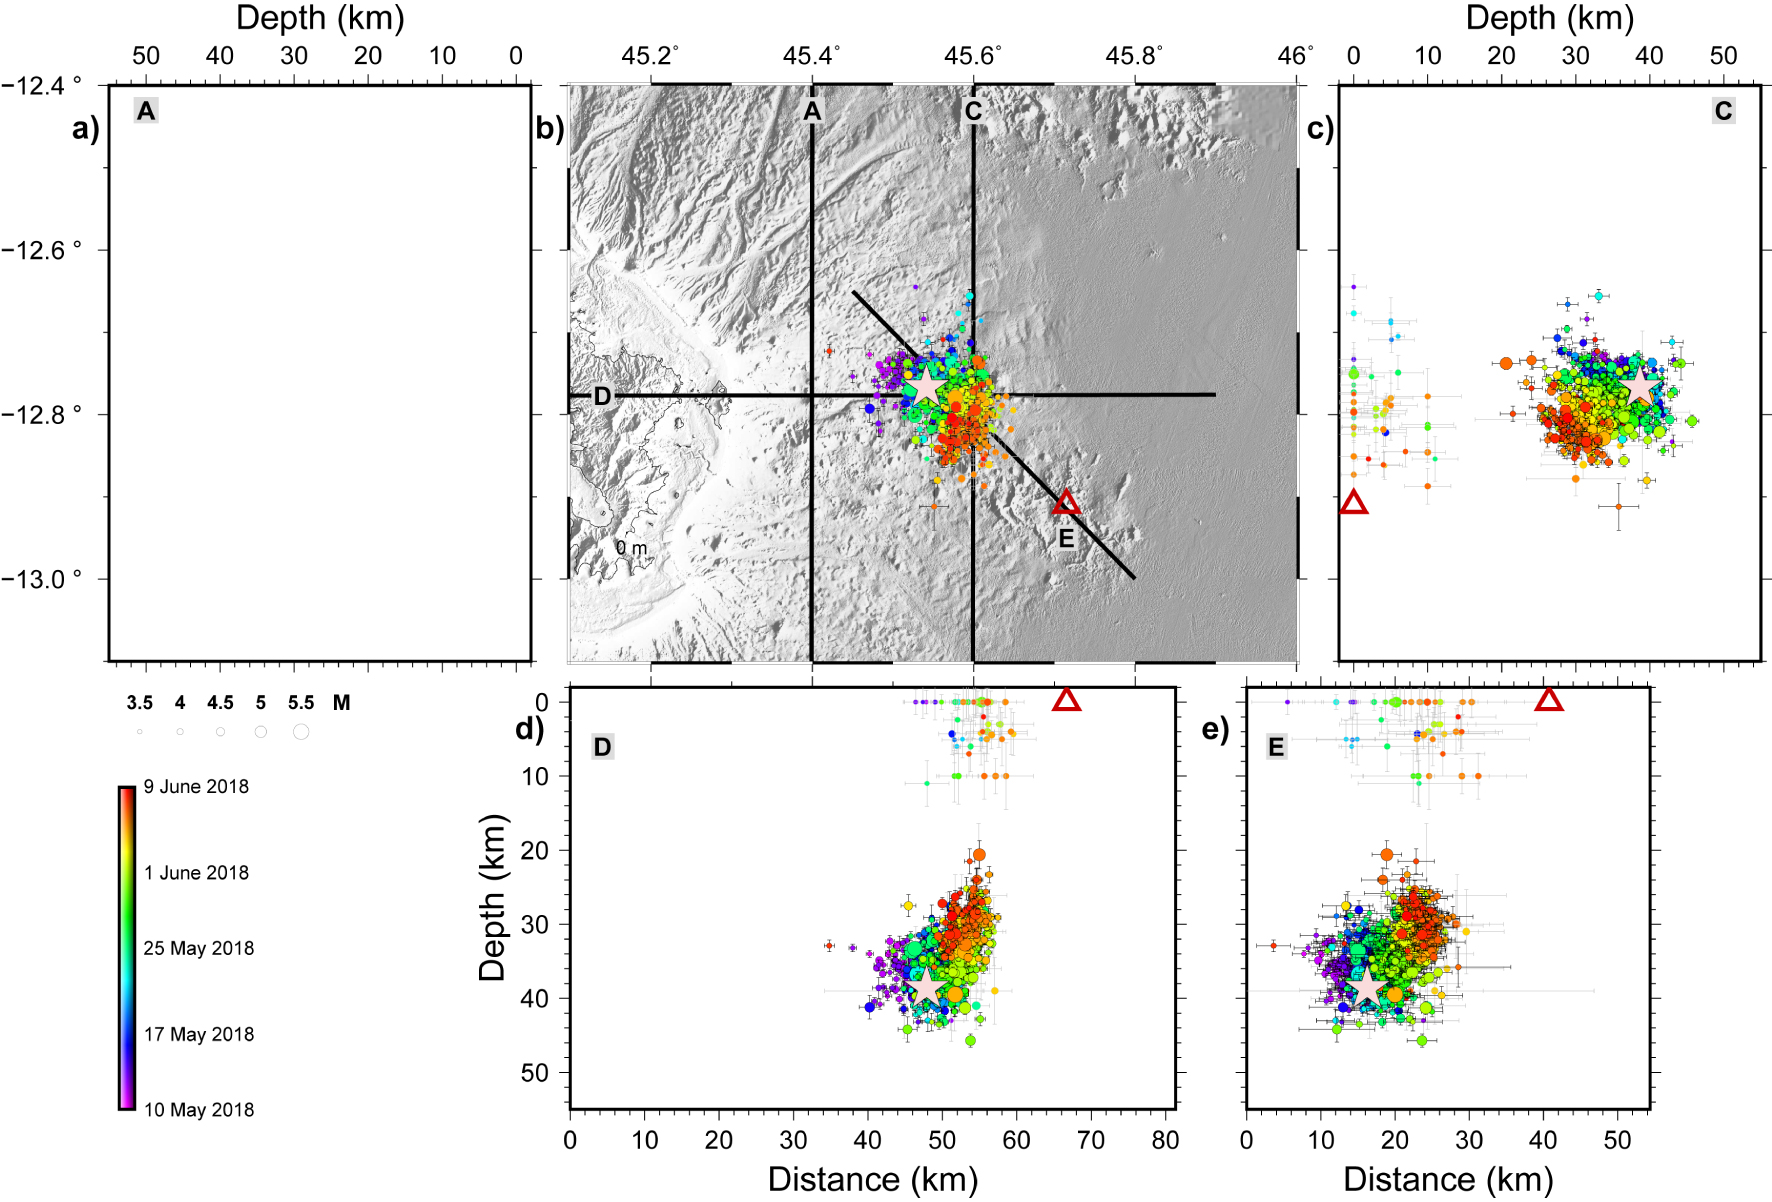
Throughout Phase 1, we observe a mean S–P values increase from 5.0 s to 6.0 s (Figures 4d and 6d), coeval with the variations of longitude, latitude and depth (Figures 4e–g, 5, and 6e–g). The epicenters are concentrated within a 190 km2 seismic zone, migrating to the east the first week, then southeast the third week, and finally south and upward the last week of Phase 1, i.e., away from Mayotte and closer to the Fani Maoré volcano (Figures 5 and 6).
Evolution of seismicity of 2 first phases, from 10 May to 7 July 2018 (legend details provided in Figure 4). Green stripes indicate pulses of 8 earthquakes or more (see Section 4.3.1): darkness of green increases with number of earthquakes.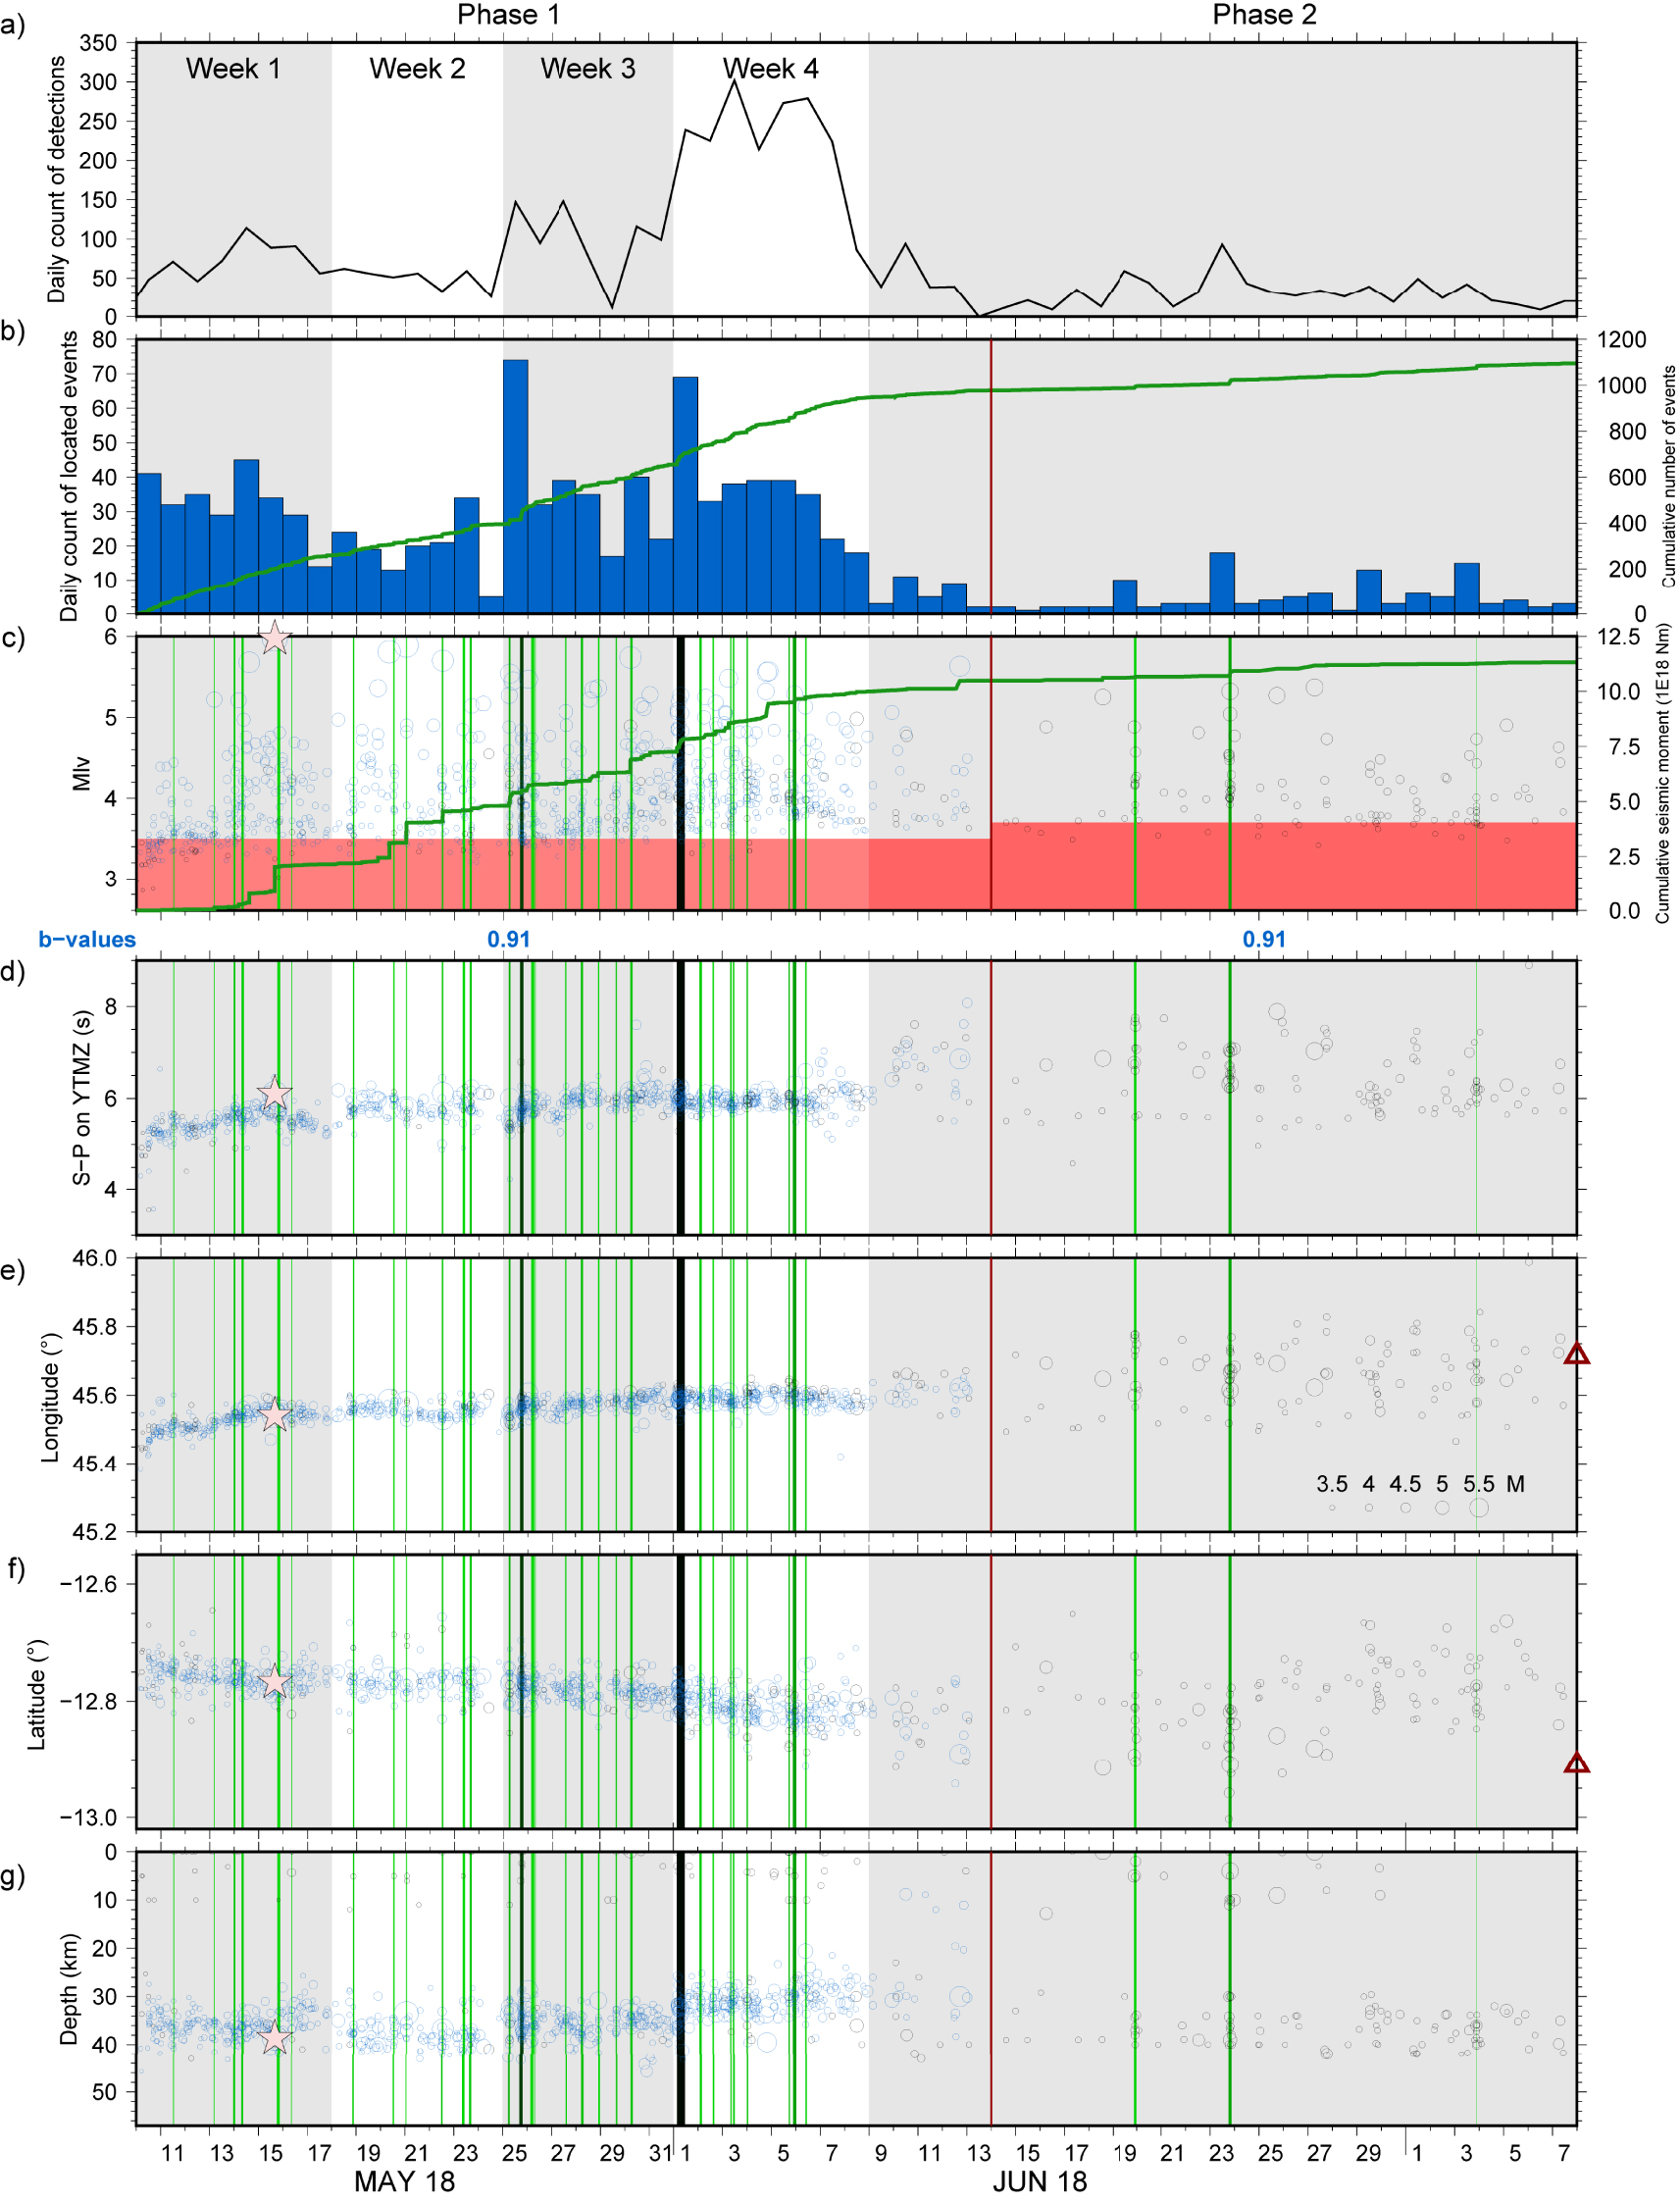
The hypocenters occur at a wide range of depths (Figures 4g, 5c–e, and 6g), with the majority of them located at a depth ranging between 30 km and 40 km. Throughout Phase 1, all the events are deeper than 20 km, except for about 70 events that have no stable relocation with HypoDD. They are most likely deeper since the hypocenters of events equivalent in magnitude and S–P values on YTMZ, and relocated with HypoDD, are between 30 and 40 km. Hence, we believe that this superficial seismicity is an artifact due to the sparse monitoring network.
During Phase 1, the seismicity is characterized by multiple earthquakes that occur in distinct series, each of a few hours duration. We identify 35 pulses as short sequences of eight or more earthquakes, separated by less than an hour from previous and subsequent earthquakes (Figure 6). Most of these pulses (30) are within Phase 1, on average one per day.
The evolution of the seismicity during Phase 1 follows four steps:
- During the first week (10–17 May 2018), the 255 located earthquakes migrate eastward. The Mayotte seismicity starts in a small area, 30 km east of Mayotte, 5 km west of longitude 45.5°E and at depths between 30 and 40 km, between the future positions of the proximal and distal clusters (Figures 4e and 6e). This area has never been active since. These earthquakes consist of Mlv < 4.4 events that rapidly migrate around 5 km eastward on 10 May. Following a Mlv 5.2 event on 13 May, they migrate 5 km further eastward, so that most of the seismicity on 14 May is located on average near longitude 45.55°E (Figures 4e, 5, and 6e). The S–P values increase continuously from 5.0 s to 6.0 s, together with the longitude until 17 May. On 15 May at 15:48 UTC, the Mw5.9 (MLv 6.0) earthquake occurs near the deepest part of the distal cluster, at around 40 km depth, followed by an overall upward migration of 7 ± 1 km until 17 May.
- The second week has a lower activity (18–24 May 2018), with only 140 located events. The seismicity remains focused where it was at the beginning of 15 May, without significant longitudinal or depth changes.
- The third week, an important pulse on 25 May marks the beginning of a 7 ± 1 km migration to the east and south, while the depths range between 30 and 40 km, until 1 June. We locate 260 events within this week.
- The most important pulse, on 1 June, includes 49 earthquakes. Over the next few days (fourth week), until the end of Phase 1, the seismicity goes 10 km south, and upward between depths of 25 and 35 km. With 295 located events and one third of the earthquakes with Mlv⩾5.0 of the Mayotte sequence, this week is the most intense of the whole Mayotte sequence (as of November 2022).
4.3.2. Phase 2: 9 June to 7 July 2018
The beginning of Phase 2 on 9 June is marked by an abrupt drop of the seismicity rate from an average of 32 events per day for Phase 1 to an average of 4 events per day, lasting until 7 July 2018 (Figures 4b and 6b). All the events located during this phase are within the distal cluster (Figure 7). Phase 2 contains two thirds of the Mlv⩾4.5 events of the catalog that do not occur during Phase 1 (Figure 4c). Seven Mlv⩾5.0 events and one up to Mlv = 5.6 occur, despite an overall decrease in magnitudes (Figures 4c and 6c). The b-value of Phase 2 is equal to 0.91, similar to the b-value of Phase 1 (Figure 4c; Table 3).
Phase 2 (9 June–7 July 2018) hypocentral locations on map and sections (legend details provided in Figure 3).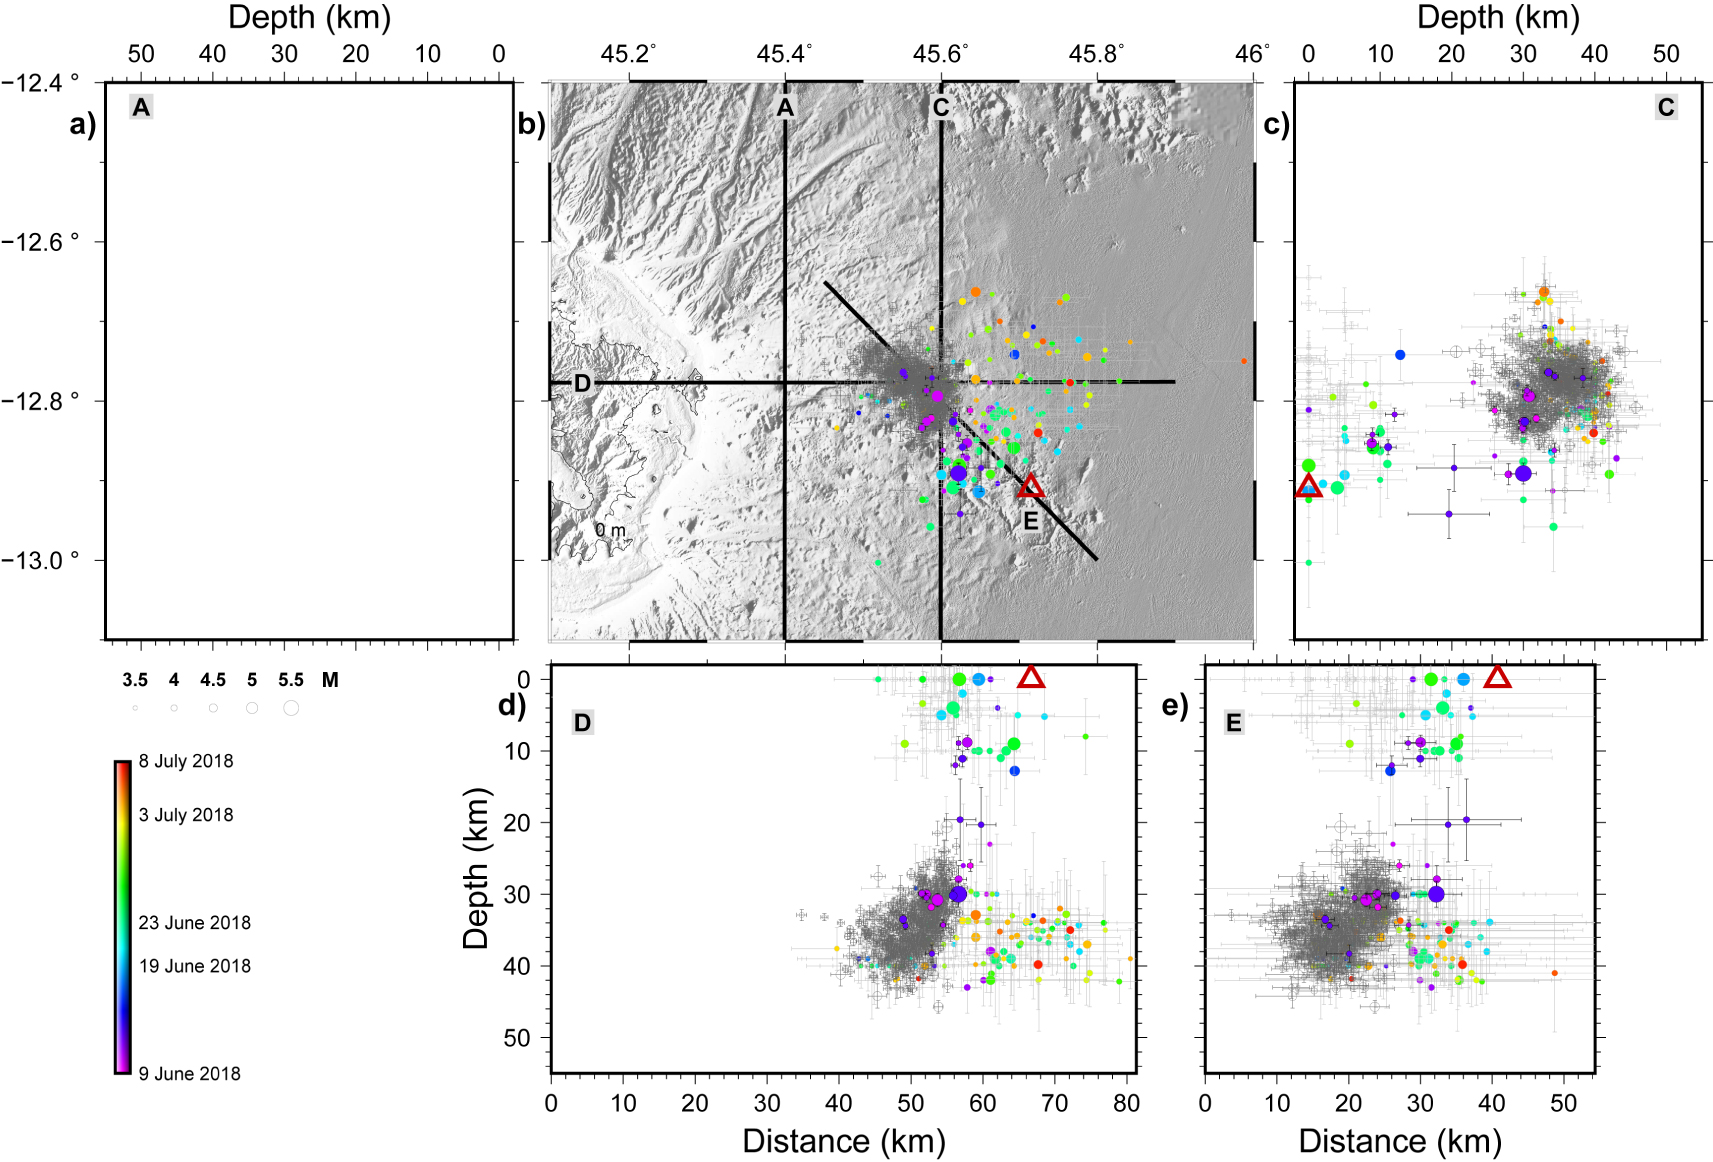
Regarding the largest events (Mlv > 4.7), 83% of them are located in the southeastern part of the distal cluster, i.e., closer to the Fani Maoré volcano, with one half deeper than 30 km and a second half between 0 and 15 km, i.e., shallow depths never found afterwards in the distal cluster. Note that those strong events are more precisely located thanks to the picks on the most distant stations (farther than 800 km, Table 1, Figure 2a). Moreover, even if most of the shallow earthquakes are located with Hypo71 and with more uncertainty due to a less than ideal network configuration, one event is relocated at 8.8 km with HypoDD. Hence, the shallow seismicity is confirmed by HypoDD relocations, as well as by the GCMT international catalog [Dziewonski et al. 1981; Ekström et al. 2012] for the largest events, and full waveform moment tensor inversion and depth phase analysis [Cesca et al. 2020].
Phase 2 is characterized by the largest scattering of seismicity, depicted by the longitude and latitude values, which extends over 45 km and 35 km, respectively. The spatial extent of the activated area is nearly 1600 km2 (Figure 4e,f). We note that most of Phase 2 corresponds to the period without data on station GE.SBV (Figure 4), therefore the resulting locations are less constrained during this phase and must be regarded with caution. We cannot decide which of the events located with Hypo71 are well located, considering the sparse locations on the N7 distribution of our reliability test (Figure S2g–h). However, the large range of S–P values ( >5.0 s) independent of the location estimates confirms a wider spatial distribution of the hypocentral locations (Figures 4d and 6). More specifically, one feature of Phase 2 is the regular occurrence of seismic events with S–P values on YTMZ station above 6.5 s, and up to 8 s, consistent with locations east of 45.7°E, hence beyond 45 km east of Mayotte (values never found afterwards). Phase 2 includes the easternmost events of the sequence, and a southeastward migration is highlighted by the few earthquakes relocated with HypoDD.
With the previously described criteria, three pulses of activity are identified during Phase 2: 19 June, 23 June and 3 July (Figures 6 and 7). The first two pulses occur on the southeasternmost tip of the distal cluster. The later pulse occurs in the center of the distal cluster. However, the seismicity spreads eastward and upward during this phase, a lower, more focused seismicity remains on the western side of the distal cluster.
At the very beginning of Phase 2, we identify a period without seismicity on 9 June from 04:00 UTC to 22:30 UTC. After this quiet period, the events occur 10 km more east than before this period (Figure 6e). The early seismicity on 10 June is focused on the southeasternmost part of the distal cluster, mainly at depths around 40 km. Phase 2 starts with two consecutive series of successive earthquakes with rapidly increasing S–P values, on 10 and 12 June 2018 (Figure 6).
4.3.3. Phase 3: 8 July to 17 August 2018
From 8 July, the seismicity rate drops and remains at the lowest level over the whole period of the catalog, with an average of two events per day, without any pulse of activity (Figure 4b). Within the magnitude range that goes up to 4.4, only two Mlv > 4.0 events are recorded during this phase (Figure 4c).
Most of the localized earthquakes of Phase 3 (84%) are located within the distal cluster (Figure 8). However, the seismicity of the southernmost and easternmost parts of the distal cluster is very low. Most of the epicenters are spread between 45.5°E and 45.6°E in longitude, and 12.75°S and 12.9°S in latitude (Figures 4e,f and 8). This area corresponds to the activated zone at the very early stage of the seismic sequence, around 12–13 May 2018, where some events are located during Phase 2 as well (Figures 5, 6, and 7).
Phase 3 (8 July–17 August 2018) hypocentral locations on map and sections (legend details provided in Figure 3).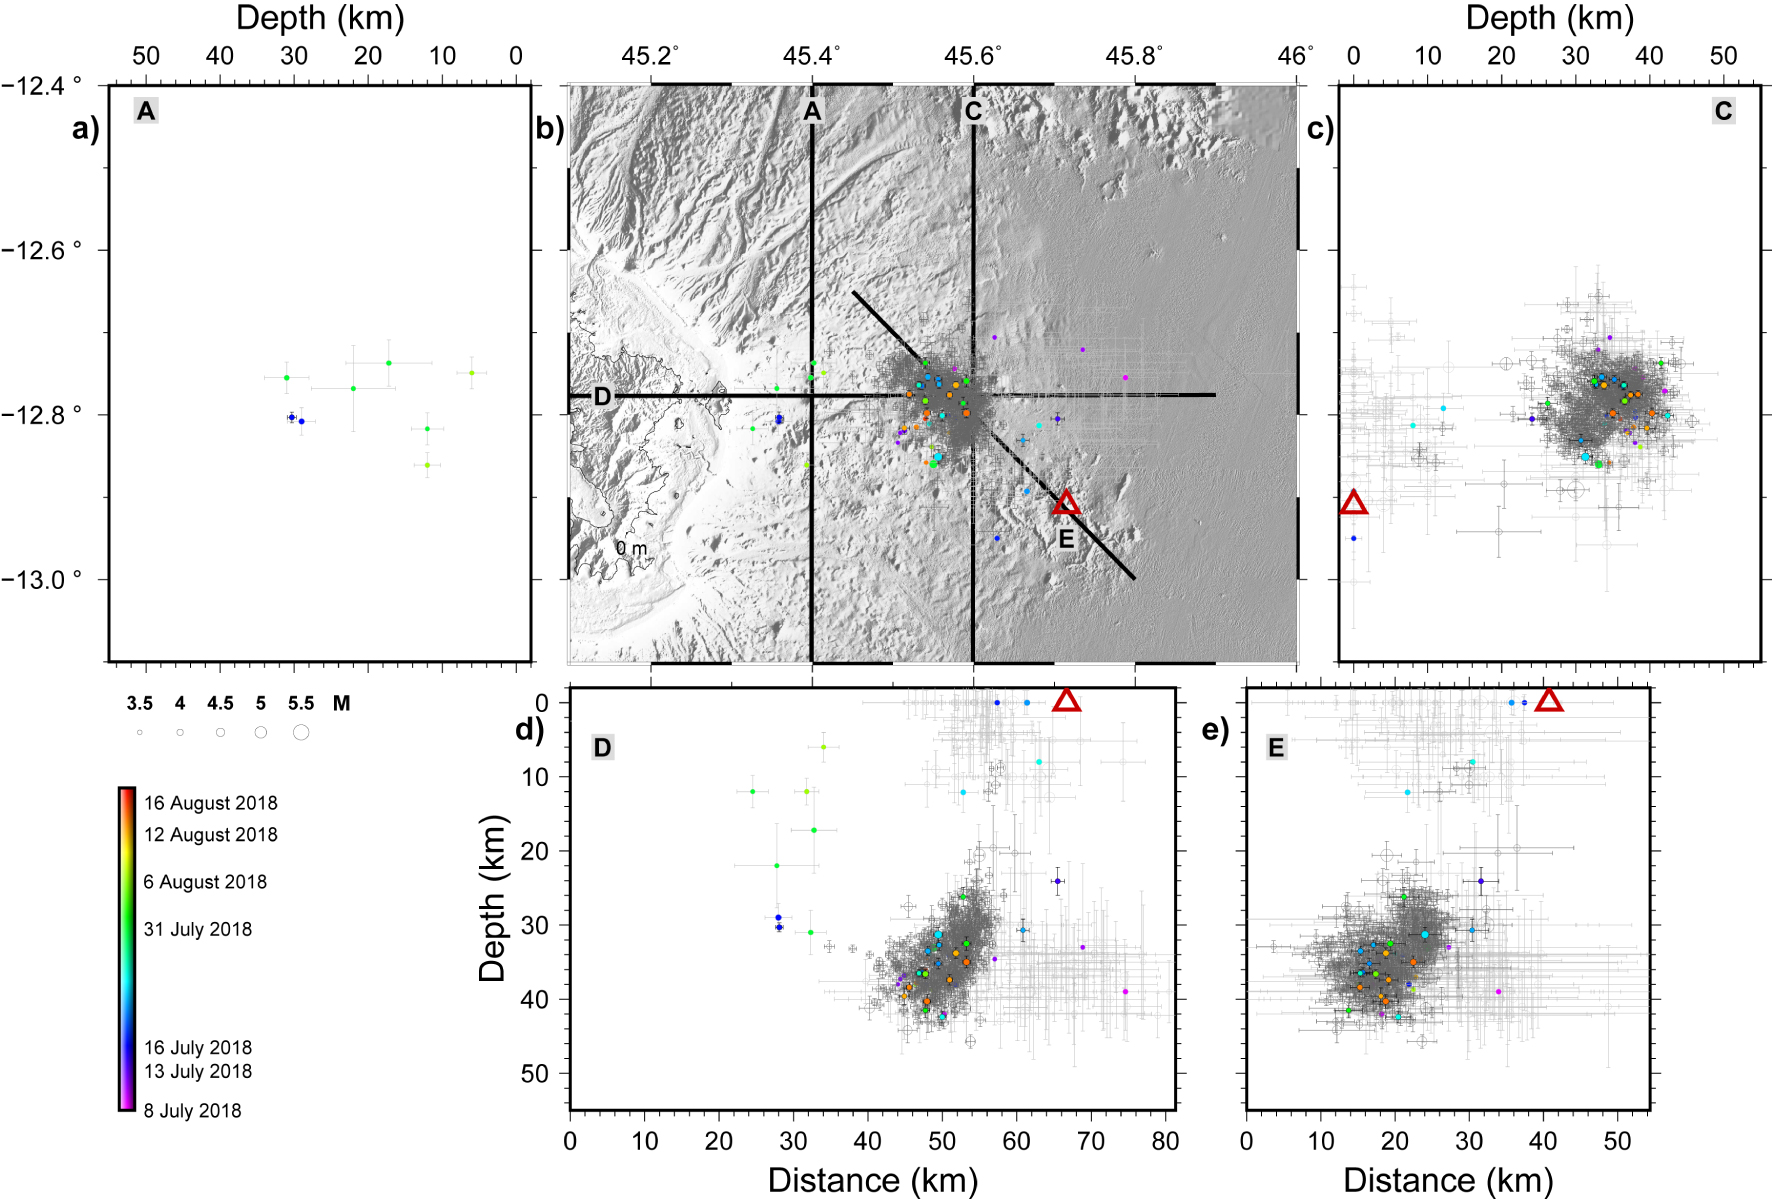
Although the activity within the distal cluster is less intense, Phase 3 corresponds to a major change in the whole Mayotte seismic sequence, since a few small-magnitude events with lower S–P values (below 4.0 s) are located west of the longitude 45.46°E, i.e., at less than 15 km from the east Mayotte coast (Figure 4c,d). Those peculiar events are located where the forthcoming seismicity will be concentrated, i.e., the proximal cluster. From 13 July 2018, the proximal cluster becomes active, with its subsequent events scattered through time until mid-August.
The small number of events during Phase 3, merely 86, prevents an accurate estimate of the b-value, but we estimate that it is larger than 1.6, taking into account the seismicity of both clusters. This suggests a drastic change compared to the previous phases.
4.3.4. Phase 4: 18 August to 30 September 2018
Phase 4 is characterized by a new increase in the seismicity rate, averaging 75 detections and 6 located events per day, including 35 events with a magnitude between 4.0 and 4.8. The seismic activity resumes with successive pulses of seismicity alternately affecting each cluster (Figure 4d). Similar to Phase 3, the b-value of 1.5 of each cluster during Phase 4 confirms that the dynamic differs from the first two phases. Overall, the ratio of “strong to moderate” events (Mlv > 4.5 events relative to Mlv > 3.5 events) is two times lower than during Phases 1 and 2. Most of the events are still located within the distal cluster (60%) with events of higher magnitude on average.
Two periods are of special interest: the end of August and most of the month of September (Figure 4a,b):
- A peculiar seismic activity occurs between 22 August and 6 September 2018, within the proximal cluster, different from its usual and subsequent activity. This 15-day period, the August Proximal Peak (APP), is a series of 62 events identified as distinct from the other proximal and distal events, with S–P values on the YTMZ station of mainly around 3.7 s, and below 4.1 s (Figure 4d). This includes a group of 31 events with S–P values between 3.5 and 4.0 s, forming the pulse of activity on 26 August 2018, the climax of APP. Notably, it corresponds to the maximum of detections on our STA/LTA approach over the whole Mayotte sequence (Figure S1). This is the only example in our catalog of a daily rate above 30 events within the proximal cluster, and the first time where seismicity is mainly located within this cluster in our catalog. The APP events are thus unique, as the depth of many of them range between 0 and 23 km (Figures 4g and 9), while the large majority of the other earthquakes in the proximal cluster are located below 20 km.
- A period of intense seismicity in the distal cluster starts on 11 September. It reaches 100 events between 16 and 30 September, up to 4.7 in magnitude, including 22 Mlv > 4.0 earthquakes, more than one per day on average. The peak of activity is on 17 September, with all events located within the same area as the Phase 3 distal seismicity, but at a lower depth, around 45 km on average (Figures 4g, 8, and 9). This is the last peak of activity in the distal cluster until October 2022. Since the end of September 2018, the daily seismicity rate remains below one located event per day within the distal cluster [Bertil et al. 2019; Lemoine et al. 2020a; REVOSIMA 2022; Saurel et al. 2022].
Phase 4 (18 August to 30 September 2018) hypocentral locations on map and sections (legend details provided in Figure 3).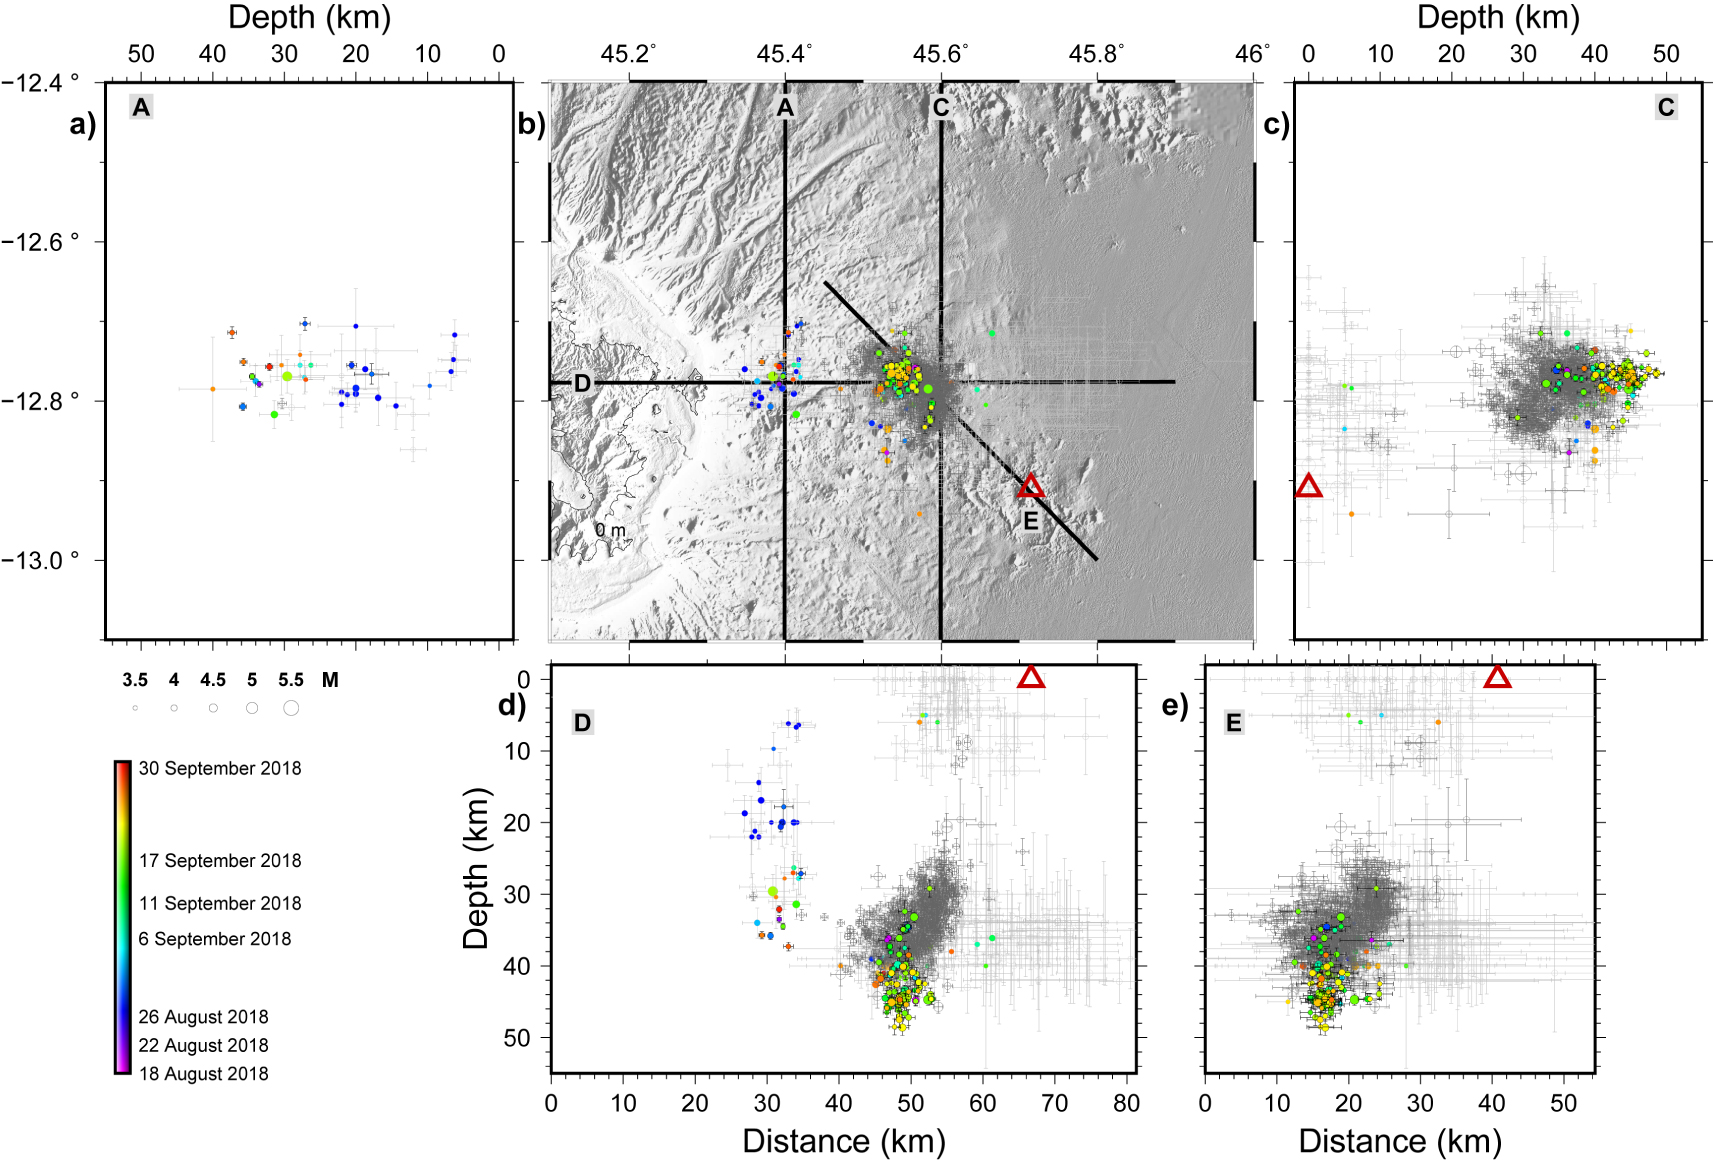
4.3.5. Phase 5: 1 October 2018 to 24 February 2019
Phase 5 is defined by the fading of the previously predominant activity within the distal cluster, coeval with a significant increase of seismicity in the proximal cluster during the first three months of Phase 5, which then slowly decreases until February 2019 (Figures 4b and 10; see also Figure S1). Over this five month phase, 1070 earthquakes are located, corresponding to a maximum of 200 detections and 20 located events per day at the climax of activity (December 2018).
Phase 5 (1 october 2018–24 February 2019) hypocentral locations on map and sections (legend details provided in Figure 3).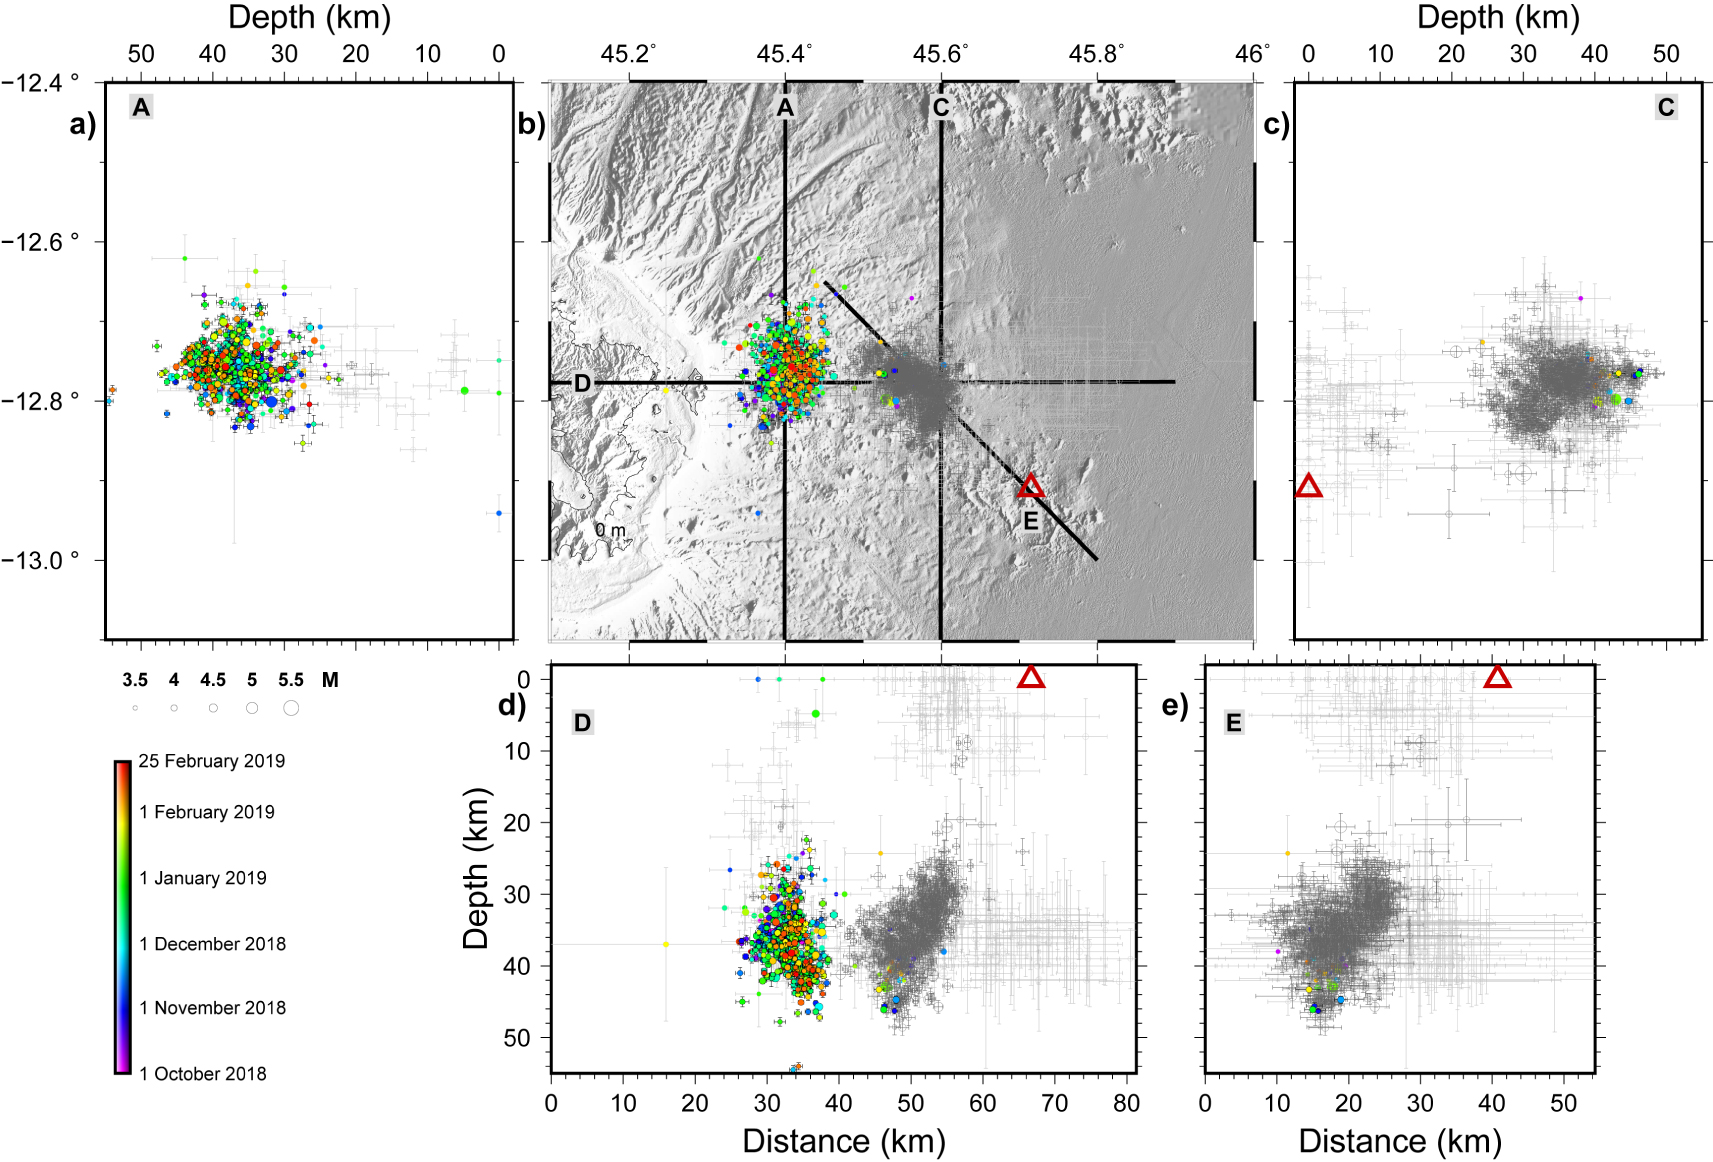
Less than 50 events are located within the distal cluster, with magnitude up to 5.0. We note that the hypocenters are at the same depth ( ∼40 km) than the distal cluster events recorded during Phases 3 and 4. A b-value of 1.1 is estimated from those events.
The seismic activity within the proximal cluster corresponds to more than 1000 located events, with 5 to 25 events per day (Figures 4d and 10), and with lower magnitudes in general (93% of them with Mlv < 4.0), as part of the proximal cluster (Figures 4c and 10). The epicenters belonging to the proximal cluster during Phase 5 are distributed over a 25 × 20 km2 area (Figures 4e,f and 10). The depth of most of them ranges between 20 km and 45 km (Figures 4g and 10). Overall, the events of the proximal cluster are shallower than the distal cluster events. An interesting feature of the proximal cluster is the widening of the depth range over Phase 5, from 36 ± 2 km at the beginning of October 2018 to 36 ± 6 km at the end of February 2019, together with longitude values focused around 45.4°E in longitude (Figure 4g). A b-value of 1.77 is estimated from the events within the proximal cluster during Phase 5.
The observed seismicity distribution (i.e., frequent low magnitude events in the proximal cluster, decreasing proximal activity from April 2019, less frequent but more intense earthquakes in the distal cluster) is observed until the beginning of 2022 [Lemoine et al. 2020a; Lavayssière et al. 2022; Saurel et al. 2022; REVOSIMA 2022].
5. Discussion
5.1. Assessment of data quality
We build a catalog of seismicity for the first ten months of the sequence, despite the network weaknesses, i.e., the small number of stations and the large azimuthal gap for most of the event locations (Figure 2). The manual identification of new P and S phases from additional local and regional stations lowers the magnitude of completeness to a range from 3.2 to 3.7, depending on the network evolution over the first ten months of the sequence. With 2874 located events, our catalog includes 1.5 times more events than the VT catalog from Cesca et al. [2020] which used only YTMZ local stations (1882 events located at fixed 20 km depth), and 2.9 times more events than the catalog of Lemoine et al. [2020a] which used both local and regional stations (1004 events). The additional P and S wave picks integrated to our location procedure decrease the average hypocentral uncertainties to 2.4 km horizontally and 3.6 km vertically, compared to uncertainties as high as 10 km horizontally and vertically in the previous catalog covering the same period [Lemoine et al. 2020a]. These uncertainties are less than 1 km for the 2211 relative locations (77% of the catalog) (see Section 3.4; Figure 3).
The depth of our locations may be compared to those of Saurel et al. [2022] who use a local OBS network. Regarding the hypocentral depths, our locations within the proximal cluster appear to be 3.7 km shallower than theirs, while the depth differences between the locations belonging to the distal cluster are lower than the 2 km vertical uncertainties of Saurel et al. [2022]. Regarding the epicentral locations, we note that the locations of our catalog for the proximal and distal clusters are on average 4.1 and 5.5 km westward respectively, from those of Saurel et al. [2022], while the location differences in latitude for both clusters are lower than the 2.5 km horizontal uncertainties of Saurel et al. [2022].
The reliability of the hypocenters highly depends on the seismic network distribution, which significantly evolved over the 2018–2019 period (Figure 2), with various network configurations including the GE.SBV data (Figure S2a–c) and one, four or five stations on Mayotte (Figure S2). In all cases, the two clusters remain clearly separated by 5 km. We show that the evolution from one to five stations on Mayotte island does not significantly improve the locations, as suggested by the results of our tests using the N1, N2 and N3 network distributions (Figure S2), whereas data from GE.SBV is crucial for preventing misplaced earthquakes at shallow depth and for clearly distinguishing both clusters laterally (Figure 2f, Figure S2d). Therefore, in light of these results, we consider the locations of our catalog reliable for the periods that include the data from GE.SBV. For periods when data from GE.SBV were not available (Phase 2 and the beginnings of Phase 3 and Phase 4), the results should be analyzed more carefully (Figures 4, 6, 7, 9, and Figure S2), particularly for seismicity upward migration and the lack of events a few km west from Fani Maoré during Phase 2 (Figure 7d). However, the shallower depth (above 25 km) of the events and the southeastward migration of the seismicity (Figures 3, 6, and 7) is confirmed by the evolution of the S–P values at YTMZ station (Figure 6d). Moreover, the shallowness of the seismicity during Phase 2 is documented from various catalogs using distinct methods and data sets [Cesca et al. 2020; Lemoine et al. 2020a; Bertil et al. 2021; Feuillet et al. 2021].
5.2. Chronology of the Mayotte seismo-volcanic sequence
With the reliability of our catalog, we refine the spatio-temporal variation of seismicity at the beginning of the Mayotte activity (Figures 4 and 11). In the unrest phase of an eruptive context, the seismo-volcanic event migration highlights the magma propagation into the crust and to the surface, as observed in other volcanic areas such as the El Hierro, Canaries [Martí et al. 2013] or the Bárðarbunga, Iceland [Ágústsdóttir et al. 2019].
Summary eruptive scenario. (a) Synthesis of inferred lithospheric volcanic structures east of Mayotte from previously published studies, with references. (b) Map of the seismicity over the whole period of study. (c–f) Four steps of phase 1. (g–j) Phases 2, 3, 4 and 5. Orange shading highlights inferred extent of magma paths, pink shading are hypothetical reservoirs. Pink lines circle seismically active areas, dashed contour includes most events, continuous contour around denser subset and best-located events. Pink arrows indicate the migration of seismicity, orange arrows indicate inferred direction of magma propagation. Rainbow purple to red color of seismicity is the relative sequence of events for each time window (from blue to red). Black and grey error bars are similar to Figure 3.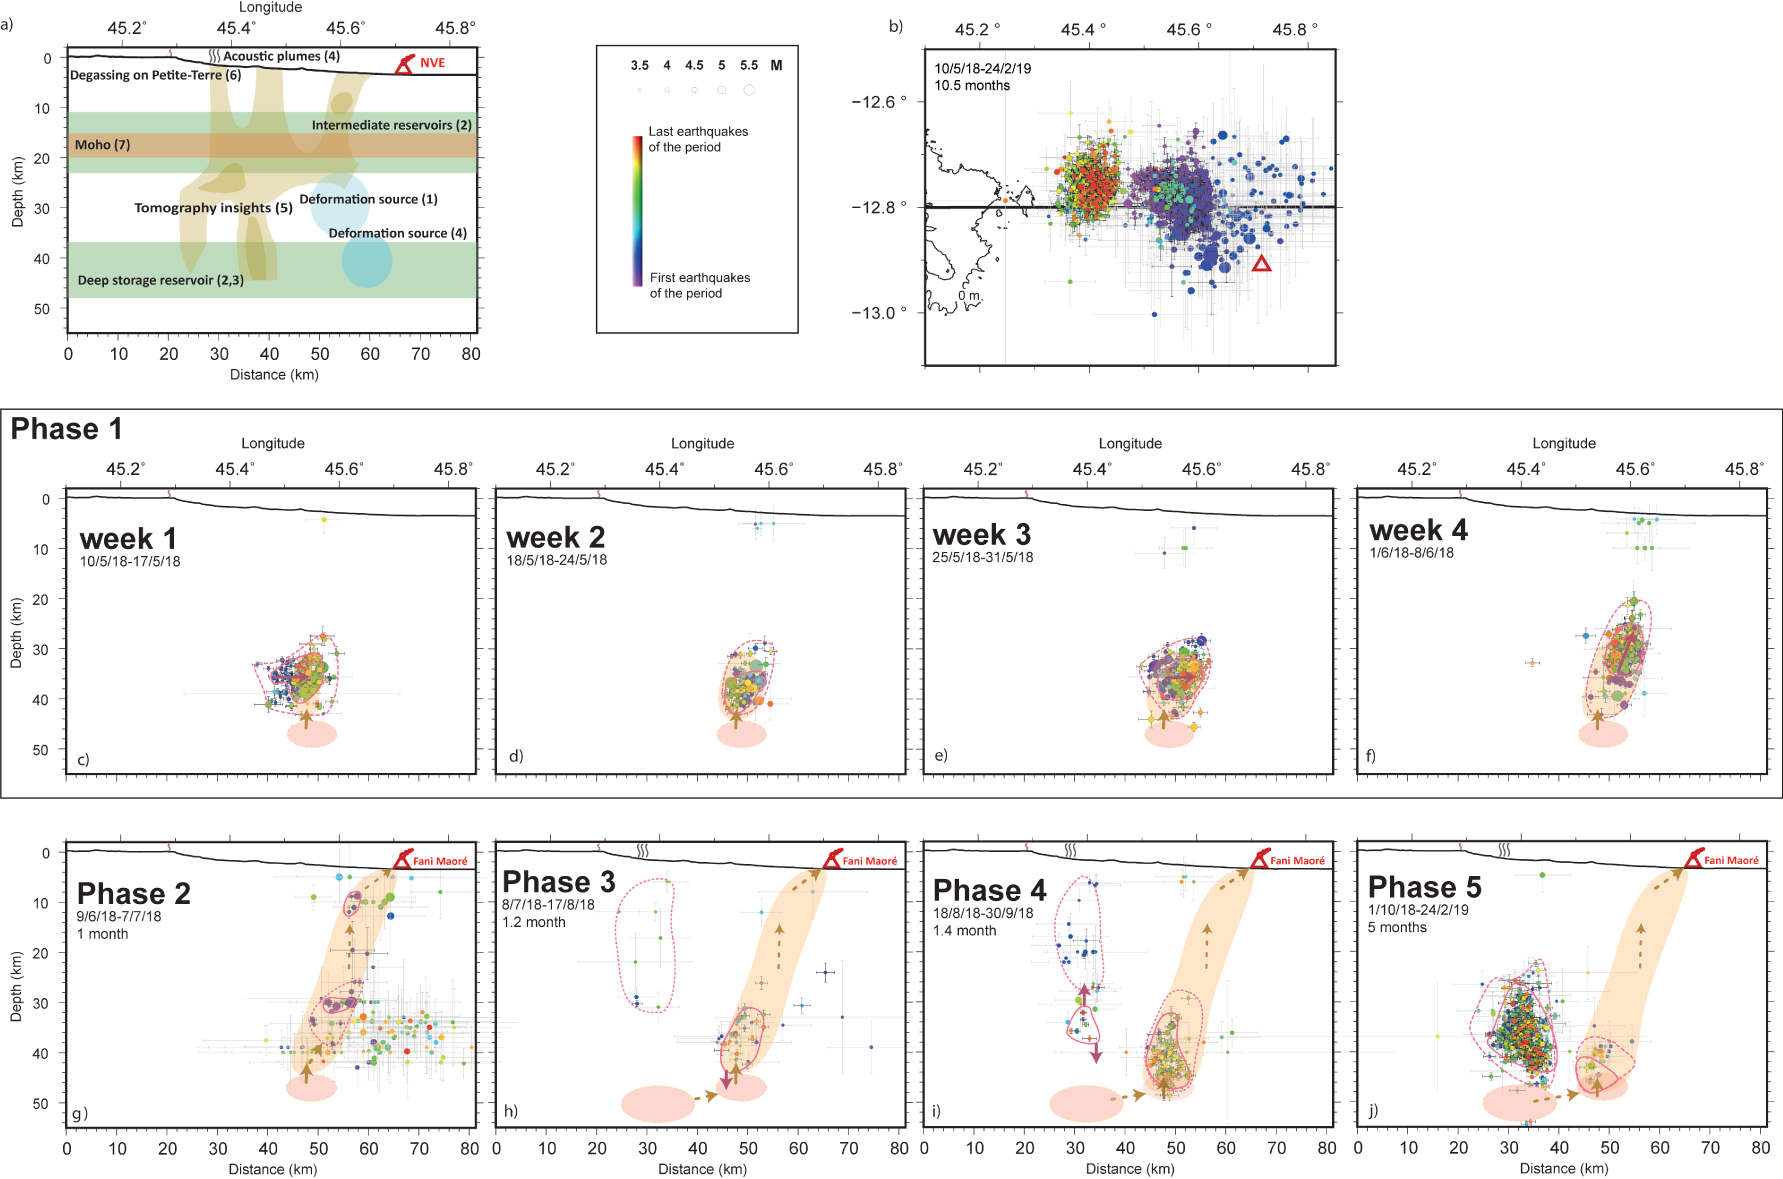
5.2.1. The onset of Mayotte seismic sequence (first week of Phase 1: 10–17 May 2018)
Further analysis of the data in this study confirms a significant lack of seismic activity or surface deformation signal in Mayotte before 10 May 2018, from geodetic and seismic data, respectively (Figure S1). The sequence corresponds to a swarm-like seismicity showing several phases of event migration and pulses of activity encompassing moderate magnitude events (Figures 6, 11b). There is no initial and major shock: the biggest earthquake occurs on 15 May, five days after the beginning of the sequence.
In our catalog, the first detected events (Mlv < 4) occur on 10 May 2018 and are located between the two clusters that are subsequently identified, around 45.45°E and at 30–40 km depth (Figure 5), without any earthquakes being recorded in the following four years of activity. During the two first days, the seismicity rapidly moves to the east (up to 45.5°E) and spreads over a depth range of 30–40 km.
On the one hand, the sudden magmatic activity could be induced by static or dynamic stresses. Several studies such as Feuillet et al. [2006] showed that the destabilization of a deep magma reservoir may be triggered by tectonic transient loading, i.e., by stress induced by the occurrence of one or more earthquakes. The dynamic stresses associated with the seismic waves going through the magma body can also explain the pressure change within the magma reservoir [Walter et al. 2007]. On the other hand, the sudden magmatic activity may be induced by the feeding of the reservoir from a deeper level. Regarding the Mayotte sequence, stresses deduced from focal mechanisms of the 2018-seismic crisis are very consistent with stresses deduced from the regional seismicity before 2018 [Famin et al. 2020], implying that the 2018 earthquakes are in coherency with regional, tectonic stresses. Petrological studies support the tectonic triggering hypothesis [Berthod et al. 2021a]. The seismicity of the first days, confined between the two subsequent clusters, would have initiated the destabilization and damping of the reservoir. The seismic sequence that follows may have resulted from the stress induced by magma injection within the lithosphere and volume change in the reservoir and the conduits.
5.2.2. The distal cluster: progressive shallowing of the seismicity, in four steps (Phase 1: 10 May–8 June 2018)
As shown above, the outbreak of Mayotte seismicity is not a continuous sequence of earthquakes. During the one-month long Phase 1, the events cluster during short periods, lasting from half an hour up to eight hours, with a few dispersed events in between (Figure 6). We distinguish four ∼week-long steps (Figures 6 and 11b–e). During the first week (10–17 May 2018), the seismicity takes place between the subsequent location of the two clusters. It migrates to the east, while remaining at around the same depths (between 37 and 40 km), and reaches the later location of the distal cluster (currently active). This first week is marked by the occurrence of the largest shock of the sequence. This initial sequence may highlight the overpressure associated with magma injection at depth from the deep reservoir (Figure 11b). During the second week (18–24 May 2018), the earlier earthquakes, including large Mlv > 5.0 shocks, occur at a similar latitude and depth, with small variations along the longitude axis. We propose that during this week the stress may have accumulated locally, with strong earthquakes (Figure 11c). Modeling of the GNSS data with strike-slip faulting only suggests fracturing of the crust and magma intrusion between the middle and end of May 2018 [Lemoine et al. 2020a]. The migration of earthquakes along the E–W direction during the first two weeks of the sequence could highlight the spatial evolution of the propagation front of the magma-filled fractures as observed in more shallow crustal levels along active rifts [Grandin et al. 2011]. Following Cesca et al. [2020] and Feuillet et al. [2021], we suggest that the western part of the active area corresponds to the injection point of magma into the surrounding lithosphere, magma that was previously stored in the deep magma reservoir. This segment of the distal cluster remains active (In October 2022), forming the western, nearly E–W oriented part of the distal cluster [Jacqueset al. 2019; Hoste-Colomeret al. 2020; Lavayssière et al. 2022; REVOSIMA 2022].
Then the intense activity on 25 May, and the seismic climax on 1 June, with dozens of seismic events within three to eight hours, highlight major direction changes in the pathway to the surface. The earthquakes migrate to the southeast from 25 May, and to the south and at a shallower depth (40 to 25 km) from 1 June, which supports the view that seismicity on the eastern segment is associated with the eruptive process of Fani Maoré [Figures 3–7, and 11, Cesca et al. 2020; Lemoine et al. 2020a; Bertil et al. 2021]. Remarkably, there is no seismicity further southeast of the location of Fani Maoré, which suggests that most of the sequence is related to the same magmatic plumbing system. This observation is consistent with the seismo-magmatic crustal episode that occurred along the western Aden ridge, where the dyking-related earthquakes showing a lateral migration affect only one second-order spreading segment of the ridge, with no sign of activity within the adjacent en-échelon segments [Ahmed et al. 2016]. We interpret the occurrence of several large seismic events (above magnitude 5.0) in 25 May and 1 June, followed by the direction changes in the migration of the seismicity (Figures 5, 6, and 11d,e), as the ruptures of barriers preventing the magma circulation, as described for example in the 2008 Kasatochi eruption, Alaska [Ruppert et al. 2011].
During Phase 1, the southeastward migration of the seismicity along a lateral distance of 20 km follows the SE-trending regional volcano-tectonic structures: the Jumelles, the Mayotte offshore volcanic chain, and the Mwezi volcanic field [Tzevahirtzian et al. 2021; Thinon et al. 2022]. This suggests that the direction of the magma propagation from the deep magma reservoir at 40 km depth is mostly driven by the regional tectonic stress field with NW–SE and SW–NE-trending maximum and minimum horizontal stresses, respectively [Famin et al. 2020; Lemoine et al. 2020a; Thinon et al. 2022].
5.2.3. The distal cluster: progress of the seismicity from depth towards the seafloor eruption (Phase 2: 9 June–7 July 2018)
During Phase 2, the distal cluster is divided into two distinct active areas: a shallow part, interpreted as ruptures that witness the upward magma circulation reaching the surface, and a deep part between 35 km and 40 km.
We interpret this large deep magnitude seismicity between 14 June and 14 July 2018 to be due to the readjustment of stress above the reservoir due to magma withdrawal and its intrusion in the surrounding lithosphere. In other volcanic contexts, usually at shallower depth, events of magnitude above 5.0 are rare and related to large quantities of material from underlying reservoirs being quickly withdrawn, as described in the strongest eruptions of the last decades for instance [Okada 1983; Moriet al. 1996]. The lateral distribution of the hypocenters and the range of S–P values confirm the large extent of the plumbing system (30 × 30 km).
This seismicity that affects the upper mantle and the crust is interpreted as ruptures associated with the upward magma migration and potentially with the opening of the magma vertical pathways to the surface. Based on the relocations included in our catalog, this seismicity disappears at the end of June 2018. Therefore, the lack of relocated earthquakes above 25 km within the distal cluster suggests that most of the magma ascent from ∼25 km up to the surface occurs aseismically from July 2018. In other active volcanic systems, similar observations have been made, where the remaining shallow seismicity remains low once the conduits to the surface are formed and the eruption is set [Roman and Cashman 2018, and references therein], except during collapse events of the edifice, which has yet to be observed.
Considering that the beginning of the surface deformation signal (related to the magma ascent) is observed since 30 May 2018 [Phase C in Lemoine et al. 2020a], we thus suggest, following Berthod et al. (2020a), that the feeding of the newly formed conduits begins at the very start of the seismic sequence, as early as mid-May 2018. The constant b-values (0.91, Figure 4c) over b-values of both Phases 1 and 2 (10 May–7 July 2018) suggest that the properties of the surrounding rocks are similar during these first two phases [Schorlemmer et al. 2005]. By contrast, Phase 3 is characterized by a higher b-value (1.6), which is usually observed in volcanic contexts [e.g., Wiemer and McNutt 1997; Chiba and Shimizu 2018, and references therein], confirming the start of the submarine eruption between Phase 2 and Phase 3. Inland surface deformation measured using GNSS data and associated with the deflation of this deep reservoir begins between 28 June and 3 July 2018 [Cesca et al. 2020; Lemoine et al. 2020a]. This suggests that the magma pathways up to the surface are established at this time, thus the eruption may have started earlier. From our catalog, the start of the submarine eruption appears to be between 17 and 27 June 2018, when the seismicity reaches the surface (Figures 4g, 6g, and 7). This is consistent with the observed diffusion in zoned olivine crystals [Berthod et al. 2021a], which is interpreted as syn-eruptive magma transfer from the deep mantle reservoir, and implies migrations of 25 km east and 10 km south, and upward vertical migration of 40 km in less than seven weeks from the estimated reservoir location. This corresponds to a vertical migration rate of 0.01 to 0.02 m⋅s−1 in June, hence a relatively fast magma ascent speed [Cassidy et al. 2015]. This is also among the longest migrations of magma ever monitored and documented during an eruption, with only a few, such as the Pinatubo eruption in 1991, having earthquakes extending laterally for 20 km and from 25 km depth [Moriet al. 1996], or the Bárðarbunga eruption in 2014, occurring at the tip of a 48 km long dyke developed over 13 days, between 0 and 10 km depth [Ágústsdóttir et al. 2016].
5.2.4. Onset of the proximal cluster (Phase 3: 8 July–17 August 2018)
Unlike the distal cluster, the seismicity within the proximal cluster starts progressively. The two first events, with an S–P value of ∼4.3–4.4 s, are recorded mid-July 2018. Notably this seismicity only starts soon after the beginning of the seafloor eruption, suggesting a relation between the loss of magma volume in the reservoir and the occurrence of the proximal earthquakes. The seismicity of the proximal cluster is interpreted as a subsiding piston-like structure above a depressed magma chamber [Hoste-Colomeret al. 2020; Jacquesi et al. 2020; Feuillet et al. 2021; Lavayssière et al. 2022]. A complex caldeira-like structure is proposed by seafloor observations above the location of the proximal cluster, with evidence of past eruptive episodes [Berthod et al. 2021a; Feuillet et al. 2021; REVOSIMA 2022; Puzenat et al. 2022].
The b-value estimated from the earthquakes within the proximal cluster (1.6) is higher than in the distal cluster and could indicate a larger amount of fluids within the lithospheric column than for the distal cluster. The identification of potential intermediate reservoirs at 25–30 km depth from petrological and seismic data supports this hypothesis [Figure 11, Berthod et al. 2021a, b; Foix et al. 2021]. Likewise, the VLP events reported during the Mayotte eruption that started mid-June 2018, despite their hardly constrained depth, are located within the proximal cluster area, most likely above the proximal events [Satrianoet al. 2019; Laurentet al. 2021]. Those Mayotte VLP events are unique to this area with analogs only found in Polynesia [Talandier et al. 2016; Poli et al. 2019].
5.2.5. The August Proximal Peak (beginning of Phase 4: 22 August–6 September 2018)
The APP is located in the area of the proximal cluster, but at a shallower depth (Figures 4 and 9), above what will become the most active area of the proximal cluster [Jacquesi et al. 2020; Lavayssière et al. 2022]. We may describe it as a third cluster, because its specific characteristics (S–P values on YTMZ, depths, seismicity rate, number of detected events) are different from the past and future proximal cluster dynamics. It occurs shortly after the start of the proximal cluster and after the start of the Fani Maoré eruption. Since May 2019, one year after the onset of the Mayotte seismic sequence, we note that successive MAYOBS cruises have reported hundreds of meters-high, persisting acoustic plumes on top of the caldeira-like edifice on the seafloor above the proximal cluster [Cathalot et al. 2019; Rinnert et al. 2019; Feuillet et al. 2021; Scalabrinet al. 2021; REVOSIMA 2022; Puzenat et al. 2022]. The beginning of the proximal activity at depth might have destabilized mushes inferred from petrological data around 20 km depth [Berthod et al. 2021a]. We suggest that the APP corresponds to a phase of activation of this area up to the surface, associated with the setting or a renewal of the acoustic plumes above the proximal cluster. As almost continuous gas emissions have been monitored on Petite Terre since 1990 [Sanjuanet al. 2008; Liuzzo et al. 2021; Cadeau et al. 2022], the acoustic plumes might have started before 2018. The APP could mark an enhancement of acoustic plume activity. The depths of the events from 22 to 29 August 2018 range between 0 and 25 km, whereas below Fani Maoré the upward seismic migration on a similar distance takes more than twice this time, associated with larger releases of seismic energy. Because of the low magnitudes, we suggest that the APP occurs in a pre-existing damaged zone, which is still active in October 2022 [REVOSIMA 2022].
Finally, considering the 5.0 ± 0.3 km3 Fani Maoré built up between the end of June 2018 and May 2019, the calculated average eruptive rate of 200 m3/s corresponds to one km3 of erupted material over two months by the end of August. The APP and the following proximal activity could have occurred in response to this already important withdrawal of a large magma volume from a complex plumbing system.
5.2.6. The distal September 2018 seismicity: opening of a new, deep feeding conduit?
A renewal of the distal cluster activity occurs from 3 September 2018, right after the APP, with magnitudes up to 4.8. This reactivation is centered around 45 km depth, i.e., below the previous seismically active area (Figures 4, 9). We identify a pulse of activity on 17 September, whose events are within a wider range of depths, between 35 and 50 km, followed by a higher seismicity rate until the end of the month, yet lower than the May and June seismicity rates (Figure 4). There is also an increase of displacement rate within the GNSS data around 8 October 2018. We consequently suppose that a new feeding way may be built in September 2018, allowing a faster withdrawal of magma from a deeper part of the plumbing system. Such downward propagation of swarm-like seismicity, due to decompression of magma reservoirs, has already been observed within the Eyjafjallajökull complex plumbing system, in Iceland [Tarasewicz et al. 2012].
Taking into account the spatial evolution of the hypocenters within the distal cluster, the top of the destabilizing reservoir complex should be located west of 45.5°E and south of 12.75°S, and deeper than 40 km, assuming that the initial seismic activity started above it (Figure 11). This is located below the deflating source in the deformation model proposed by Lemoine et al. [2020a], but is in agreement with the deformation source proposed by Feuillet et al. [2021], the petrological constraints of Berthod et al. [2021a], the tomography studies [Foix et al. 2021], and the previous conceptual models [Feuillet et al. 2021; Lavayssière et al. 2022] (Figure 11a).
5.3. Relations between the seismic clusters and the magmatic plumbing system
5.3.1. Development of the proximal cluster, link with the Fani Maoré eruption
The seismicity rate on the proximal cluster remains low until October 2018 (the end of the September distal episode), while the GNSS velocities remain constant [Figure S1; Briole 2018]. At this point, the proximal cluster progressively becomes predominant. The number of detected events increases until the end of December 2018, as does the effusive rate deducted from GNSS data [Lemoine et al. 2020a]. Then, from the end of 2018, the eruptive rate slowly decreases, as does the seismicity rate within the proximal cluster. We observe that the proximal seismicity rate roughly follows the eruptive rate, suggesting that the seismicity of the proximal cluster is linked to the eruption process, at least in the period covered by this study. The later decreasing eruptive activity, along with the decreasing proximal seismicity rate [Rinnert et al. 2019; REVOSIMA 2022], tend to show that this proximal seismo-volcanic link continues after March 2019.
The proximal events are focused initially around 36 ± 4 km depth. During the following months, the depth range widens (95% of the depth values between 20 km and 50 km, Figure 4g). The majority of the events are 30 km to 45 km deep, meaning that the damaging of a sub-vertical, likely inherited system, propagates slightly downward from the initial active area, consistent with the idea of an underlying collapse [suggested in Hoste-Colomeret al. 2020; Jacquesi et al. 2020; Lavayssière et al. 2022]. This may favor the circulation of fluids, which would explain the link between the magma drainage and the acoustic plume activity [e.g., Jacquesi et al. 2020].
The shape of the proximal cluster during Phase 5 tends to show that its seismicity until March 2019 is mainly located on its eastern half [which is the most active part of this swarm during the following years: e.g., Lavayssière et al. 2022; Saurel et al. 2022].
5.3.2. On the link between the two clusters and the dynamic of the feeding system
Before the proximal cluster becomes intensely active during Phase 5, we observe during Phase 4 that when the activity of one swarm increases, the activity of the other decreases (Figure 4). The distal seismicity lowers during the APP, and then when it increases during the September episode, the proximal activity decreases. Finally, when the proximal cluster becomes predominant within Phase 5, the distal seismicity lessens. We do not identify a direct “seismicity link” between the two clusters, since there is clearly an area without seismicity between them [also observed in the next period with a better monitoring network: e.g., Lavayssière et al. 2022; Saurel et al. 2022]. It is however obvious that both clusters of seismicity are linked to the same eruptive phenomena.
In agreement with already proposed models [Berthod et al. 2021a, b; Feuillet et al. 2021; Lavayssière et al. 2022], we suggest that the distal activity is related to the building and modifications of the feeding system of the Fani Maoré volcano, while the proximal one is linked to the main reservoir drainage and subsequent reequilibration of stresses, and thus the different alternate behaviors.
5.3.3. The ∼20 km deep mushes
Without considering the APP, we observe an area between 13 and 21 km with very few events above magnitude 3.0. Petrological studies highlight an intermediate magma storage at the base of the crust, somewhere in between 11 km and 23 km [Berthod et al. 2021b, Figure 11], as well as tomography work [Foix et al. 2021], where VLP events are located [Satrianoet al. 2019; Laurentet al. 2021]. Previous studies have detected a 9 km-thick conductivity anomaly at ∼20 km depth [Darnet et al. 2020], interpreted as magmatic underplating [Dofal et al. 2021]. In line with these interpretations, we suggest that this range of depths without seismicity could highlight intermediate magma mushes at the crust-mantle boundary, allowing a non-seismogenic circulation of magma.
5.4. The Mayotte crisis: a unique seismo-volcanic sequence
Oceanographic campaigns [Audru et al. 2006; Rinnert et al. 2019; Tzevahirtzian et al. 2021; Thinon et al. 2022] uncovered important submarine volcanic chains, with ridges, cones and domes, and complex faulted systems, distributed along the Comoros archipelago. The multiple seafloor marks observed in the archipelago are evidence that important volcanic events such as the Mayotte 2018–2022 eruption might have occurred in the past. Some edifices are of comparable size than Fani Maoré, although this volcano is indeed the highest known submarine volcano within the archipelago.
One particularity of the Mayotte sequence is the amount of earthquakes of magnitude over 5.0. More Mlv > 5.0 events reported within the two first months of the Mayotte sequence than in the previous 50 years within the archipelago, from the Davie ridge to Madagascar [Figure 1; Bertil et al. 2021]. This indicates the high amount of stress applied and the high resistance and/or initial low damage level of the sub-Moho lithosphere (brittle mantle) in this area. No equivalent of this Mayotte seismic sequence can be found within the regional seismicity catalogs: there are neither identified seismic swarms nor focused sequences of earthquakes along the archipelago. Locally within monitored periods, the Mayotte sequence is therefore unique. Collective memory moreover does not recall such an intense crisis, as the oral tradition reports damaging earthquakes only in 1606, 1679, and 1788, without mention of any months-long seismicity [Hachim 2004].
The Mayotte sequence is a unique laboratory for large-scale eruption study: upper mantle seismicity migrates dozens of kilometers laterally and up to the seafloor, many earthquakes of moderate magnitudes occur for volcano-seismic sequencing, there is the presence of huge emitted volumes of magma and separated clusters with different apparent dynamics. Such magnitudes and sequences of high seismicity rate and duration are highly unusual. In comparison, the off-Ito swarm and eruption, with magnitude up to 5.5 lasted only three months [Okada and Yamamoto 1991]; see other examples in [McNutt and Roman 2015].
The size of the destabilized reservoir and the quantity and speed of magma, from depth to surface, is generally related to the associated seismic sequence [Feuillet et al. 2006; Michon et al. 2015]. Furthermore, seismicity is widely used as a precursory eruption warning. Here, the initial Mayotte activity is exceptional, with 45 earthquakes of magnitude between 5.0 and 6.0 and hundreds of felt events within the first two months. Occurrence of seismicity above magnitude 5.0 is rare during volcanic unrest, even though some large events are known, preceding or following large eruptions and/or caldeira collapse. However, none of the eruption-related seismic crises monitored so far, such as the Fernandina 1968 eruption on Galapagos islands [Filson et al. 1973], the Kasatochi 2008 eruption in Alaska [Ruppert et al. 2011], or other examples [e.g., McNutt and Roman 2015], ever reached the daily rate and durability of Mayotte sequence. The moderate-to-high magnitude sequences of Mayotte could be due to the difficulty to fracture the lithosphere [e.g., Dofal et al. 2021; Masquelet et al. 2022], where no recent eruption had occurred [e.g., Ruppert et al. 2011].
Here, the seismic swarms highlight the exceptional lateral and vertical extension of the magmatic reservoirs and paths. The distal seismicity highlights one of the longest vertical migrations of seismic activity linked to a magma migration ever monitored, from 40 km depth to seafloor bottom at ∼3.5 km below sea level, and a 25 km lateral migration to the east then to the south-east. Lateral migrations of dozens of kms, and volcano-seismic sequences that do not happen right below the volcanic edifices, are rare, but have been observed during other dyking events [2011 on El Hierro, Canary islands, Carracedo et al. 2015; 2014 on Bárðarbunga, Iceland, Ágústsdóttir et al. 2016; 2016 on Brava Island, Cabo Verde, Leva et al. 2020].
Similarly, an “aseismic” zone separates our two clusters. We suggest that the two clusters are linked to the eruptive process at the surface, along with the emptying of a deep reservoir. Different clusters can be observed around a same magma body, highlighting its expansion or a spreading eruption [as observed below El Hierro, Cerdeña et al. 2014]. However, in the Mayotte case, the two clusters have different dynamics. The thoroughly researched and monitored example of Bárðarbunga (Iceland) dyke intrusion in 2014 shows a similar pattern: there is evidence of two distincts seismic zones, one linked to a caldeira collapse, the other linked to magma ascent within a 48 km-long dyke reaching the surface [Sigmundsson et al. 2015; Gudmundsson et al. 2016; Ágústsdóttir et al. 2019]. However, in the Bárðarbunga example, the seismicity is above 10 km. The Mayotte eruption is the first observation of a collapsing event in the mantle at depths of 25–50 km.
6. Conclusion
We build up an exhaustive catalog of the beginning of the Mayotte seismo-volcanic sequence, from the onset of the seismic sequence on 10 May 2018, to the last day of monitoring without OBS networks on 24 February 2019 [Saurel et al. 2022]. Despite the initial monitoring issues, it is possible to follow up on the crisis and improve the seismic catalog afterwards.
The sequence starts with the propagation of a feeding conduit, built up in segments, from a deep (⩾40 km) reservoir. This is highlighted by one month of deep, swarm-like seismicity (10 May–8 June 2018), with a high seismicity rate (30 events per day) and frequent earthquakes above magnitude 5.0 (one a day on average), marking the importance of the stresses applied on barriers, which broke progressively, creating a seismicity in successive pulses. Seismicity migrates from 20 km east of Mayotte and ∼40 km depth to almost 50 km east of Mayotte and ∼30 km depth, within the so-called distal cluster.
The conduit—dyke—opening up to the surface occurs during the following month (9 June–7 July 2018). Even as the seismicity rate lowers, the magnitudes are as high as in the preceding month. The upward migration is confirmed with GNSS data and international networks [e.g., Cesca et al. 2020; Lemoine et al. 2020a]. The “superficial part” (above 25 km) is less seismic, magma paths perhaps grow through a partially damaged environment and/or pre-existing conduits. Once the conduits are opened on the seafloor, at the end of this phase, there is no more occurrence of seismicity above 25 km within the distal cluster. The seismogenic building of conduits up to the surface, from 10 May to 7 July 2018, cover 25, 10 and 40 km eastward, southward and along the vertical axis, respectively. Superficial earthquakes, i.e., close to the seafloor, occur between 17 and 27 June, marking the end of the conduit building, and likely the beginning of the eruption. The distal cluster activity remains low since October 2018.
The eruption of the Fani Maoré volcano causes a rapid and large deflation of the feeding magmatic system, triggering a deep seismicity extending at depth, highlighted by the proximal cluster located 0 to 20 km east of Mayotte. This seismicity starts in July 2018, at ∼30 km depth and develops mainly downward in the following months, to depths ranging between 25 and 40 km in February 2019, with lower seismicity rates and magnitudes. The proximal seismicity rate follows the eruptive rate, but takes place below the complex, westward part of the offshore Mayotte volcanic chain. The following seismicity, since October 2018, is mainly focused on this cluster.
In addition to detailing the two first months migrations, this catalog allow to identify two peculiar episodes of seismicity, one at the end of August 2018 above the proximal cluster, possibly linked to the acoustic plumes, and another in the distal cluster in September 2018, interpreted as the opening of a new feeding pathway allowing for a higher eruptive rate since October 2018.
This seismic sequence questions the state-of-the-art knowledge about the Comoros archipelago lithospheric structure and volcanism. The intense seismicity of the two first months of the Mayotte sequence proves that deep-feeding conduits have not opened for a long period, marking a difficult magma intrusion into the lithosphere. Further investigations of the regional seismicity will help us to understand the link between volcanism, earthquakes, and tectonic activity that much more, and will help us to refine these hypotheses.
Conflicts of interest
The authors declare no competing interest.
Acknowledgments
The authors thank Carole Berthod, Pierre Briole, and Chastity Aiken for constructive discussions, which improved this article. They are also grateful to Angèle Laurent and Charles Masquelet, which shared generously unpublished results. This study is part of the ANR COYOTES project (ANR-19-CE31-0018). The authors thank the three anonymous reviewers and the editors for their comments, and Gregory Owcarz for improving the quality of the English.
A large part of the data have been acquired in the framework of the first response team to the Mayotte seismic crisis, including in particular members of the BRGM DRP/RSV unit: A. Colombain, G. Dectot, C. Gracianne, E. Maisonneuve, K. Meza Fajardo, A. Roullé, F. Tronel. This work was possible thanks to the seismic data shared by the Karthala volcanologic observatory (OVK).
This article is part of Nicolas Mercury’s thesis at the ITES laboratory (CNRS, University of Strasbourg, ENGEES) funded by BRGM and the French Ministry of Ecological Transition (MTE, DGPR).