


 CC-BY 4.0
1. Introduction
In May 2018, the Mayotte island, located in the Comoros archipelago, in the Indian Ocean, about 300 km north-west of Madagascar, was affected by an unprecedented seismic crisis, with more than 300 earthquakes recorded per day at the beginning of the crisis [Bertil et al. 2021; Cesca et al. 2020; Lavayssière et al. 2022; Lemoine et al. 2020; Feuillet et al. 2021; Retailleau et al. 2022; REVOSIMA 2019; Saurel et al. 2022; Mercury et al. 2022]. The majority of these earthquakes were of low magnitude (<2.0), but several events of moderate magnitude (3.5 to 5.9) were strongly felt, causing panic among the population [Miki 2021]. The largest event, of magnitude Mw = 5.9, occurred on May 15. The earthquakes were located 5–30 km offshore east of Mayotte with epicenters clustered between 5 and 15 km east of the island and along an alignment of volcanic cones at 25 km east of the island, at depths ranging from 25 and 50 km [Bertil et al. 2021; Lavayssière et al. 2022; Lemoine et al. 2020; Feuillet et al. 2021; Retailleau et al. 2022; REVOSIMA 2019; Saurel et al. 2022; Mercury et al. 2022]. As of May 2022, the seismicity is still ongoing, although at a much lower intensity and a mean of 10 low-magnitude events per day [REVOSIMA 2021].
In July 2018, the Institut national de l’information géographique et forestière (IGN), which is in charge of the French Permanent GNSS (global navigation satellite system) Network (RGP—réseau GNSS permanent), started detecting anomalies in the time series of the GNSS stations of Mayotte and issued a warning on the RGP web portal. The anomalous drifts of coordinates were both horizontal and vertical. The latter were intriguing because they could not be fitted with dislocation models assuming crustal earthquakes in the area of the seismic crisis. The first elastic simple models indicated a deflation source located in a range of 30–60 km east of Mayotte, at a depth of 25–50 km, depending on the model and the time periods considered [Lemoine et al. 2020; OVPF 2019]. The large depth of the deformation source was a strong indicator of a magmatic origin of the phenomenon. Based on the observation of dead benthopelagic fishes by the local population, the scientific community quickly agreed on a submarine volcanic origin of the phenomenon.
Support was given by the French government and scientific institutions to deploy additional instruments both inland (seismometers and GNSS stations) and offshore (Ocean bottom seismometer, pressure gauges) around the active zone from early 2019. In May 2019, the MAYOBS1 cruise discovered a large new volcano edifice, Fani Maoré, at the seafloor around 50 km east of the Mayotte island [Feuillet 2019; Feuillet et al. 2021]. The eruption is one of the largest effusive eruptions in the world over the last three centuries, with about 5 km3 of lava flow emitted during the first year [Feuillet et al. 2021].
In June 2019, after the discoveries of MAYOBS1, a multi-institutional coordination was created to monitor the phenomenon by means of an array composed of in-land instruments monitored in real time, and periodic campaigns performed inland and offshore to collect data from other instruments as well as geological and geochemical samples. This coordination, called the REVOSIMA (Réseau de surveillance volcanologique et sismologique de Mayotte), is operated by IPGP (Institut de physique du globe de Paris) through in particular the OVPF-IPGP (Observatoire volcanologique du Piton de la Fournaise), in collaboration with BRGM (Bureau de recherches géologiques et minières) through its regional department in Mayotte. REVOSIMA also gathers IFREMER (Institut français de recherche pour l’exploitation de la mer), CNRS (Centre national de la recherche scientifique), IGN (Institut national de l’information géographique et forestière) and several other French entities. For the 24/7 continuous real-time monitoring, the REVOSIMA uses a permanent network installed inland on Mayotte comprising eight seismometers, nine GNSS stations and one gas station (as of January 2022).
GNSS method is now one of the most powerful and widely used methods worldwide, to detect, monitor and model in real-time, the continuous ground deformation associated with volcano unrests and eruptions [e.g. Dzurisin 2006; Lisowski 2007; Segall 2010]. For the seismic crisis affecting Mayotte, GNSS data and their modeling were decisive in understanding its origin. Here, we present first how the GNSS network was expanded in Mayotte through the evolution of the crisis. We then show the time series of GNSS coordinates and their modeling, which provide constraints on the dynamics of magma transfer throughout the lithosphere. Finally, we discuss the contribution of the ocean bottom pressure gauges, installed during the crisis, for modeling.
2. GNSS data
2.1. GNSS network in and around Mayotte
Even though RGP detected the anomalous drifts of coordinates of its 4 GNSS permanent stations as early as July 2018, it quickly became clear that the monitoring of the phenomenon would require a densification of the GNSS network and coordination of all the actions undertaken for that purpose.
Beyond the 4 stations already used (namely MAYG, BDRL, GAMO, KAWE), two other GNSS stations already in operation on the island in 2018 (MTSA and PORO) were used for monitoring, and three others were specifically installed in Mayotte in 2019 (KNKL, PMZI and MTSB; Figure 1a). A GNSS station (GLOR), was also installed on Grande Glorieuse island, about 250 km east north-east of Mayotte (Figure 1b).
(a) Location of the GNSS stations on Mayotte island. (b) Location of the GNSS station located around Mayotte and used by the REVOSIMA. Green star indicates the eruption location.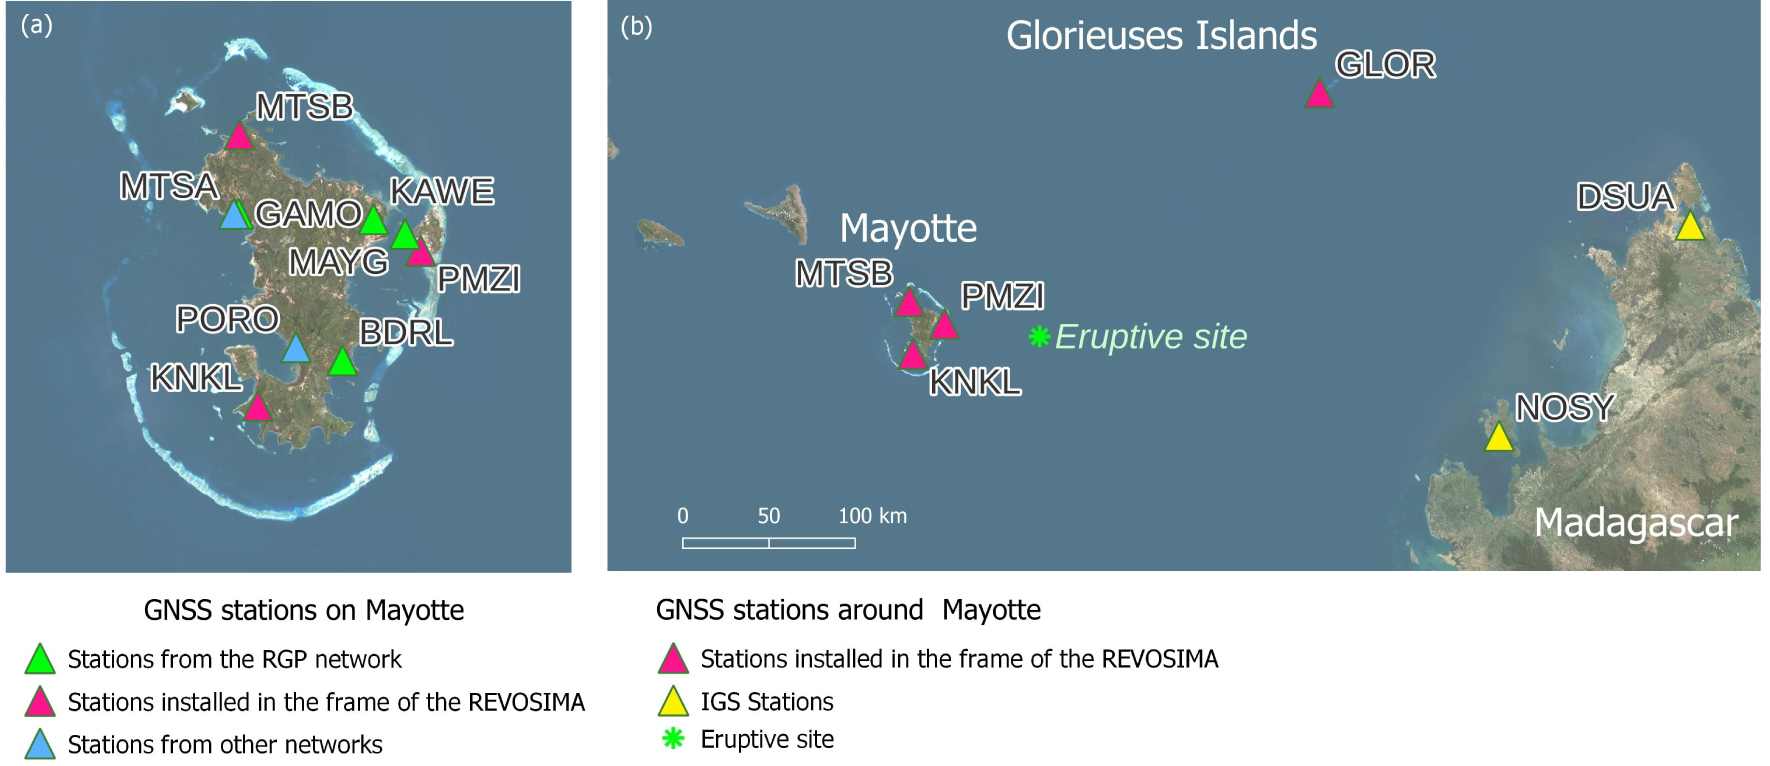
Two additional stations, DSUA and NOSY, located north of Madagascar (about 400 km east from Mayotte), were also used by the REVOSIMA for processing of the Mayotte data [Figure 1; Bousquet et al. 2020]. However, these stations went quickly out of order, and could not be repaired since then due to the covid-19 pandemic. Also, there is no GNSS data available from the other Comoros islands.
The comprehensive list of the GNSS stations used for the monitoring of the eruption offshore Mayotte is available in Supplementary Material A.
All the GNSS stations are connected to the internet either by 4G networks or by terrestrial link, and queryable in real-time. The four native RGP stations (MAYG, BDRL, GAMO, KAWE) provide multi-GNSS observation hourly files at 1 s sampling rate, whereas the other stations provide hourly or daily files at 30 s sampling rate. All observation files are transformed into daily 30 s files for homogeneous processing.
All the entities involved in the network have come together as a dedicated working group, as early as July 2018, under the coordination of IGN, to achieve a common mode of operation of the stations, and to agree on the centralization and sharing of GNSS data and products, through the operational infrastructure of the RGP, made available by IGN. This working group gathered the following entities in an exemplary public-private partnership: Institut national de l’information géographique et forestière (IGN), Institut de physique du globe de Paris (IPGP), Observatoire volcanologique du Piton de la Fournaise (OVPF-IPGP), Ecole normale supérieure, Laboratoire de Géologie (ENS), Ecole et observatoire des sciences de la terre de Strasbourg (EOST), Centre national d’études spatiales (CNES), Laboratoire de l’atmosphère et des cyclones, université de La Réunion (LACY), Exagone, Précision Topo.
2.2. Automatic GNSS data processing
The GNSS data are routinely and automatically processed by both OVPF-IPGP in charge of the 24/7 continuous and real-time monitoring of Mayotte, and IGN, which is in charge of data distribution (see Data availability statement).
OVPF-IPGP calculates daily solutions with the GipsyX precise point positioning (PPP) software [Bertiger et al. 2020], using the best quality JPL’s orbits and the clock products available at the time of calculation (ultra, rapid, then final orbits after a delay of ten days) and provides daily solutions in the ITRF2014 reference frame. The standard deviations of the daily coordinates of MAYG for the years preceding the crisis, detrended from the secular velocity of the station, are 1.9, 1.8, and 5.6 mm for eastern, northern, and vertical components, respectively. The other stations have similar scores. The daily solutions are distributed, processed and displayed on WebObs, a web-based integrated system for data monitoring and networks management routinely used for the crisis management in a dozen volcano observatories worldwide, including the IPGP observatories [Beauducel et al. 2020a]. WebObs is an open source project that includes several specific modules for seismological, geophysical and geochemical data processing in near real-time, one of these modules is dedicated to GNSS solutions.
The resulting outputs from these processes are:
- coordinate files for all the stations used, in the ITRF2014 reference frame;
- time series of the station coordinates with respect to the reference coordinates, for which the horizontal tectonic motion is subtracted using the theoretical velocity given by the tectonic plate model provided by the ITRF;
- time series of the baselines from selected pairs of stations;
- velocities estimated from linear trends for each station at different time windows, represented as vectors on maps;
- source modeling at different time windows (see Section 5.2.2).
IGN calculates the daily solutions with the Bernese GNSS software in double difference mode, including the GNSS stations in and around Mayotte, as described above, and a large number of stations located in Africa, Asia, Madagascar, and on some islands in the Indian Ocean or in the Subantarctic zone. Most of those stations are part of either the RGP or the IGS networks, and their data are available through the RGP and IGS data centers. Depending on their data availability, up to 66 stations are used. The computation is made on a daily basis using the 24 h observation data. The coordinates are produced in the ITRF2014 reference frame. Moreover, a weekly computation is performed, combining the normal equations of the last seven days.
The resulting files from these processes are:
- solution files (normal equations) in the SINEX format;
- coordinate files for all the stations used, in the ITRF2014 reference frame;
- time series of coordinates with respect to the reference coordinates, for which the horizontal tectonic motion is removed using the theoretical velocity given by the tectonic plate model provided by the ITRF.
3. Pressure gauge
Ocean bottom pressure (OBP) gauges were deployed by the REVOSIMA in February 2019 along with ocean bottom seismometers (OBS; Figure 2a), with the aim of collecting data as close as possible to the seismic active area and with an azimuthal distribution around the source tailored to best constrain its location and spatial extent. Several SBE 37-SM MicroCat CT Recorder pressure gauges (named SBE 37 hereafter) constructed by Sea-Bird Electronics were therefore installed directly on OBSs frames (Figure 2b), and later redeployed through successive MAYOBS campaigns (Supplementary Materials B and C). Although this type of pressure gauge sensor was not originally designed for geodetic pressure measurements, we deployed them with the first intention of detecting pluri-centimeter co-seismic signals. A previous experiment, made in response to the Santorini volcanic unrest in 2011, showed their potential usefulness in such geodetic studies [Vilaseca et al. 2016]. Figure 2a shows the location of the first pressure gauges deployment, which provided six OBP records from February to May 2019, i.e. nine months after the onset of the crisis. Originally, before the discovery of the offshore eruption, the spatial OBS distribution had been designed wide enough to encompass the entire seismic swarm, therefore its design was not optimal for the deformation monitoring.
(a) First deployment of SBE 37 pressure gauges (red diamonds), deployed in February 2019 and all recovered during the MAYOBS1 campaign in May 2019 [Feuillet 2019; Rinnert et al. 2019]. The land-based GNSS stations are represented by blue diamonds and the eruption location by the black star. (b) SBE 37-SM pressure sensor equipped on an OBS package.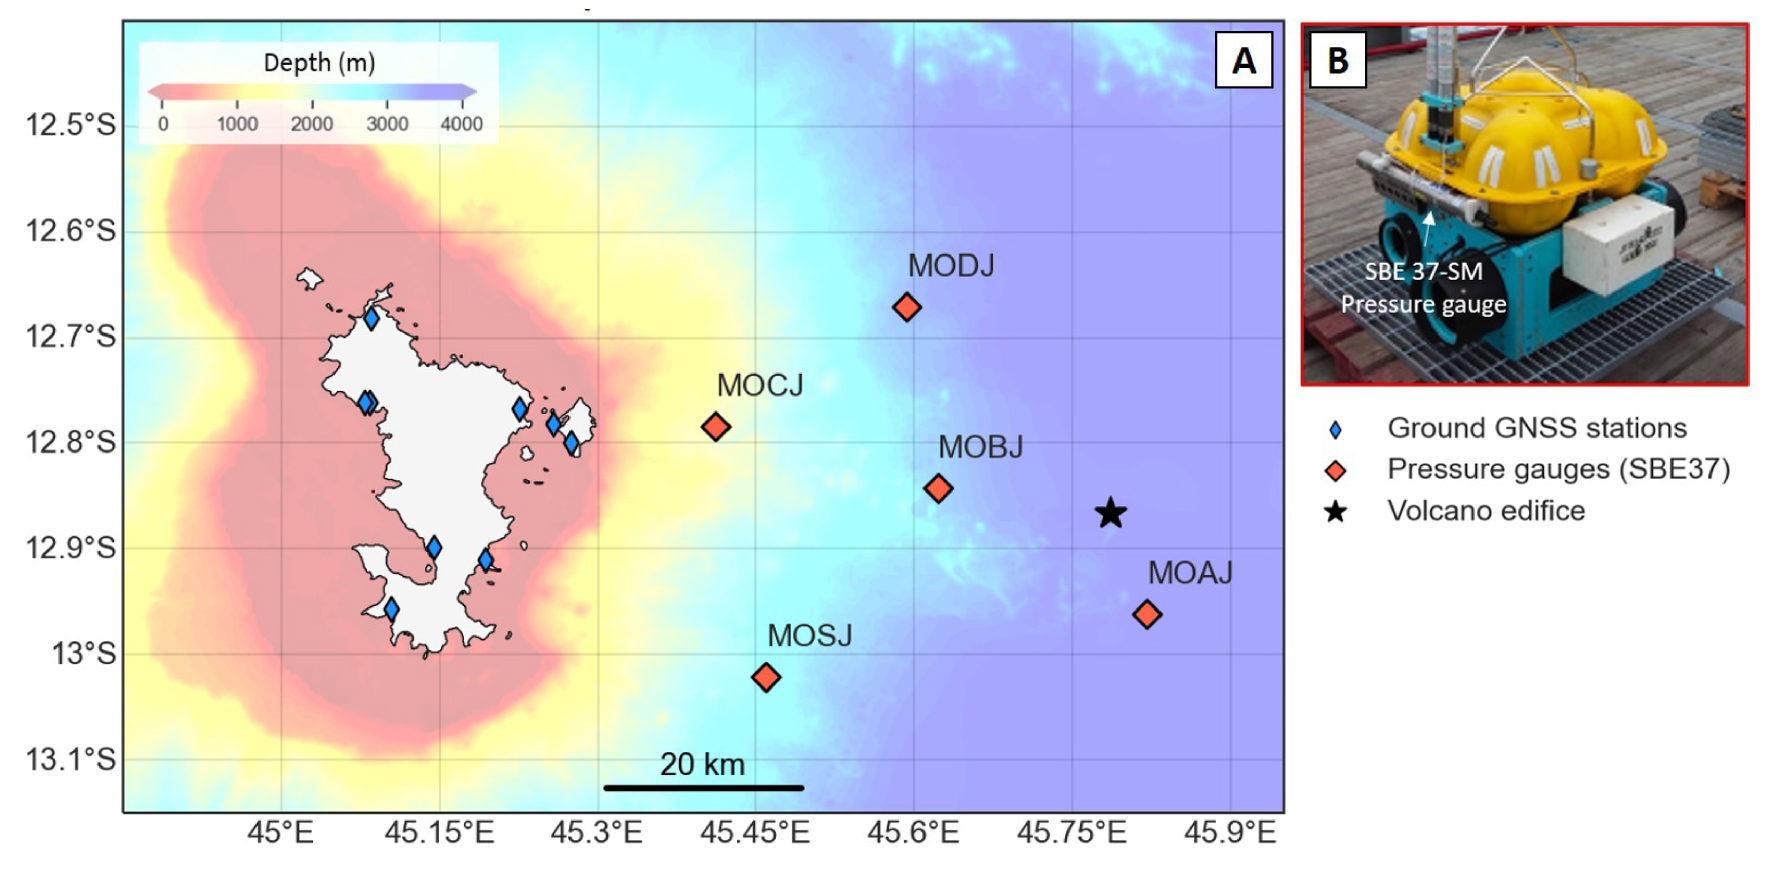
For monitoring seafloor deformation through time with OBPs, limitations arise from (1) the instrumental drift and (2) the oceanographic variations. The drift of pressure sensors is usually modeled by combining an exponential term modeling the initial adaptation of the sensor and a long-term linear drift [Wallace et al. 2016; Chierici et al. 2016; Gennerich and Villinger 2011], which can reach several centimeters per year and be on the same order of magnitude as the vertical signal, one wants to detect.
To address this instrumental issue, and to allow the precise monitoring of slow sea-floor deformation [Wilcock et al. 2021], the SBE 37 pressure gauge network was completed from April 2020 by an A0A pressure gauge (see Supplementary Material B). In the A0A system, the instrumental drift is estimated in-situ by periodic venting from ocean pressures to a reference atmospheric pressure. However, no significant vertical ground displacements are recorded by GNSS stations of Mayotte, Grande Glorieuse and Madagascar from this period (see Supplementary Material F), and thus we do not expect any seafloor deformation signature in these A0A pressure records. Although these data are not used in this paper in terms of deformation, the drift-controlled records are used hereafter to assess the order of magnitude of SBE 37 pressure gauges instrumental drift by comparing simultaneous and co-located bottom pressure data. The pressure differences between SBE 37 (MOCH and MOCI, see Supplementary Material B) and A0A1 records, deployed from October 2020 to April 2021, are shown in Supplementary Material D. These two comparisons suggest that SBE 37 sensors used in this study have a linear trend below 2 hPa/month (∼0.016% per year considering a depth of 1500 m).
The existence of oceanic variations at different timescales is the second major limitation for the detection of seafloor deformation using OBPs. Indeed, while vertical seafloor displacements associated with volcanic activity are expected to be in the order of a few centimeters, oceanic variations can reach tens of centimeters on the same time scales [Dobashi and Inazu 2021]. The oceanic pressure variations can be partly inferred from ocean circulation models [Dobashi and Inazu 2021]. For this study, we used bottom pressures from the “cube92” version of the ECCO2 model, which are available at daily resolution on a regular grid (0.25°) from January 1992 to March 2021 [Menemenlis et al. 2008]. Consequently, OBP data recovered after March 2021 were not considered in the present study. Concerning the high-frequency signal, i.e. mostly diurnal and semi-diurnal tides, the OBP records were low-pass filtered at 72 h using a Demerliac tide killer [Demerliac 1974].
The filtered and corrected pressure anomalies are shown on Figure 3. The 6 OBP records show a pronounced variation over a short initial period of a few days, therefore the first five days of data were removed to reject the main part of the initial instrumental drift (red portions on Figure 3). Adaptation periods, as short as a few days, have been previously observed by Gennerich and Villinger [2011], who speculated that this relative fastness was due to previous immersion of the sensors for long periods at similar depths. All 6 data records exhibit a positive linear trend (dashed lines on Figure 3), ranging from 1.67 hPa per month (MOSO) to 5.34 hPa per month (MOSE), which may correspond both to a linear instrumental drift and to the signature of the seafloor subsidence in the region during the March–May 2019 period. OBP data from the other campaigns are shown in Supplementary Materials E.
Bottom pressure anomalies (BPA) from six OBP records (February to May 2019), after applying the Demerliac filter and correcting the ocean signal contribution from the ECCO2 model. The first five days of data (red portions) are not used in trend estimates. Dashed lines represent the linear trend of each BPA series, for which the value is annotated on the bottom right corner.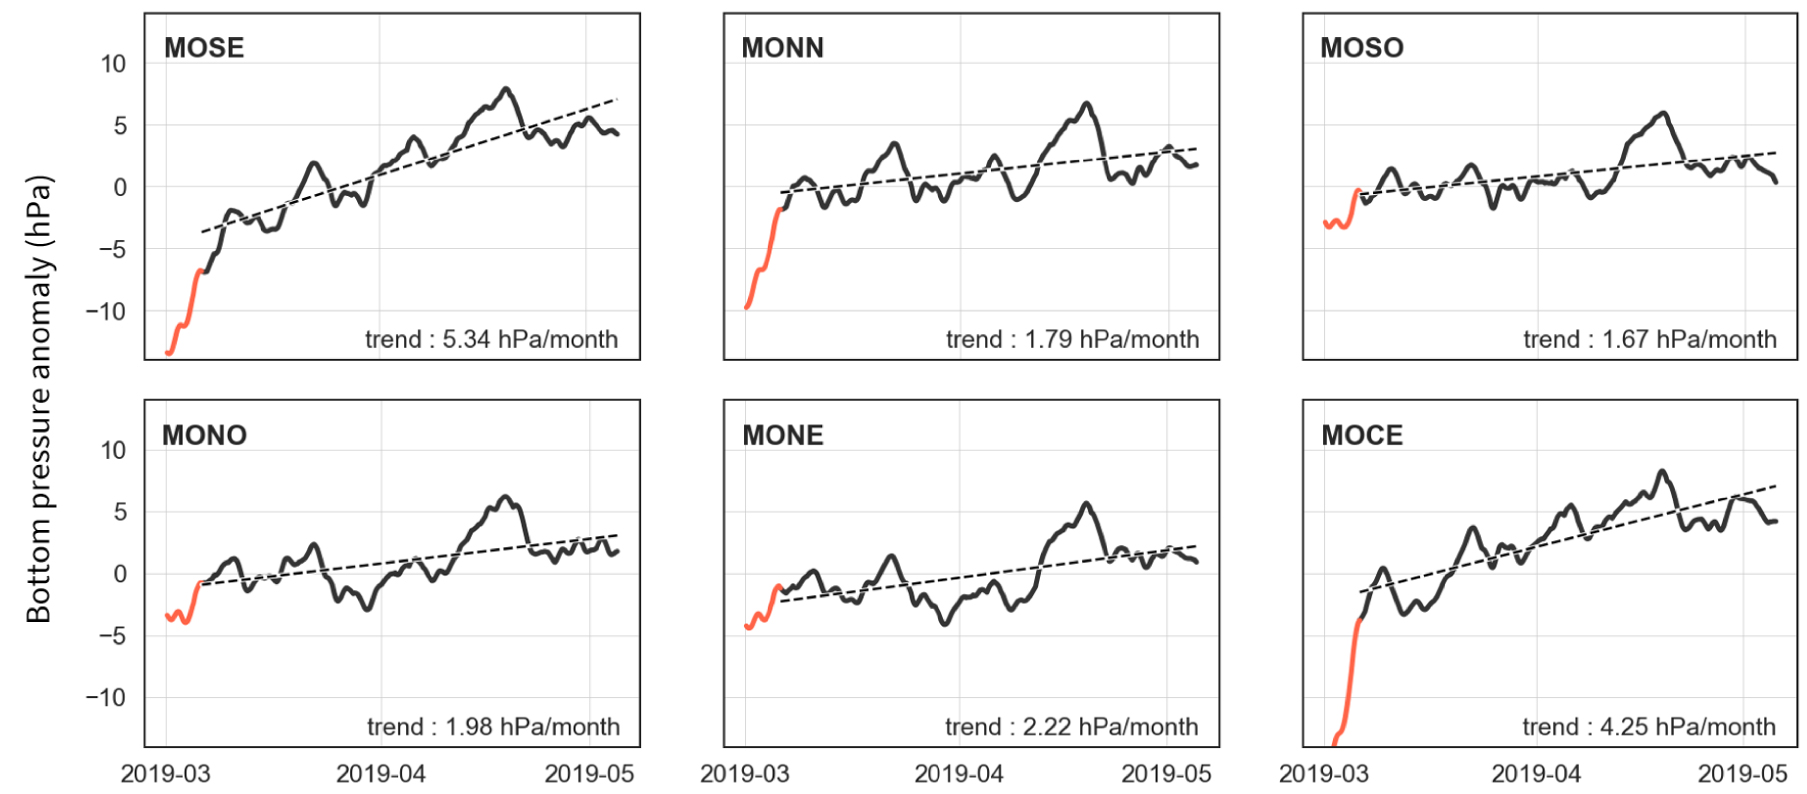
Although associated with large uncertainties (mainly due to uncorrected instrumental drift and the presence of residual oceanic variations), these OBP records are used in this study to demonstrate that it can successfully complement GNSS data in order to improve the determination of the source locations though inversion models (Section 5.2.3).
4. Ground displacement trends
4.1. Comparison between Bernese and GipsyX time series
Before a close inspection and modeling of the GNSS trends, we first compared the time series produced by our GipsyX and Bernese computations. For that, we used MAYG, which is the only station that existed several years before the crisis, as it was installed on December 22, 2013. Figure 4 shows the east, north and vertical time series of the station detrended from a secular velocity.
Comparison of the MAYG time series processed by the Bernese (in red) and GipsyX (in green) software during the 2014–2017 period preceding the volcano crisis. The points correspond to raw daily solutions, and the lines correspond to 14-day moving average trends.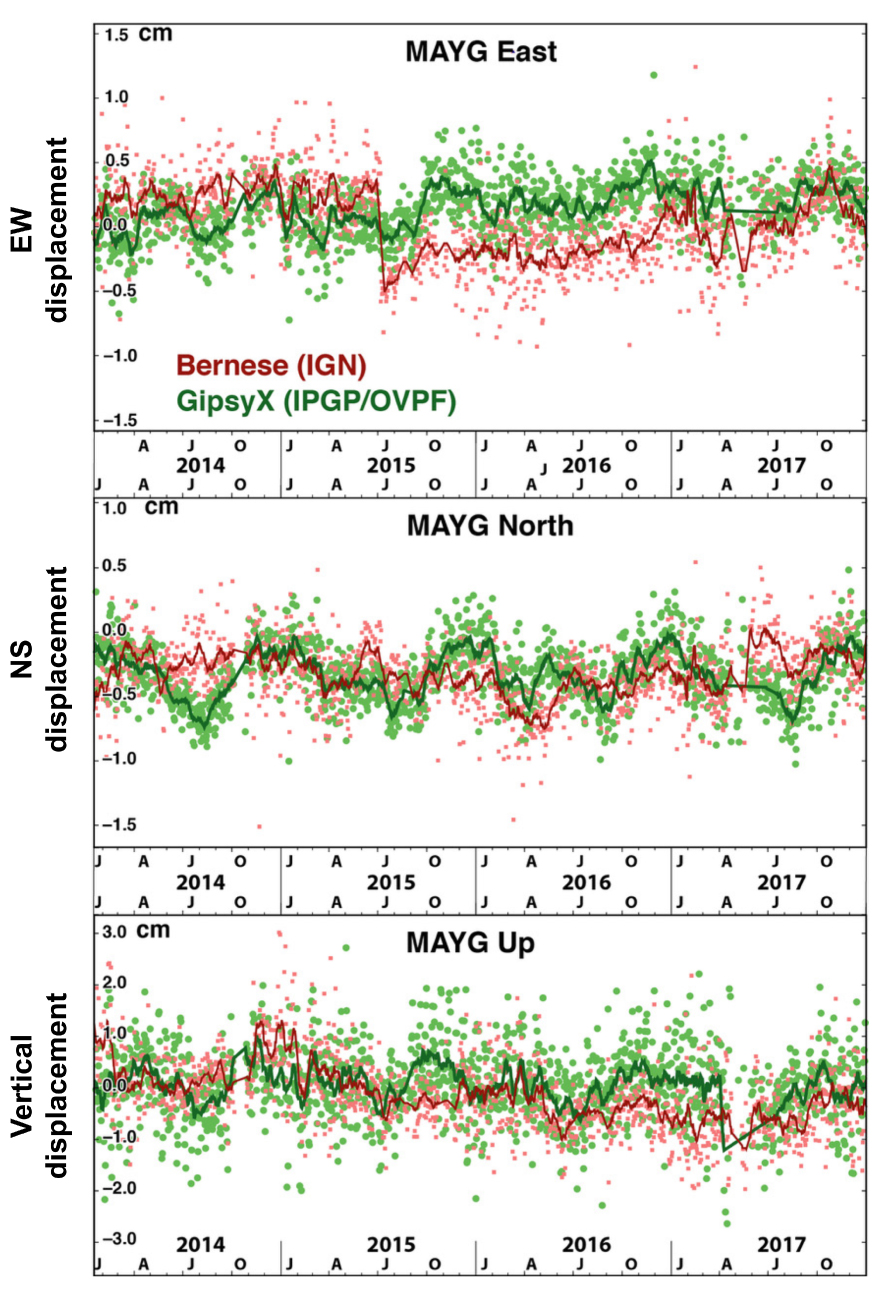
At first order, the time series are similar in terms of variations and noise (less than 10 mm), except a shift of about 8 mm in July 2015 visible on the east component of Bernese processing (due to the change of calculations in the IGb08 reference system, with the use of the associated antenna calibrations). The annual and semi-annual deformation due to redistribution of hydrological and atmospheric masses on the Earth surface are observed in both processing methods, with a slightly lower amplitude for the Bernese solution. The small differences of a few millimeters between the two solutions do not lead to significant differences in the deformation field given the large amplitude (decimetric) of the displacements recorded during the crisis. Therefore, the two GNSS solutions are equivalent for further modeling and interpretations. In the following, we use the time series of our GipsyX processing, which are used routinely by OVPF-IPGP for the 24/7 continuous and real-time monitoring of Mayotte.
4.2. Evolution of the time series
Shortly after the onset of the volcanic crisis in May 2018, anomalous displacements were detected from July 2018 by the GNSS network operating on Mayotte. Figure 5 shows the time series of eastward, northward and vertical ground displacements of the GNSS stations computed between January 1, 2017 and December, 31 2021.
Time series of daily solutions of eastward (top), northward (middle), and vertical (bottom) ground displacements as recorded by GNSS stations of Mayotte, Grande Glorieuse (GLOR), and Madagascar (DSUA, NOSY), between January 1, 2017 and December, 31 2021. Time series are not corrected from plate motion; the corrected time series are shown in Supplementary Material F. Shaded grey boxes highlight the periods with OBP measurements.
The GNSS time series show, from July 2018, an overall displacement of the island towards the east and a subsidence [Figures 5 and 6; Lemoine et al. 2020; Feuillet et al. 2021]. Cumulatively from July 1, 2018 to December 31, 2021, these horizontal displacements are approximately 21 to 25 cm eastward, and subsidence of approximately 10 to 19 cm depending on the site (Figure 5, Supplementary Material F). The cumulative horizontal displacements point towards the east, about 20 km offshore the Mayotte coast (Figure 6).
Ground displacements recorded on GNSS stations in Mayotte (a) between July 2018 and December 2020 with the stations available from the beginning of the crisis and (b) between June 2019 and December 2020 with all GNSS stations. The horizontal displacements are represented as velocities in vector form and the vertical displacement velocities are indicated by the numerical values in color (in mm/yr). Displacements are corrected from plate velocities. Black star indicates the eruption location. FaC stands for “Fer à Cheval”, an old structure where acoustic plumes are observed [REVOSIMA 2021].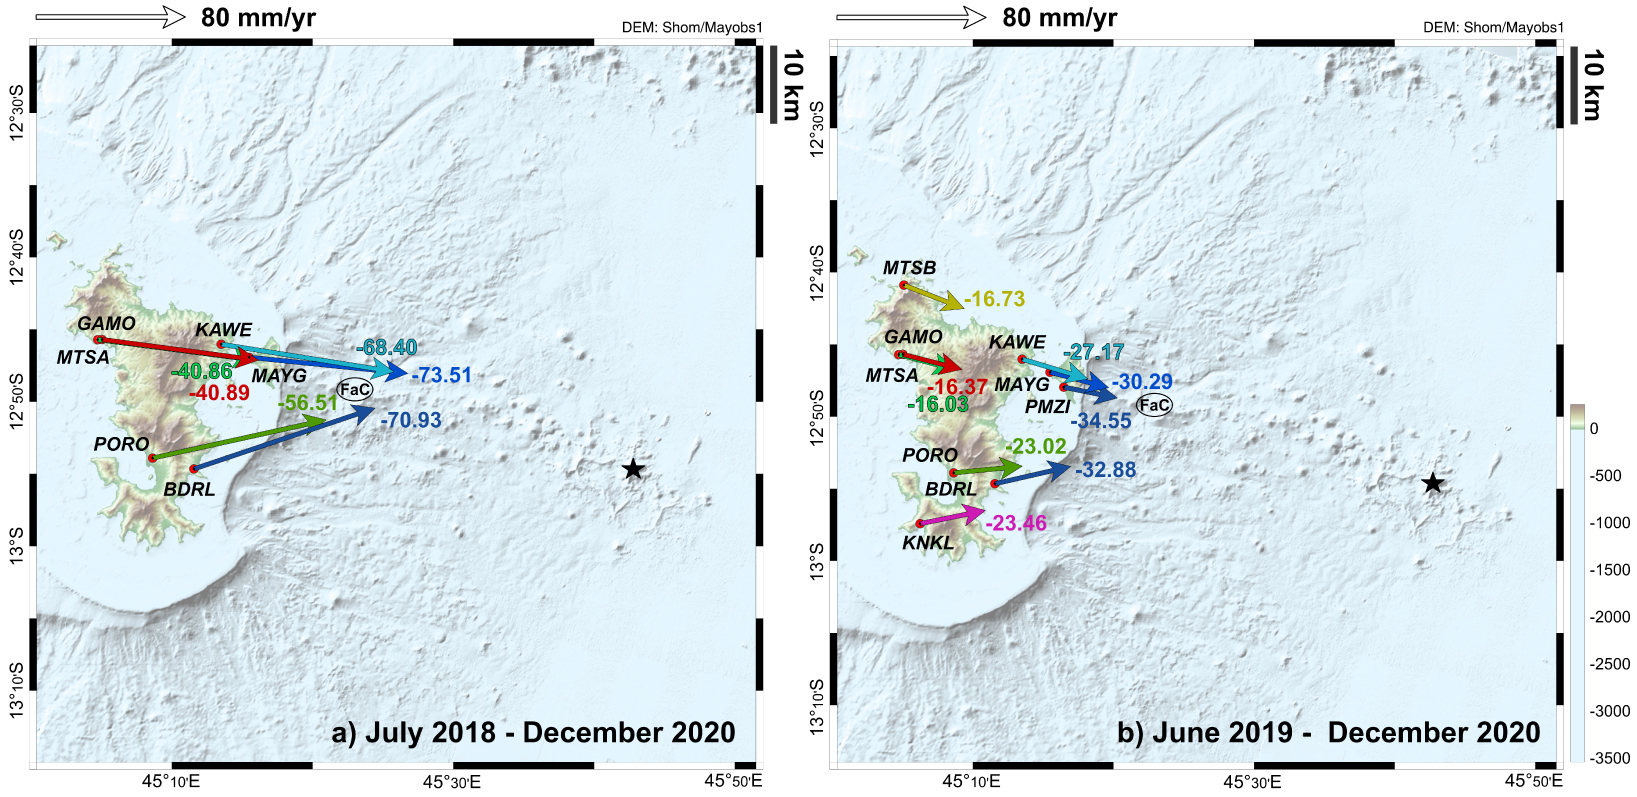
Around April–May 2019, a first slowdown in the trend is observed. Since 2020 movements slow down again and after March 2020 subsidence becomes negligible at several stations, e.g. MTSA, MTSB, PORO (Figure 5, Supplementary Material F). Then, since late 2020 the ground displacements have become so weak that they do not seem to emerge from the noise.
The velocity of MAYG, the only station with a long pre-crisis (4.5 years) time series, has returned, in the three components, to the one observed before 2018.
On the stations located east and south-east of the volcano, further away (more than 250 km), on Grande Glorieuse and Madagascar, no significant deformation has been recorded [Figure 5, Supplementary Material F; Bousquet et al. 2020]. However, in the medium and long term, the data of Grande Glorieuse, in particular, will be important to constrain the geodynamics at the scale of the Comoros archipelago.
5. Modeling
5.1. Gravity Recovery and Climate Experiment (GRACE) modeling
Continuous GNSS-derived land motion measurements in Mayotte are affected, in addition to any seismo-volcanic transient, by (a) steady tectonic plate motion and (b) seasonal variations due to spatio-temporal changes in continental surface water storage, both at local and continental scale. The signature of these processes in the GNSS time-series needs to be characterized to estimate the uncertainty involved in the subsequent inverse modeling of the source.
The area of Mayotte belongs to a diffuse plate boundary between the Somalia, Lwandle and Rovuma tectonic plates, characterized by a transtensional strain regime [Stamps et al. 2018; Famin et al. 2020]. Due to poor constraints on plate kinematic solutions in the area, we use the GNSS time-series at MAYG (available since 2014) to estimate the tectonic trend in Mayotte by fitting a linear regression on the horizontal components. This estimate is used for correcting plate motion at all stations in Mayotte, which implicitly assumes rigid motion and neglects rotation of the island.
After removing the estimated tectonic trend, a quasi-periodic signal is clearly visible in the detrended pre-crisis (2014–2018) time-series at MAYG (Figure 7a). Figures 7b and 7c show that this pre-crisis signal is dominated by a 1-year cyclicity, with a peak-to-peak 30-days sliding average displacement of 4 mm, 9 mm and 12 mm on the East, North and Up components, respectively. The signal is strongest on the vertical component, with peak downward displacement occurring in August, whereas peak upward displacement occurs in December. The north component shows a clear maximum southward displacement roughly in phase with the vertical, with a peak southward displacement occurring in August–September. Both the vertical and north components show a higher-order periodicity (i.e. fluctuations are not monochromatic), as reflected by a longer transition (8 months) between the upper peak (upwards, northwards, in December) and the lower peak (downwards, southwards, in August), and a shorter transition (4 months) toward the next upper peak (August to December).
(a) Displacements at GNSS station MAYG after removing tectonic trend (GipsyX processing). Each dot corresponds to the position on a 24 h epoch, colored as a function of time. (b) Colored dots: displacement at GNSS station MAYG (same as in (a), with enhanced Y -axis scaling); thick colored curve: 30-days running average of surface displacement at GNSS station MAYG; thin black line: monthly-predicted surface displacement deduced from Earth’s response to surface loads derived from satellite data of GRACE (2003–June 2017) and GRACE-FO (June 2018–2020) missions; blue curve: best-fitting periodic function adjusted on GRACE-derived predicted surface displacement (black line) using superposition of two harmonic functions with periods of 1 year and 0.5 years, respectively. Each component is adjusted independently. The time interval with available GNSS data prior to the onset of the volcanic crisis is highlighted with a white background. (c) same as (b), with a periodic X-axis scaling with duration of 1.0 year, starting from 1 January. GRACE-GRACE-FO M-SSA solution. (d) Mean rate of surface mass density variations from January 2003 to December 2021 expressed in equivalent water height (EWH) per year, given in cm/yr. (e) Mean annual surface mass density variations over the 2003–2021 period.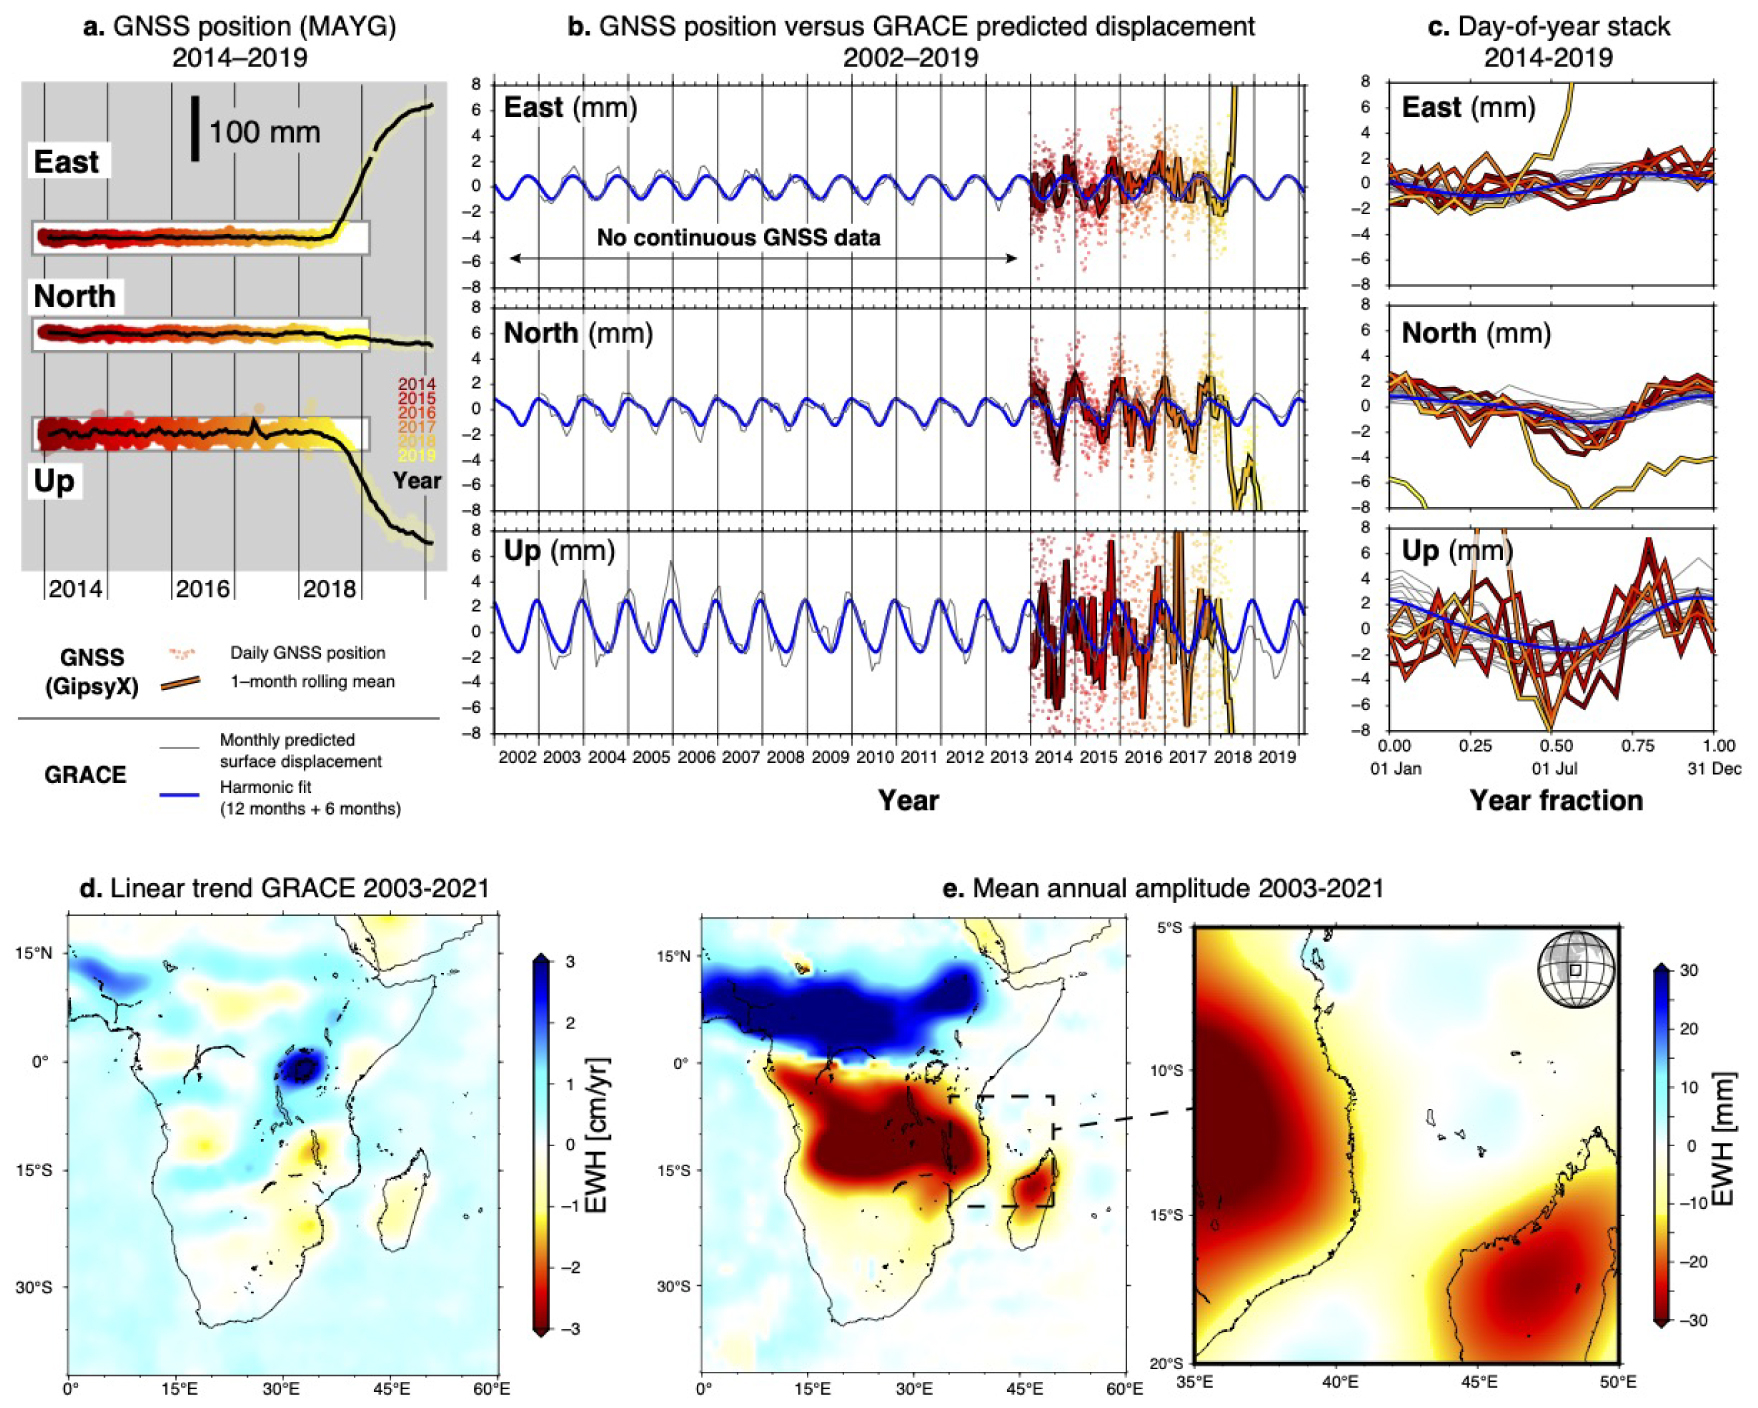
The seasonal fluctuations observed in the pre-crisis MAYG GNSS time-series are interpreted as the result of continental-scale (>1000 km) perturbations of the Earth shape caused by the continental hydrological cycle and external atmospheric forcing [Blewitt et al. 2001]. Surface displacements result from the spatially and temporally variable surface loads occurring at the Earth’s surface, convolved with the Earth’s deformation response [Tregoning et al. 2009]. Fluctuations typically manifest as periodic signals affecting the GNSS time-series, dominated by a seasonal term (annual), as well as higher-order harmonics.
To confirm the hydrological origin of the quasi-periodic signal visible in Mayotte, we use data from GRACE for the period, April 2002–June 2017 and current GRACE-Follow On (GRACE-FO) from June 2018-present missions. GRACE data provide monthly global measurements of the space and time varying Earth’s gravity field, monitoring changes in continental water storage, non-tidal oceanic and atmospheric loading (Figure 7). They can be used to constrain the hydrological source term, which can be subsequently fed into an Earth deformation modeling scheme. Yet, the high level of distinctive unphysical noise in a North–South striping pattern affecting the GRACE data, as well as the temporal gaps (including the long 11 months gap between GRACE and GRACE-FO missions) prevent the interpretation of long-term mass variations. Consequently, we use the Multi-Channel Singular Spectrum Analysis (MSSA) and utilise both spatial and temporal information contained in multiple Level-2 solutions of GRACE and GRACE-FO (CSR, GFZ, JPL, TU-GRAZ) detrended over the 2003–2021 period to fill the observational gaps and develop a data-driven spatio-temporal filter to enhance the data signal-to-noise ratio [Prevost et al. 2019]. Additionally, the non-observable degree-1 spherical harmonics geocenter gravity coefficients are estimated using the degree-1 deformation field inverted from a globally distributed GNSS network corrected for deformation of degree-2 and higher [Chanard et al. 2018]. Moreover C2,0 Earth oblateness and C3,0 gravity coefficients, which are difficult to observe due to the near polar orbit of the GRACE and GRACE-FO missions, are substituted with satellite laser ranging (SLR) observations according to Technical Note 14 [TN-14; Chen et al. 2005; Loomis et al. 2020]. We add back the atmospheric and non-tidal oceanic contributions to ensure comparison with the GNSS dataset.
Deformation induced by surface loads, decomposed in the temporal and spatial domains, on a spherical elastic layered Earth model [Dziewonski and Anderson 1981] is computed based on the Love number formalism [Farrell 1972; Chanard et al. 2018]. We model the elastic deformation resulting from variations in surface loading measured by the GRACE and GRACE-FO missions at the GNSS MAYG site in Mayotte (Figure 7b,c). Note that considering the large scale resolution of the GRACE and GRACE-FO measurements (∼300 km) compared to the Mayotte GNSS network distribution, the loading model predicts similar deformation at all sites and local effects at sites are not accounted for. The long wavelength annual deformation at all sites is consistent over the 18-year period considered, despite some inter-annual variability.
The agreement between the observed and predicted GNSS displacements at MAYG, mainly on the northward and vertical component, strongly suggests that the GNSS network of Mayotte is affected by quasi-periodic displacement perturbations induced by surface loads generated by surface water storage at regional and/or continental scale. As a result, surface displacements measured during the crisis are contaminated by similar fluctuations. Accordingly, the eastward displacement anomaly of volcanic origin dominates any seasonal fluctuation, and could be safely neglected if the objective was to determine the cumulative displacement affecting the island. The northward component shows a nearly equal partition between the volcanic signal (20 mm cumulated over ∼2 years) and the hydrological signal (9 mm peak-to-peak over <6 months). Since the hydrological perturbations are expected to produce a homogeneous effect at the scale of Mayotte, this signal will produce an apparent periodic north–south ∼9 mm translation of the whole GNSS network every ∼6 months. In other words, the cumulative displacement vectors on Mayotte are expected to be affected by a periodic rotation of 2.5° (peak-to-peak) in the horizontal plane.
In the simplest case where these rotations are uncorrected and incorrectly interpreted as resulting from a true motion of the source of volcanic deformation, the lever arm of ∼30 km between the network and the source implies that a 2.5° rotation of displacement vectors on-land will translate into an apparent 1.35 km mislocation of the source of deformation. The effect on the vertical uncertainty of the source location is expected to be slightly larger. Combining horizontal and vertical uncertainties results in an apparent source motion reaching ∼3 km, if hydrological load effects are not corrected, which can be considered negligible at first sight.
However, we note that due to higher harmonic components of the hydrological source term with time, these fluctuations can affect the deformation models on time scales as short as 3–4 months (the fastest transition occurs between August and December). We also note that, as the power of the volcanic signal decreases in the extracted vectors (e.g. when investigating the displacement over 6-months temporal windows or shorter, or when approaching the end of the volcanic crisis), the resulting uncertainty on the source location will significantly increase. The 3 km uncertainty reported above should therefore be considered as valid only for models relying on cumulative displacements calculated over time intervals longer than 1 year, and only until early 2020. Since mid-2020, as the volcanic signal has substantially waned, the resulting vector rotation caused by hydrologically-induced fluctuations can easily reach >30°, resulting in an uncertainty of >15 km on the north–south location of the source. This analysis illustrates the difficulty to determine the spatial characteristics of the source of volcanic deformation in Mayotte, as a result of a combination of (a) poor azimuthal coverage of the GNSS network and (b) existence of homogeneous fluctuations of the mean position of the network resulting from large-scale hydrological perturbations. This limitation equally applies if one considers, as here, a single pressure source (Mogi), or a more complex, distributed/multiple source.
5.2. Source modeling
Displacements subsequently measured from the beginning of the crisis were used to track the transport and storage of magmatic material offshore via numerical modeling.
5.2.1. First modeling
The first modeling of the deformation was carried out in October 2018, 4 months after the start of the deformation [Lemoine et al. 2020]. The data analyzed were those from the permanent stations available with the RGP at that time: MAYG, BDRL, GAMO and KAWE.
The GNSS time series exhibit a remarkable correlation between the east and the up components. There is also a correlation between east and north components, yet less remarkable for two reasons: (1) because the amplitudes of the north anomalies are small (the deformation source is located to the east of the island) with the uncorrected yearly fluctuations having a magnitude not small with respect to the tectonic signal, (2) because the observations indicate a small seasonal oscillation with time of the north signal.
The Table 1 summarizes the value of the scaling coefficient applied to correlate the east and up components and the root-mean-square (RMS) amplitude of the residual difference for the four stations.
Scaling coefficient applied to correlate the east and up components and the RMS amplitude of the residual difference for the four stations used in the first modeling
| Station | Scaling factor up | Residual (mm) | Pitch (°) | Scaling factor east | Residual (mm) | Azimuth (°N) |
|---|---|---|---|---|---|---|
| MAYG | 1.146 | 7.2 | 41 | 9.184 | 3 | 96.2 |
| BDRL | 1.321 | 7.2 | 37.1 | 3.065 | 3.5 | 71.9 |
| GAMO | 2.038 | 6.6 | 36.8 | 5.777 | 3.5 | 99.3 |
| KAWE | 1.339 | 6.6 | 26.1 | 6.137 | 3.9 | 97.5 |
In this first model, the source was a point source located within an elastic medium [Mogi 1958]. In this model the displacement vector points to the source. This means that we can use the azimuth and pitch angles derived from the above scaling factors to establish the location of the source. This method is expected to be robust and the RMS residuals will teach us about the consistency of the angles indicated by the four GNSS stations.
The best fitting source, recalculated since the first note distributed in October 2018 [Lemoine et al. 2020] by only integrating geometric constraints and not amplitude of the displacement, was found at longitude 45.504° east and latitude 12.81° south. This location of the source is located at 11 km west and 4 km south with respect to the source proposed by Lemoine et al. [2020], and at a depth of 24 km instead of 28 km in this previous study. The source is therefore significantly closer to the island, ∼12 km east of the Fer à Cheval [an old structure where acoustic plumes are observed; REVOSIMA 2021; see location in Figure 6] and 28 km north-west of the new volcano. At this location the seafloor is at 2300 m below sea level. The standard deviation of the pitch angles (1.86°) corresponds to an uncertainty of the determination of the source depth of 1.5 km.
5.2.2. Automatic processing and modeling
From mid November 2018, automatic and daily modeling of PPP solutions were set up at IPGP using the WebObs dedicated module “GNSS” [Beauducel et al. 2019, 2020a], in order to characterize the source of deformation and its evolution in real time. The characteristics of a single source (location, depth and volume variation), fitting the observations over a considered period of time, are modeled by a point source of isotropic pressure at depth, in a homogeneous and elastic medium [Mogi 1958], with topographic effect approximation using the varying-depth formulation [Williams and Wadge 1998]. These simple models are the most suitable, given the limitations caused by the current geometry of the geodetic measurement network, with stations mostly west of the source [REVOSIMA 2019]. The inversion method uses a grid-search approach and Bayesian expression of the model probability (calculated from the L1-norm misfit), in order to describe the full model space, i.e., all possible models and not only looking for the “best solution” [Tarantola 2006].
The system has been configured to process the data independently over several time intervals whose upper limit is always set to current time (real time): 6 months and 1 year sliding windows, and a cumulative window from a reference date before the eruption onset (January 1, 2018). For each time window, velocity trends are estimated at each station, and an inverse problem is computed to look for probable sources. Result is displayed as a probability density function plotted as 3D maps, showing also velocity vectors of observations, vectors computed from the best model, and associated residuals. The Bayesian approach allows us to express in a rational way the a posteriori uncertainty on the set of models proposed for each time period. The adequacy of the model with the observations can thus be quantified whatever the signal to noise ratio. This makes the method extremely robust and useful for real-time monitoring [Beauducel et al. 2019, 2020b]. Of course, if the data contain an additional signal related to a poor correction of potential artifacts (tectonic, hydrological or atmospheric for example) or simply to another unidentified phenomenon that produces a compatible deformation signal, even partially, with the model, the result of the inversion will be influenced. As in any modeling, the result will be all the more accurate if all the main sources have been taken into account in the direct problem.
Here, we use all the REVOSIMA stations, including Grande Glorieuse Island, and stations west of Madagascar for which the insignificant deformation signal in the far field also contributes to constrain the source location. We present modeling results obtained after the subtraction of a model accounting for part of non-volcanic seasonal variations (see Section 5.1), using a second-order harmonic fit, 1-year and 6-month sine waves, for which amplitude and phase are estimated from MAYG pre-eruptive time series for each component, equally applied on all the stations. This pre-processing reduces the possible biases previously discussed in Section 5.1, but we must consider that deformation induced by continental hydrology is certainly not purely periodic and may also exist at shorter time scales. As a consequence, some non-volcanic residuals may still affect the source modeling results, in particular when considering time windows shorter than 1 year and/or encompassing a non-integer number of years, and when the volcanic signal amplitude is weak, i.e., before July 2018 and after mid-2020.
In Figure 8, we present a selection of source inversion results from 2018 to 2021, as probability density functions of the source location in space, computed from a 1-year time window velocity trends estimated at each station (see corresponding parameters, and GNSS and calculated velocities for each best source in Table 2 and Supplementary Material G, respectively). First, we clearly see that all models indicate a deflating source located about 50 km east of Mayotte, at a depth around 40 km. But it is clear that determination of both the east–west location and depth of the source, due to the on-land network, is weak. Regarding the time evolution of the source parameters, during the years 2018 and 2019, the deflation corresponds to a volume variation of −2.6 ± 0.1 (km)3 and −2.5 ± 0.2 (km)3, respectively. This value decreases in amplitude to −0.5 ± 0.08 (km)3 in 2020, and becomes insignificant in 2021, while the inversion process still exhibits a slight indication of possible deflation, suggesting that the source is very weak but might be still active.
Source location estimated from GNSS Bayesian inversions for years 2018 to 2021, as normalized probability density functions in horizontal view and vertical profile, and associated velocity trends vectors with uncertainties. Also indicated the best sources determined from [Lemoine et al. 2020] (Cyan circle) and Section 5.2.1 of this study (Magenta circle). Black star indicates the eruption location. Numerical values are reported in Table 2. 2019-02-25 to 2020-05-10 earthquakes relocated by Saurel et al. [2022] are plotted as black dots (rounded to the nearest km).
Best source parameters obtained from modeling of GNSS data on 1-year time windows (full year from January 1 to December 31) from 2018 to 2021 (see Figure 8). Comparison of source parameters on the OBP first campaign (March 1 to May 5, 2019) using GNSS and GNSS + OBP data (see Figure 10). Uncertainty intervals are given for 1 sigma
| GNSS 1-year time window | OBP first campaign | |||||
|---|---|---|---|---|---|---|
| 2018 | 2019 | 2020 | 2021 | GNSS only | GNSS + OBP | |
| Latitude N (°) | −12.82 ± 0.04 | −12.83 ± 0.04 | −12.92 ± 0.04 | −13.09 ± 0.3 | −12.83 ± 0.04 | −12.82 ± 0.04 |
| Longitude E (°) | 45.74 ± 0.08 | 45.70 ± 0.04 | 45.61 ± 0.05 | 45.66 ± 0.3 | 45.96 ± 0.08 | 46.09 ± 0.04 |
| Depth (km) | 39 ± 2 | 41 ± 2 | 43 ± 4 | 20 ± 15 | 41 ± 4 | 51 ± 3 |
| 𝛥V (109 m3) | −2.6 ± 0.2 | −2.5 ± 0.3 | −0.5 ± 0.1 | −0.06 ± 0.2 | −1.3 ± 0.2 | −1.8 ± 0.2 |
In order to follow the possible source characteristics in time, we employ a novel method to compute the time-dependent effusion rate from deformation [Beauducel et al. 2020a; Mittal et al. 2022]. Magma reservoir source location and associated volume variation are computed for a 3-month sliding time window from January 2018 to December 2021, with a 7-day step. For each time window, the linear trend in displacement velocities is estimated from the GNSS data daily solutions previously corrected from tectonic and hydrological loading. The best solution is computed using a Bayesian inversion in the same conditions as the 1-year modeling performed previously. The method produces a time series of source parameters, more easily comparable to other observables and better suited for monitoring. The result is presented in Figure 9; the source flow rate amplitude varies from low values until July 2018, then increases to a maximum of −357 ± 60 m3∕s in average during December 2018 and January 2019, and decreases slowly until 2021, at insignificant values (average of −5 ± 7 m3∕s for the 2021 full year).
Time evolution of the source flow rate computed from inversion of GNSS velocity trends estimated on a 90-day causal sliding window. Uncertainty intervals on the flow rate (dark and light red areas) stands for 1 and 2 sigmas, respectively. Flow rates estimated from joint inversion modeling of GNSS + OBP data for the 5 periods of OBP deployment through successive MAYOBS campaigns (green lines, vertical segment stands for 1 sigma uncertainty).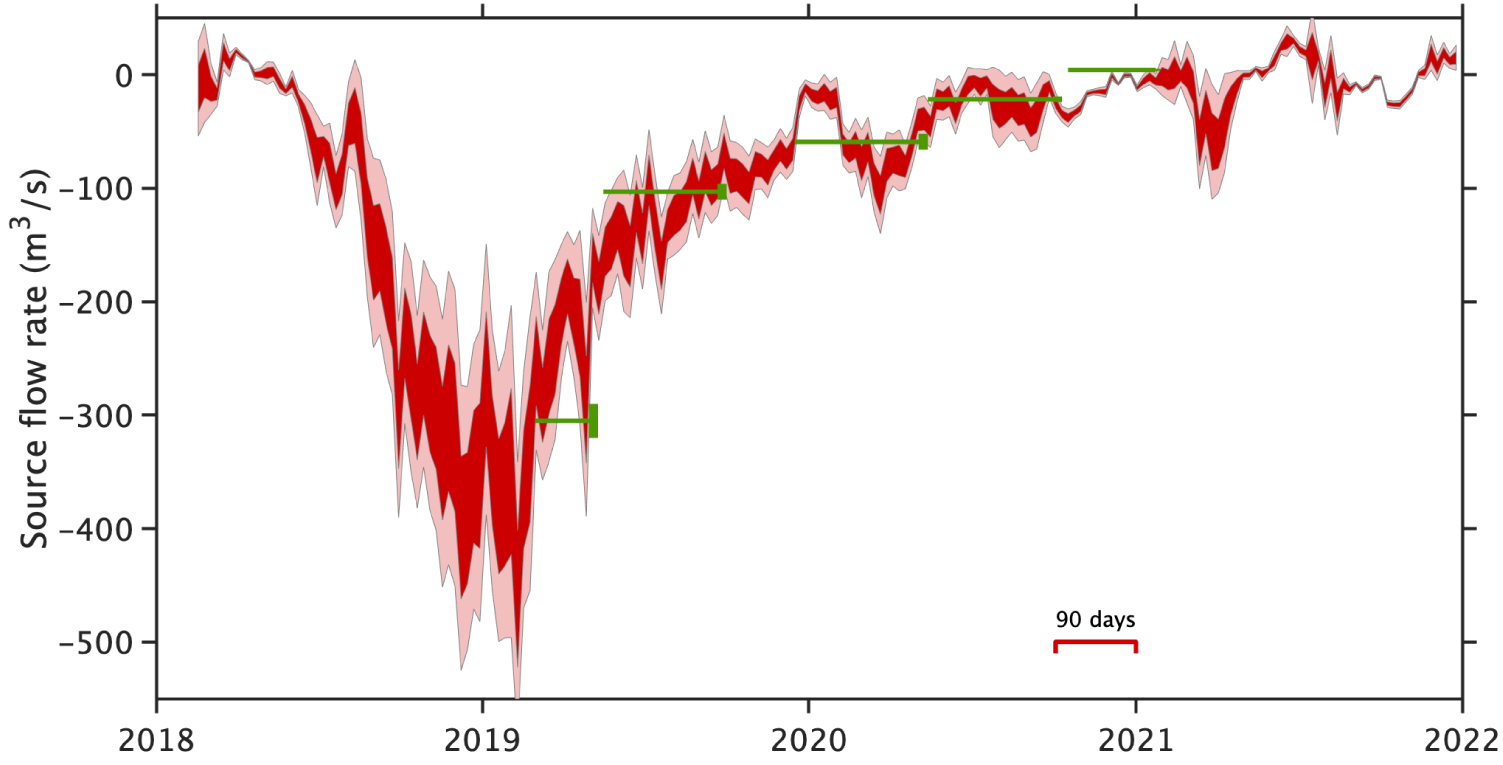
5.2.3. Joint modeling of GNSS and OBP observations
The situation in Mayotte is a textbook case of the difficulty of characterizing a deformation source with an inadequate geodetic network. We believe that Bayesian inversion is probably the best and most robust approach to quantify the a posteriori uncertainties associated with such a network inadequacy. One of the main weaknesses of the GNSS network is the lack of near-field observations due to the offshore location of the source, thus pressure gauges should provide an essential complement to improve the inversion results.
Comparison of source modeling location, in map view and along an E–W vertical cross section, as probability density levels using only GNSS data (blue contours) and using both GNSS and OBP data (red contours) recovered during the OBP first campaign (March 1 to May 5, 2019). GNSS stations (blue triangles), OBP stations (green circles), velocity trends and associated uncertainties (black arrows and ellipses), eruption location (black star) are shown. Pressure gauge data have been corrected from tides and oceanic signals and contain only the vertical component of displacement.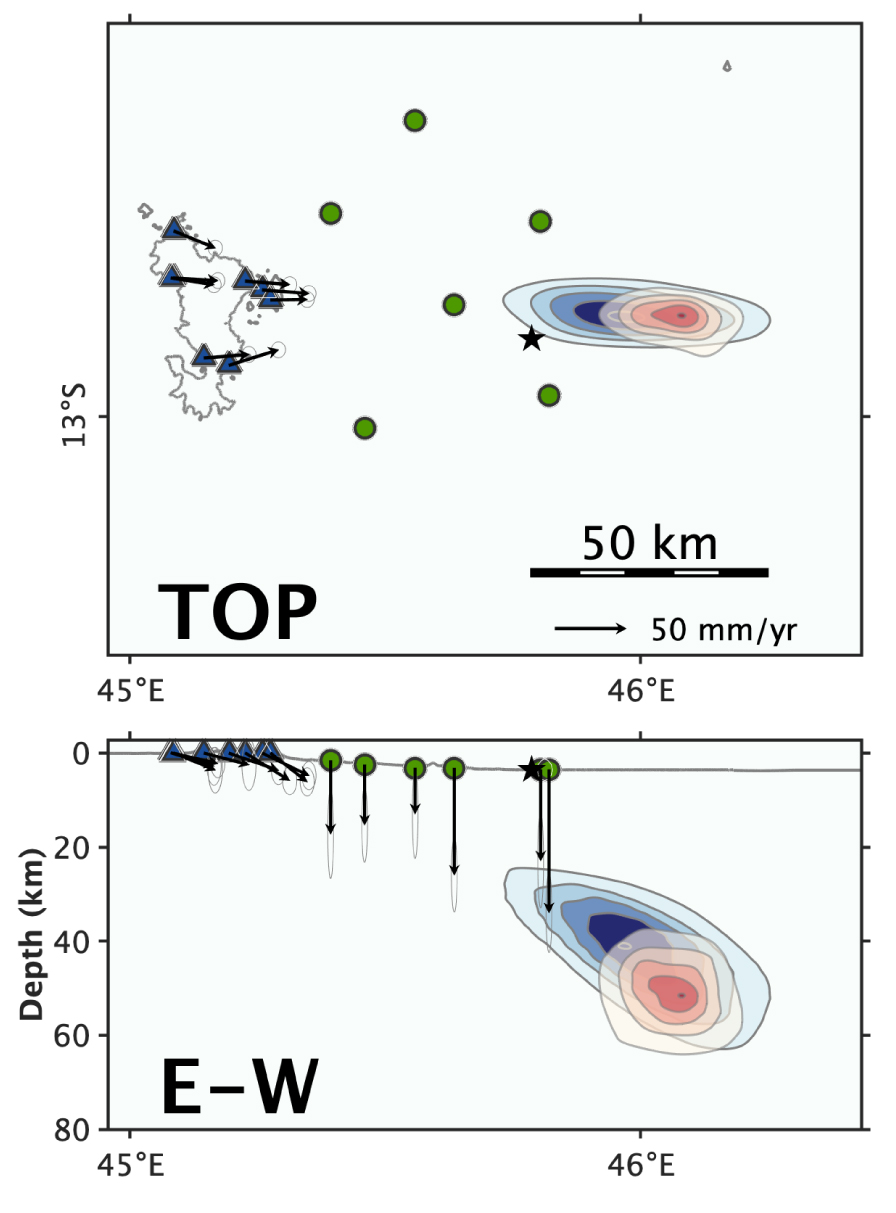
In Figure 10, we present the contribution of pressure gauge data to the source modeling, showing the original probability density function when using GNSS data only, and the probability density function when using both GNSS and OBP data recovered during the March 1 to May 5, 2019 period. It is clearly demonstrated that additional observations near the source, even with large a priori uncertainties, improve the source location determination with lower a posteriori uncertainty, while still remaining within the initial location area of probable models. The source obtained from the joint inversion is a little deeper and associated with a slightly larger deflation volume variation (see Table 2). We show in Supplementary Material H the results for each period of OBP deployment from 2019 to 2021.
In Figure 11 and Supplementary Material H, we present the best model fit in a velocity versus distance from source graph, showing the relatively acceptable adjustment of the OBP data at short distance from the source, while maintaining a very good adjustment of all GNSS data at larger distances. We also computed in Figure 9 flow rates from the best models obtained by the joint inversion of OBP and GNSS for each period of OBP deployment (Figure 10; Supplementary Material H).
Best source modeling from joint inversion of GNSS and OBP data recovered during the OBP first campaign (March 1 to May 5, 2019), displayed as horizontal and vertical velocities versus distance from source. GNSS data and uncertainties (blue triangles), OBP data and uncertainties (green circles), predicted isotropic model with topography (red area) are shown. Pressure gauge data have been corrected from tides and oceanic signals.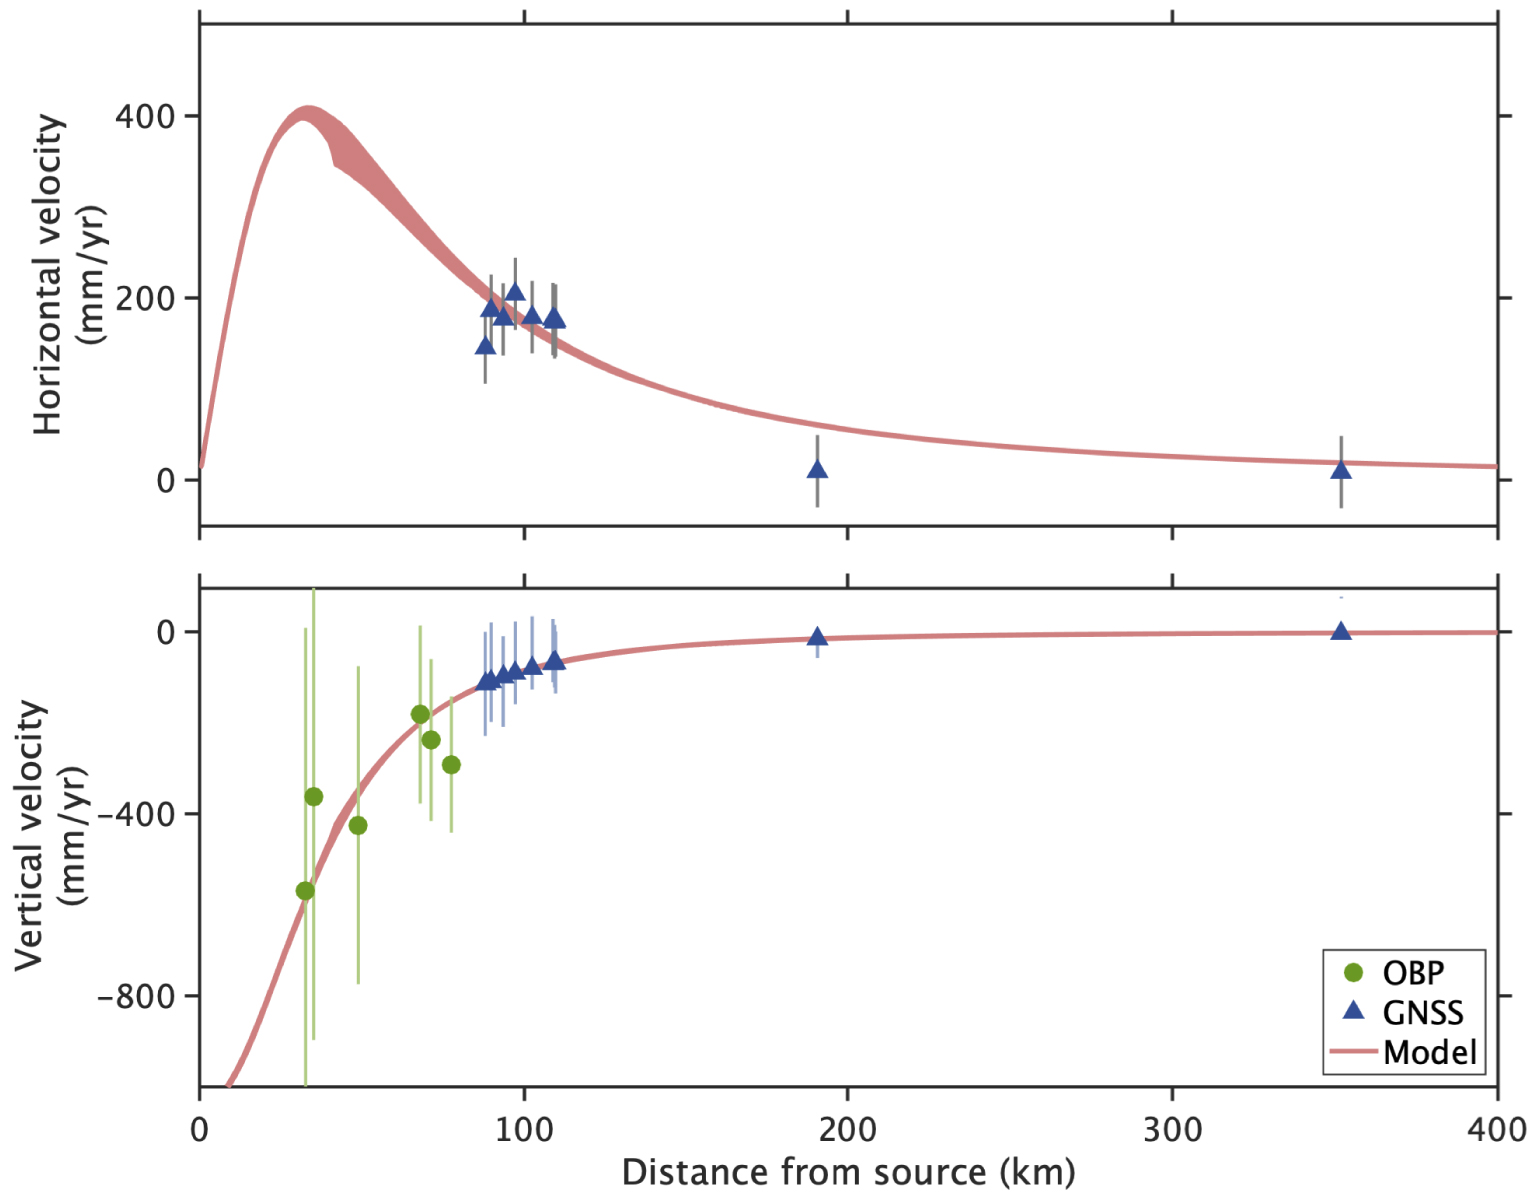
6. Discussion and conclusions
6.1. Contribution of GNSS in the scientific response to the crisis
The GNSS method had a major role in the discovery of the magmatic origin of the seismic crisis that started in Mayotte in May 2018, and thus in the discovery of the submarine eruption 50 km offshore Mayotte in May 2019. It is thanks to the detection of anomalies in the ground deformation pattern of the GNSS stations of Mayotte in July 2018 that IGN issued a warning in the RGP web portal, and that the hypothesis of the magmatic origin of the seismic crisis could be confirmed as early as October 2018 when the first modeling of surface displacements recorded on 4 GNSS stations on Mayotte showed a deflation source at 45 ± 5 km east of Mayotte center and 28 km depth [Figure 8, Lemoine et al. 2020].
This demonstrates the technical and scientific contribution of: (1) IGN within the French higher education and research consortium, with their deployment and/or supervision of GNSS stations in the geologically active zones of all the national French territory including the overseas territories, and more particularly where no permanent volcano observatories are implemented, as it is the case in Mayotte, and (2) the use of best practice and tools developed into national volcano observatories, which can be easily and quickly implemented into any context.
GNSS continues to have a crucial role in the follow up, understanding and modeling of the time evolution of the submarine eruptive activity offshore Mayotte and of the magmatic activity in depth. Thanks to the rapid implementation of the WebObs tool [Beauducel et al. 2020a], more complex and automatic models have been quickly implemented, in particular for monitoring the source flow rate in near real-time (Figure 9), which is a crucial parameter for scientific response to the crisis and for which there are no real-time continuous visual constraints in the case of a submarine volcano. This parameter was a proxy of the eruptive activity and allowed an accurate tracking of the activity state of the volcano. GNSS data and modeling are thus of great interest in the scientific crisis management with local authorities and are part of the regular information bulletins (daily and monthly) of REVOSIMA [2019, 2020, 2021].
6.2. Evolution of ground deformation between 2018 and 2021
A maximum of about 25 cm of cumulative eastern on-land ground displacement and a maximum of about 19 cm of subsidence had been recorded between July 2018 and end of 2020. Since then, no more ground deformation seems to be detectable on Mayotte. This observation and the decrease in the flux deduced from inversion of ground deformation (Figure 9) are in agreement with the flux estimated by bathymetric survey that decrease from 172–181 m3∕s the first year to less than 11 m3∕s at the end of 2020 [Deplus et al. 2019; REVOSIMA 2021]. Since January 2021, no more new lava flows with thickness more than 10 m have been detected [REVOSIMA 2021].
The sources modeled with all available data are located to the east and near/below the distal seismic swarm, which extends in the direction of the eruption [Figure 8, Bertil et al. 2021; Cesca et al. 2020; Lavayssière et al. 2022; Lemoine et al. 2020; Feuillet et al. 2021; Retailleau et al. 2022; REVOSIMA 2019; Saurel et al. 2022; Mercury et al. 2022]. A migration of the deformation source over time to the west and to a greater depth, more or less parallel to the seismic swarm, seems to occur. However, it is compelling to note that the dispersion of the models increased over time, as the signal to noise ratio decreased.
Previous studies mainly based on seismicity, petrology and data from oceanic cruises proposed a complex magma plumbing system feeding the eruption [Cesca et al. 2020; Berthod et al. 2021; Feuillet et al. 2021; Foix et al. 2021; Lavayssière et al. 2022; Mittal et al. 2022], with a main deep magma reservoir (40 to 70 km depth depending of the studies) below the Fer à Cheval, 30 km west of the eruption, and a magma conduit starting from this reservoir to fed the eruptive site. Some studies also proposed intermediates shallower reservoirs [e.g. Berthod et al. 2021; Lavayssière et al. 2022] and porous mush adjacent to the main reservoir [Mittal et al. 2022]. The complexity of the magma plumbing system may partly explain the dispersion of the results of our inversions, as several sources can be active at the same time or, on the contrary, some parts of the complex and extended magma system are not active at the same time. With the configuration of the GNSS network it is difficult to discriminate the effect of several sources. A single source, as modeled in this paper, is certainly an integration of the influence of this whole system that could also be refilled by deeper magma at the same time it was draining to fed the eruption. Over time and with the decline of the eruptive activity, the activation of the shallowest part of the magma feeding system was certainly less visible on the distant ground deformation recorded on-land.
Berthod et al. [2021, 2022] propose several changes in the feeding system during the eruption, with direct feeding from a deep mantle lithospheric reservoir during the first year of the eruption and the involvement of shallower magma batches later. This change revealed by lava petrology would have occurred only close to the eruptive site, as the eruptive activity migrated close to the main volcano edifice, 6 km to the north-west [Deplus et al. 2019; REVOSIMA 2021], and probably did not influence the ground displacements recorded on-land in Mayotte.
Part of the vector rotation, and the migration of the source to the south observed between 2018 and 2021 could also be explained by a tectonic residue. Supplementary Material I shows the source inversion results from 2018 to 2021, as on Figure 8 but using a tectonic trend correction of +21.20 mm/yr east and +12.5 mm/yr north. This correction minimizes the northern residual for 2021, but does not change the source location from 2018 to 2020. This may be related to the uncertainty of the tectonic correction or to the existence of a new source of deformation in 2021 (magmatic or tectonic signal not clearly identified).
6.3. Limits of the models
The estimated depth of the modeled sources of deformation ranges from 20 km to 50 km in the oceanic lithospheric upper mantle. At such depth and over years of deformation, the linear elasticity assumption could be invalid, but hopefully with a limited bias at short-time scale.
Nevertheless, we have chosen to keep the use of a simple rheology (elastic and homogeneous medium) because of the limited data quality and the necessity to propose a first-order model of the source. Also, our automatic model processing was already operational, validated on other volcanoes, and quick to set up for the scientific crisis management (see previous section). Even if the estimation of magma volumes and rates, and the exact position of the magma sources could be biasing by the use of an elastic rheology, it allows us to quickly constraint at a first order the source.
In any case, it is rare in volcano contexts to detect geodetic signals of lithospheric source and even more on such length- and time-scales, further detailed studies on these data could be done to better understand, for example, the rheological properties (and layering) of the oceanic crust (intermediate-lower crust) and oceanic upper mantle in this area.
6.4. Limits of the current network and recommendations
The source of deformation is located far from the island of Mayotte (>40 km of the Mayotte center) under the oceanic crust, so that the network on-land alone is too distant and poorly distributed—mainly west of the source—to efficiently constrain its precise location, its shape and the possible involvement of several sources.
All the GNSS stations added during the crisis improved the redundancy of the network, but did not substantially improve the resolution since they remained located west of the source and installed 8 months after the first signs of ground deformation in Mayotte. The additional observations closer to the source from OBP improves the source location determination (Figure 10). Improving the ability to characterize the source of deformation, in such a context (submarine eruption far from the coast), would require thus complementing available GNSS stations with other types of instruments:
- more pressure gauges as close as possible to the supposed source (to capture the maximum amplitude of subsidence above the source) and surrounding the source (to reduce the azimuthal gap), and this from the beginning of the crisis when the deformation was still significant. Even if these data are not real time, they are useful to better constrain the source a posteriori (Figure 10, Supplementary Material H). However, exploiting OBP data for seafloor deformation monitoring is still challenging due to several factors including the instrumental drift and the oceanic variations. The emerging generation of angle of attack (AOA) type of sensors offers new opportunities to reduce the impact of instrumental drift and thus increase our ability to monitor slow seafloor motion. In the case of low deformation rates (as it is the case for the latter period in the Mayotte crisis), the usefulness of OBP observations highly relies on our ability to accurately correct the oceanic contribution to the signal. Further studies based on regional modeling approaches and ancillary co-located data (e.g. CTD mooring or glider transects) should be carried out in order to reduce the associated uncertainties and thus improve the detectability of low rate seafloor deformations.
- gravimeters on Mayotte to detect mass transfer,
- borehole tiltmeters on Mayotte to detect subtle slope variations.
Data availability statement
IGN supports the REVOSIMA by making the server infrastructure of the RGP available for gathering and distributing GNSS data, metadata and products to the national and international scientific communities, and by coordinating the geodetic field operations in Mayotte. Since May 2018, the operativeness of the RGP has allowed the continuous GNSS monitoring of the crisis.
The technical infrastructure, located in the premises of IGN data center in Saint-Mandé (France), consists mainly of two collection servers that ensure the gathering of the raw observation data by FTP protocol, and one distribution server for data access by users: ftp://rgpdata.ign.fr. Between the reception and the distribution, the following tasks are performed on the observation data:
- files are converted into the RINEX format and renamed according to the standard,
- a quality check is performed to guarantee the usability of the data and to provide quality metadata,
- derivative files are produced if needed, such as sub-sampling from 1 s to 30 s sampling rate and concatenation of hourly file info daily files.
Whatever the type and configuration of the different GNSS receivers, all files are made available in a common and standard format and naming. The folder tree on the distribution server allows users to simply locate the needed files, which enables automation of file search and download. For instance, the generic file path for a 30 s daily RINEX 2 observation file for the station MAYG and for the 152nd day of 2021 will thus be 2021/152/data_30/mayg1520.21d.Z.
The principles used for the data distribution comply with the guidelines of the IGS.
Station metadata are available under the standard sitelog format of the IGS in the “stations” folder on the FTP server. This format records in a human-readable manner, the main characteristics of the station and relevant information about the GNSS equipment installed.
All the data from the RGP stations (MAYG, BDRL, GAMO, KAWE) are distributed under the French open data license ETALAB, compatible with the CC-BY 3.0 license, as well as GNSS products and station metadata. Data from the stations that were installed in the frame of the REVOSIMA (KNKL, PMZI, MTSB and GLOR) are distributed under CC-BY 4.0 license (Supplementary Material A). Data from stations MTSA and PORO is owned by the Réseau Lél@ and its distribution is restricted to the scientific community.
Data access is made using the FTP protocol in the server ftp://rgpdata.ign.fr. Products and metadata are freely available for any user using an anonymous connection, in the folders “produits” and “stations” respectively. Access to the observation files requires authentication using credentials provided on demand at mayotte.gnss@ign.fr for scientific use.
A dedicated web site (http://mayotte.gnss.fr/) gathers the various information about the GNSS monitoring of the REVOSIMA. Observations and trends are also accessible in the monthly (https://www.ipgp.fr/fr/revosima/actualites-reseau; ISSN 2680-1205) and daily (http://volcano.ipgp.fr/mayotte/Bulletin_quotidien/bulletin.html) bulletins from REVOSIMA.
Conflicts of interest
Authors have no conflict of interest to declare.
Acknowledgements
Since June 2019, monitoring of Mayotte eruption is funded by Ministère de l’Enseignement Supérieur, de la Recherche et de l’Innovation (MESRI), Ministère de la Transition Ecologique (MTE) and Ministère des Outremers (MOM) with the support of Ministère de l’Intérieur (MI) and Ministère des Armées (MINARM) through the REVOSIMA (Réseau de surveillance volcanologique et sismologique de Mayotte). Data shown on this paper have been acquired, processed and modeled in the framework of the REVOSIMA, https://doi.org/10.18715/MAYOTTE.REVOSIMA.
The most recent GNSS stations installed on Mayotte and Grande Glorieuse (KNKL, PMZI, MTSB, GLOR) have been funded by the French state via dedicated funding specially released by INSU-CNRS (Institut national des sciences de l’univers—Centre national de la recherche scientifique) after the beginning of the Mayotte seismic crisis. The temporary GNSS stations deployed on the three sites of Mayotte in 2019, before their perpetuation, came from the GPSmob from Résif-Epos. Résif-Epos is a Research Infrastructure (RI) managed by the CNRS-INSU. It is a consortium of eighteen French research organisations and institutions, included in the roadmap of the Ministère de l’Enseignement Supérieur, de la Recherche et de l’Innovation. Résif-Epos RI is also supported by the Ministère de la Transition Ecologique. The stations NOSY and DSUA were installed by the LACy laboratory (Université de La Réunion) in the framework of the INTERREG-5 Océan Indien 2014–2020 « ReNovRisk Cyclones et Changement Climatique » project, funded by the Europe, Région Réunion and the French state [Bousquet et al. 2020].
The station MAYG is part of the REGINA network funded by CNES and co-operated by CNES and IGN (https://regina.cnes.fr/en/general-presentation). The stations BDRL and GAMO, belonging to the TERIA network, are owned and operated by the Exagone company (https://www.reseau-teria.com/language/en/teria-network/). The stations KAWE, MTSA and PORO, belonging to the Réseau Lél@ network, are owned and operated by the Precision Topo company (http://www.reseau-lela.com and https://precision-topo.com/). The seafloor data were collected using SBE 37 pressure sensors belonging to the DT-INSU oceanographic facility.
We thank the chief scientists of the MAYOBS1 to MAYOBS21 cruises (DOI: 10.18142/291), Emmanuel Rinnert, Nathalie Feuillet, Yves Fouquet, Stephan Jorry, Isabelle Thinon, Elodie Lebas, Pierre Guyavarch, for the organization of the surveys at sea.
The three anonymous reviewers and the editors are thanked for their constructive and insightful reviews.