


 CC-BY 4.0
1. Introduction
The soundscape of the oceans has changed greatly since the industrial revolution and has become a growing field of research [Duarte et al. 2021]. Sound propagates well underwater and transmits information efficiently over great distances. Mooring acoustic recorders in the Sound Fixing and Ranging (SOFAR) channel greatly expands their detection range, since the SOFAR acts as an acoustic waveguide carrying sounds over thousands of kilometers [Fox et al. 2001]. Networks of moored autonomous hydrophones (AuHs) can thus be an efficient way to monitor oceanic sound sources such as earthquakes and submarine volcanic eruptions, marine mammals, iceberg cracking, sea-state, as well as ship noise [e.g. Royer et al. 2015]. A moored AuH array unveiled the first detailed spatial and temporal distribution of seismicity along the central Mid-Atlantic Ridge [Smith et al. 2003]. The Sound Surveillance System (SOSUS), a US Navy hydrophone array deployed for anti-submarine warfare during the Cold War, has been used for three decades now to detect seismic and volcanic activity in the Northeast Pacific Ocean [Dziak et al. 2011]. For nearly 20 years, the laboratory Geo-Ocean has been maintaining hydroacoustic networks in the open ocean. Among them, the OHASISBIO network in the southern Indian Ocean, with 7 to 9 distant AuHs, has been monitoring the seismic and volcanic activity of the three Indian spreading ridges, as well as the presence and migration patterns of large whales, and oceanic ambient noise in general, since 2010 [e.g. Royer et al. 2015]. Analyses of hydroacoustic event clusters can also reveal the relative contribution of tectonic and volcanic activities associated with seafloor spreading along the Southwest Indian Ridge [Ingale et al. 2021].
One of the biggest challenges in monitoring underwater volcanoes is the fact that the eruptive activity is not as visible as on land. Furthermore, accessing real-time data, easy and common on land, is much more complex in a marine environment. Several early studies have evidenced submarine volcanic activity from hydroacoustic T-waves recorded by island or coastal seismic stations, corresponding to the conversion of hydroacoustic waves to seismic waves on island slopes [e.g. Talandier and Okal 1998, Reymond et al. 2003]. The SOSUS array detected two major eruptive episodes along the northern Gorda Ridge in 1996 [Fox and Dziak 1998] and Axial Volcano in 1998 [Dziak and Fox 1999]. Chadwick et al. [2008] reported the first simultaneous hydroacoustic and video recordings of an active submarine volcanic eruption in the Mariana Arc (Rota-1 Volcano). Sounds from that shallow eruption, in the form of continuous gas-driven lava fragmentation, were captured in 2006 by a portable AuH at a distance of 40 m from the vent, at 530 m b.s.l. Few years later, Resing et al. [2011] documented explosive magmatic degassing at the Hades and Prometheus vents on West Mata Volcano at 1200 m b.s.l., within the NE Lau Basin, again with simultaneous AuH and video recordings. Since these first observations, the use of hydroacoustic arrays to monitor underwater volcanoes has developed and expanded [e.g. Dziak et al. 2015]. For instance, Axial Seamount, the most active submarine volcano in the NE Pacific [e.g. Chadwick et al. 2016], now hosts the world’s first underwater volcano observatory, at a node of the OOI (Ocean Observatories Initiative, www.oceanobservatories.org) regional cabled array (RCA).
Ocean Bottom Seismometers (OBS) and hydrophones have also sometimes detected water-borne acoustic phases associated with submarine eruptions, but either related to explosions or implosions during lava flow emplacement on the seafloor. For instance, during the 2015 eruption at Axial Seamount, OOI seismometers detected tens of thousands of impulsive signals near the lava flows while they were being emplaced [Wilcock et al. 2016, Caplan-Auerbach et al. 2017, Le Saout et al. 2020]. Moreover, Chadwick et al. [2016] observed numerous explosion pits on the 2015 lava flow field and, hence, regarded the impulsive signals as resulting from steam bursts as lava drained out of individual lava lobes beneath a solidified crust. Similar signals were also recorded along the East Pacific Rise at 9° 50′ N [Tan et al. 2016] and on the Gakkel ridge [Schlindwein et al. 2005, Schlindwein and Riedel 2010] suggesting that these types of impulsive sounds may be common during submarine eruptions. Hence, one of the main goals of this study is to determine whether similar hydroacoustic processes have occurred during the Mayotte eruption.
2. Geological setting
Mayotte is a volcanic island of the Comoros Archipelago, located in the northern part of the Mozambique Channel, between Africa and Madagascar [Michon 2016]. Although there is still debate about its origin and its geodynamic setting, observations indicate that the archipelago was formed by intraplate volcanism either on a ∼150 Ma old oceanic crust [e.g. Talwani 1962, Davis et al. 2016, Phethean et al. 2016, Leroux et al. 2020, Vormann et al. 2020], or on a thin continental crust [e.g. Flower 1972, Roach et al. 2017, Dofal et al. 2021], overlain by a thick sedimentary cover. Near Mayotte, the sedimentary cover reaches a thickness estimated at 1 to 2 km [Coffin et al. 1986], and more recently, at up to 3 km under the new eruption site [Masquelet et al. 2022]. From multichannel seismic reflection profiles, Malod et al. [1991] identified N130° E trending structures within the Comoros Basin that are parallel to the movement of Madagascar with respect to the African Plate. These structures are compatible with linear features highlighted in recently re-processed gravity data and orthogonal to the regional magnetic anomalies [Phethean et al. 2016]. From newly acquired marine geophysical datasets, Thinon et al. [2022] show that the recent volcanic and tectonic deformation fits with the fossil oceanic crustal fabric in the western part of the Comoros Archipelago. It is also consistent either with a current regional transpression along an immature and dextral Somalia–Lwandle plate boundary [Famin et al. 2020] or a transtension in between the East African rifts and Malagasy graben [Feuillet et al. 2021].
3. Volcanological and seismological monitoring of a new submarine volcano
Since 10/05/2018, Mayotte Island has experienced intense seismicity [Cesca et al. 2020, Lemoine et al. 2020, Saurel et al. 2021]. The first monitoring cruise was carried out a year later in May 2019, after the onset of the seismic activity, MAYOBS1 [Feuillet 2019]. It revealed that these seismic events were linked to the birth of a 820 m tall and 5 km wide new volcanic edifice (NVE), whose summit reached 2800 m b.s.l. [Feuillet et al. 2021]. Several radial ridges, up to 5 km in length, grew around the summit, giving the edifice a starfish shape. Feuillet et al. [2021] estimated the volume of material that erupted to be at least 5 km3. It is the largest historical submarine eruption ever observed. As of September 2021, twenty other monitoring cruises have followed MAYOBS1 to investigate the volcanic and seismic activity offshore Mayotte [REVOSIMA 2021a, Rinnert et al. 2019]. A combination of on-land seismic stations and OBS have recorded the seismicity since March 2019 [Saurel et al. 2021]. The seismicity forms two clusters: (i) a proximal one located 10 km east of Mayotte and (ii) a distal one situated between the proximal one and the NVE [Cesca et al. 2020, Lemoine et al. 2020, Feuillet et al. 2021, Lavayssière et al. 2021, Saurel et al. 2021, Retailleau et al. 2022]. The seismic events within these two clusters occur between 25 and 50 km depth, with only very few shallow earthquakes detected.
The submarine volcanic activity has been monitored by repeated ship-borne multibeam bathymetric surveys. Bathymetric differences between successive surveys (from MAYOBS1 to MAYOBS21) allow the documentation of the spatial evolution of the volcanic activity along with pinpointing the superposition of new lava flows. For instance, from May 2019 [MAYOBS1, Feuillet 2019] to July 2019 [MAYOBS4, Fouquet and Feuillet 2019], the main summit of the volcanic edifice stopped growing and only lateral expansions of the lava flow field occurred [Deplus et al. 2019]. From August 2019 [MAYOBS5, SHOM 2019] and January 2021 [MAYOBS17, Thinon et al. 2021], the active lava flows were located 10 km NW of the main NVE summit. They gradually filled a circular area, ∼5 km diameter, hereafter called Tiktak area. A deep-tow camera survey observed incandescent lava flows in October 2020 near the center of the Tiktak area [MAYOBS15, Rinnert et al. 2020b]. Fresh samples of these lava flows were also dredged, leading to “popping rocks” on board the ship [Berthod et al. 2021, Feuillet et al. 2021].
4. MAHY hydroacoustic monitoring network
4.1. Instrument description
The AuHs deployed offshore Mayotte Island were designed after those of NOAA’s Pacific Marine Environmental Laboratory [PMEL, Fox et al. 2001]. They continuously record low-frequency sounds (0–120 Hz). The sensor (a HTI90 hydrophone) consists of a piezoelectric ceramic cylinder with a flat frequency response between 2 Hz and 20 kHz. The data logger is based on a low-power microprocessor CF2 Persistor, sampling at 240 Hz and storing data on a SD (Secure Digital) card. A high-precision TCXO (Temperature Compensated Crystal Oscillator) clock is synchronized with the GPS clock prior to deployment and after recovery. The instrument’s clock drift is usually on the order of 1–2 s over a 1-year deployment; the correction is applied before any data processing. Lithium batteries provide an autonomy of over 2 years, but since their transportation has become more and more restricted, we are currently testing alkaline batteries to simplify network maintenance in the future. The mooring line is anchored with a disposable weight of 400 kg at the sea bottom. An immersed buoy maintains the hydrophone at the SOFAR depth (∼1300 m b.s.l.). An acoustic release triggered from the surface can free the mooring line for its subsequent recovery. The position of the acoustic release is either obtained by acoustic triangulation, or from a LBL (Long BaseLine acoustic positioning) beacon. Mooring deployment or recovery takes about 2 h.
4.2. MAHY deployments
During the MAYOBS15 cruise [Rinnert et al. 2020b] in October 2020, we deployed four AuHs around the NW–SE-oriented volcanic ridge that bridges Mayotte Island and the NVE (Figure 1). The array has a radius of ∼50 km around the NVE. The instruments were then turned around in April 2021 [MAYOBS18, Rinnert et al. 2021a] and in October 2021 [MAYOBS21, Rinnert et al. 2021b]. The first deployments (MAYOBS15) were named MAHY01 to MAHY04, and the second deployments (MAYOBS18) were named MAHY11 to MAHY14.

MAHY hydroacoustic array (yellow circles) located ∼50 km around the new underwater volcano (yellow triangle) SE of Mayotte Island. The bathymetry is from MAYOBS1 survey [Feuillet 2019, Feuillet et al. 2021] and SHOM [2016].
During the first 6-month deployment, from mid-October 2020 to mid-April 2021, the four AuHs recorded data 100% of the time (Figure 2). In the following 5.5-month deployment, from mid-April 2021 to the end of September 2021, they recorded 86% (MAHY11), 77% (MAHY12), 100% (MAHY13, Figure 3), and 96% (MAHY14) of the time. MAHY11, MAHY12, and MAHY14 stopped recording, 22, 36, and 6 days before their recovery, respectively (see Supplementary Materials S1 and S2 for all spectrograms). MAHY11 failure was due to battery problems while that of MAHY12 is not yet understood. As for MAHY14, the failure is related to a SD card problem and recovery of the data might still be possible. The next maintenance of the AuHs is scheduled for Summer 2022.
Various types of sounds were highlighted in the data, including marine mammal calls, anthropogenic noise [Figures 2 and 3; Bazin et al. 2021], but only those related to the ongoing submarine volcanic activity are reported here. The data are obscured by seismic shots from three exploration surveys that took place in the Mozambique Channel: from 27/12/2020 to 04/02/2021 (SISMAORE [Thinon et al. 2020] and MAYOBS17 [Thinon et al. 2021] campaigns), and from 20/02/2021 to 07/03/2021 [CARAPASS (Division Plans de DMI—SHOM) campaign]. As a consequence, only a subset of the hydroacoustic dataset has been analyzed so far.
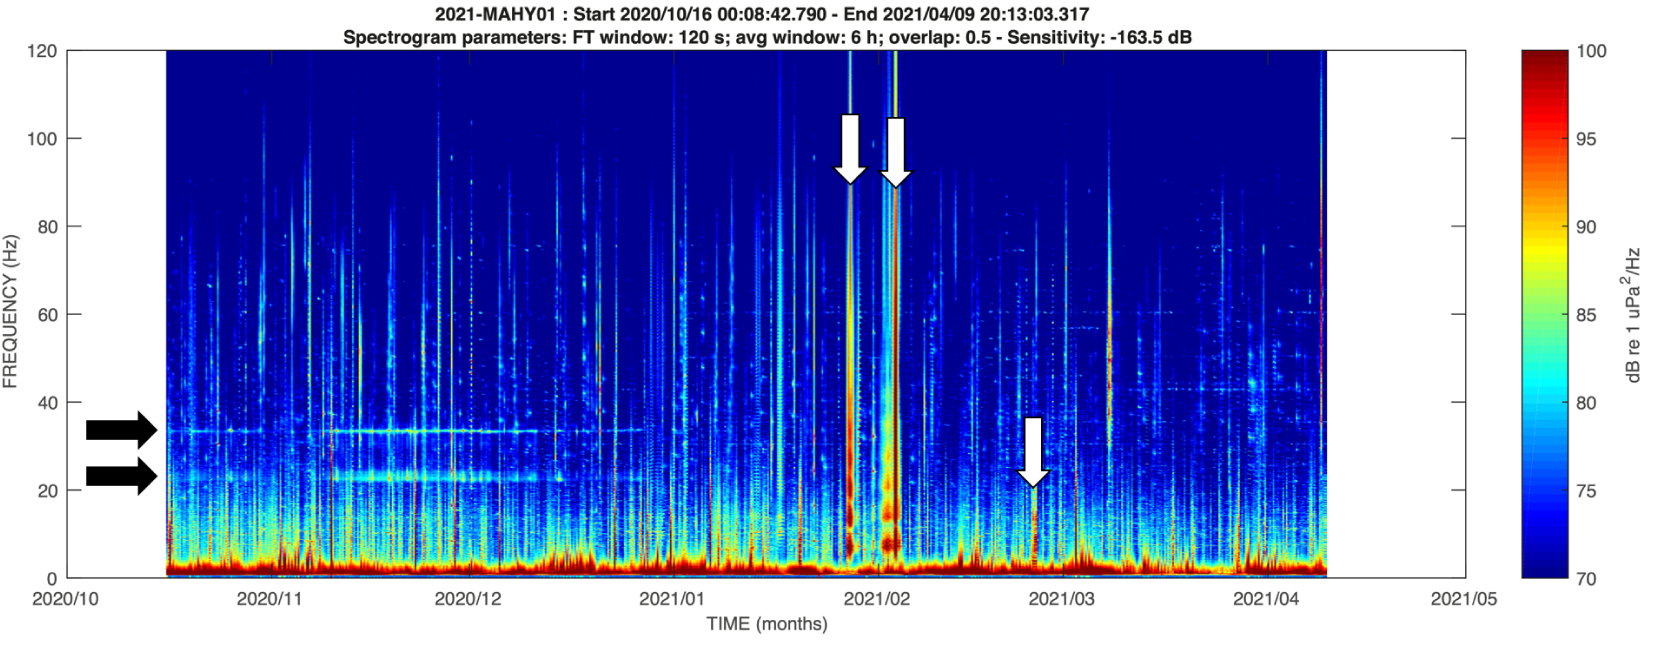
Spectrogram of the first 6 months of MAHY01 data from mid-October 2020 to mid-April 2021. The horizontal bands in Fall correspond to marine mammal calls (marked with black arrows), while the vertical stripes correspond to temporary nonvolcanic sound sources such as seismic surveys (marked with white arrows). Transiting ships are discernible as vertical (dotted) lines in the spectrograms.
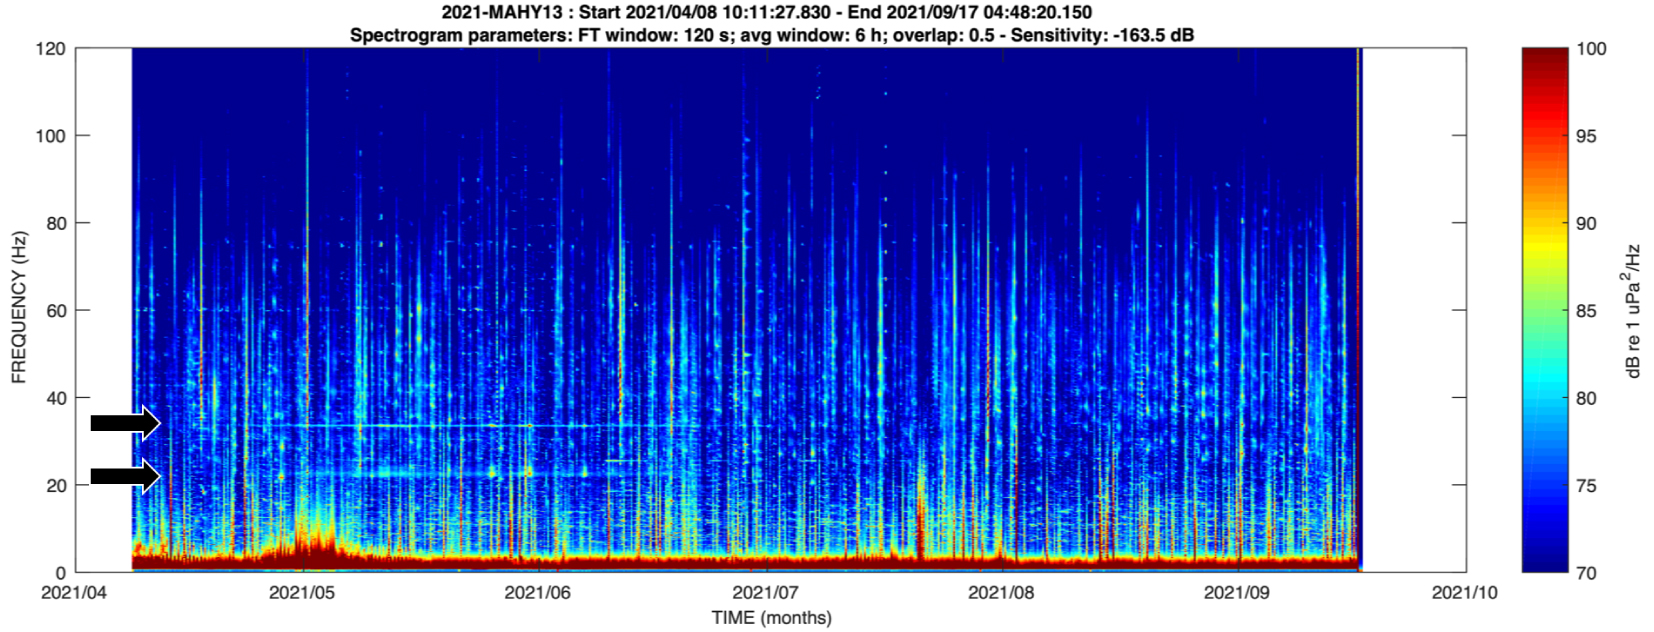
Spectrogram of the following 5.5 months of MAHY13 data from mid-April 2021 to mid-September 2021. The horizontal bands in Spring correspond to marine mammal calls (marked with black arrows).
4.3. Data processing
PMEL developed an AuH data processing and visualization software called Seas [Fox et al. 2001]. This software, written in the IDL language, includes a range of tools for spectral analysis, filtering, audio conversion, and localization. All these functions are used through an interactive menu (Figure 4). The operator can visually identify events in the spectrograms from their spectral signature. Using at least three arrival times, the software can determine an initial location and then resynchronize the signals in time, so that all signals related to the same event are horizontally aligned in the display window. The display can be zoomed in for a more precise picking of the arrival times, so that the event location can be iteratively improved. The source location and origin time are estimated by a non-linear least-square minimization of the arrival times. The location can then be saved in a file containing the latitude and longitude, the origin time, the names of AuHs that recorded the event, the residuals, the uncertainties in the location and time of origin, the source acoustic level (SL) and the error on this level, along with sound velocities used during the inversion. The uncertainties in latitude, longitude and origin time are estimated from the covariance matrix of this least-square minimization. The distances and travel times to each AuH are calculated using the seasonal sound velocity from the Global Digital Environment Model (GDEM) and averaged along great circle paths joining the source to each of the AuHs [Teague et al. 1990].
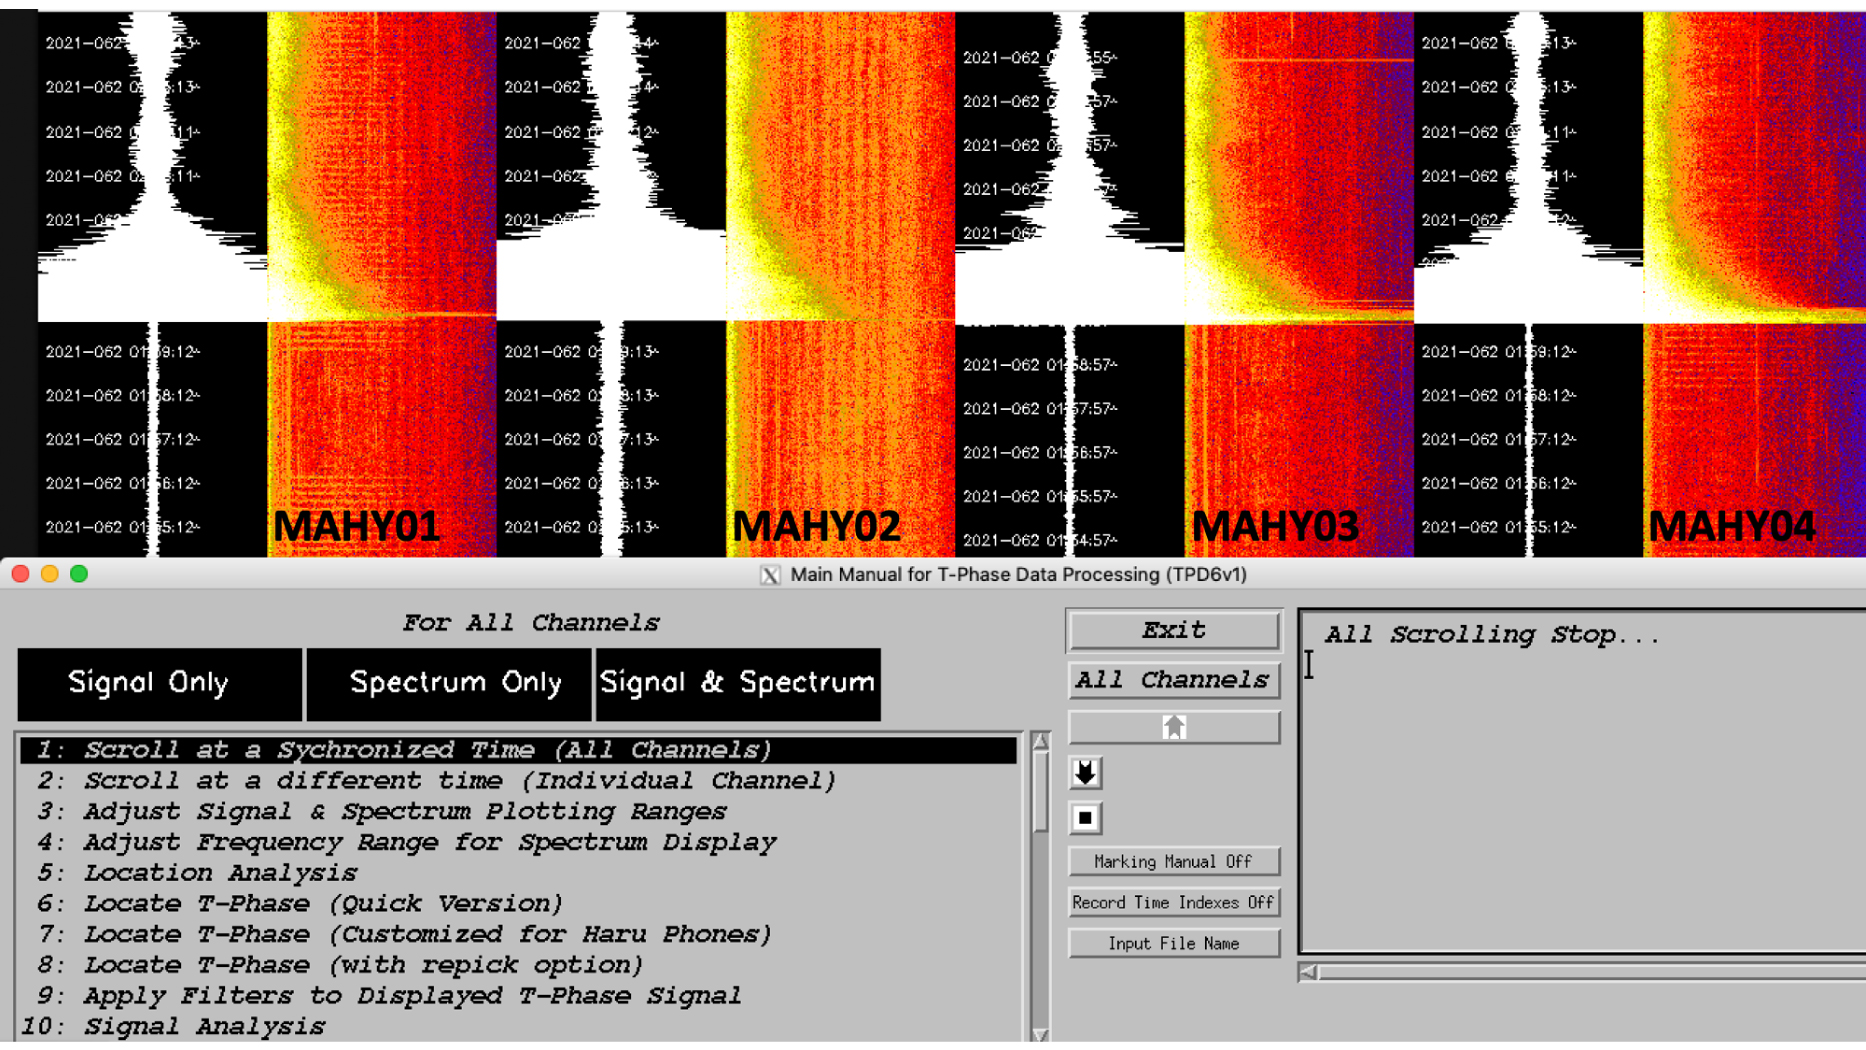
Seas visualization and processing software of hydroacoustic data developed by PMEL [Fox et al. 2001]. The raw signal is shown in white and the spectrum in colors between 0 and 120 Hz, for the four AuHs. Each time-mark corresponds to 1 min. Notice the energetic T-wave generated by the 3/3/2021 M4.5 local earthquake, as well as the background noise before and after the earthquake corresponding to regular seismic shots (CARAPASS seismic survey more than 600 km away, in the southern part of the Mozambique Channel, only visible in the spectrum). Masquer
Seas visualization and processing software of hydroacoustic data developed by PMEL [Fox et al. 2001]. The raw signal is shown in white and the spectrum in colors between 0 and 120 Hz, for the four AuHs. Each time-mark corresponds to 1 min. ... Lire la suite
4.4. Impulsive hydroacoustic events
Local and regional seismicity is recorded by the AuHs as T-waves (marked in green in Figure 5), which results from the conversion of the seismic waves at the crust/ocean interface (i.e. the seafloor) into hydroacoustic phases. So, the localization of T-wave sources actually corresponds to the conversion area (i.e. acoustic radiator on the seafloor) which may not always coincide with the earthquake epicenters, particularly when their sources are 25 to 50 km deep, as is the case in Mayotte. The AuHs seismic catalog is therefore not so useful for locating deep earthquakes. Nevertheless, each AuH also detected many unusual impulsive events that are very energetic and very short (<10 s duration, marked in blue in Figure 5) compared to the T-waves [Ingale et al. 2021]. Their short durations and their high-frequency content (up to 50–100 Hz) indicate that they are H-waves (only water borne), meaning that the energy is released directly into the water and does not travel into the solid crust as for regular T-waves.
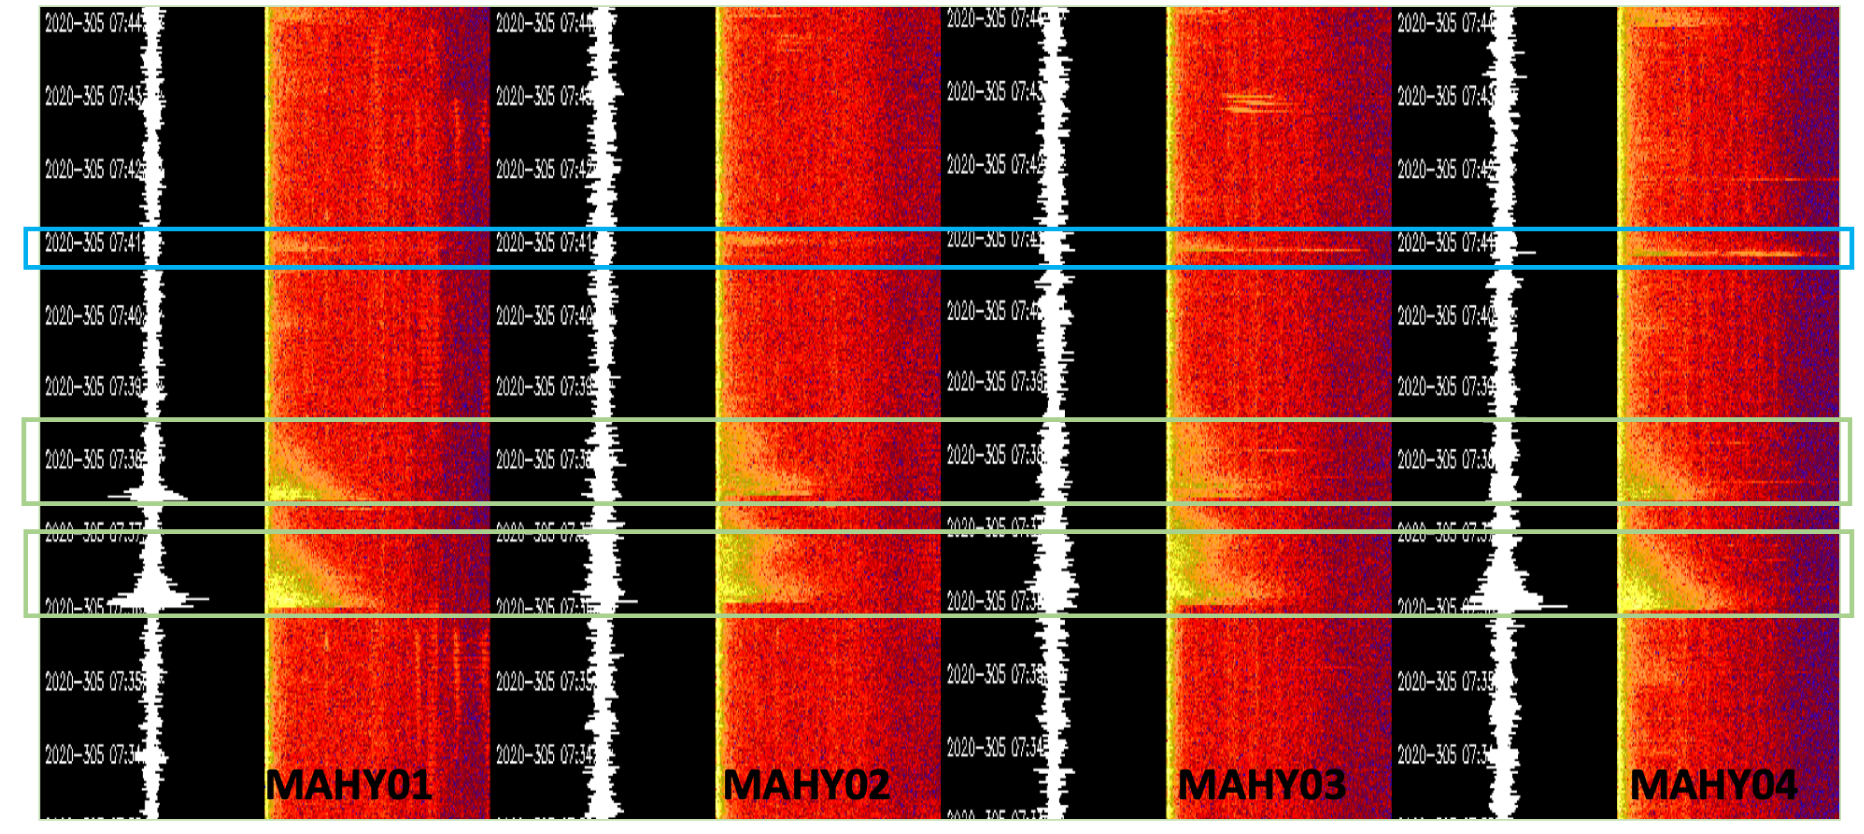
Seas visualization (same as in Figure 4) of regular T-waves from local earthquakes (2 events, outlined in green) and of an impulsive event (outlined in blue), both in the time and spectral domains.
Because of the large amount of data that has been recorded over the 11.5 months of the experiment, we have, so far, only examined in detail and handpicked a subset of data (Table 1 and Figure 6). Our strategy was to pick all impulsive signals identified within a period of 4 h, and then extrapolate their number to obtain an average rate over 24 h. We did this for eight different days between October 2020 and December 2020, which were selected based on their high signal-to-noise ratio (SNR). The rate of impulsive events was very high at the beginning of the recording period (October–November 2020), with a maximum of 600 events per day on November 14th, 2020, and then significantly decayed in December 2020 (Table 1). In January 2021 and February 2021, the occurrence of impulsive events decreased even further, so that it became possible to hand-pick them one by one 24/7 (Table 1). A daily average of 13 and 11 impulsive events was observed in January 2021 and February 2021, respectively, with a daily occurrence varying between 0 and 47 events (Table 1, Figure 6).
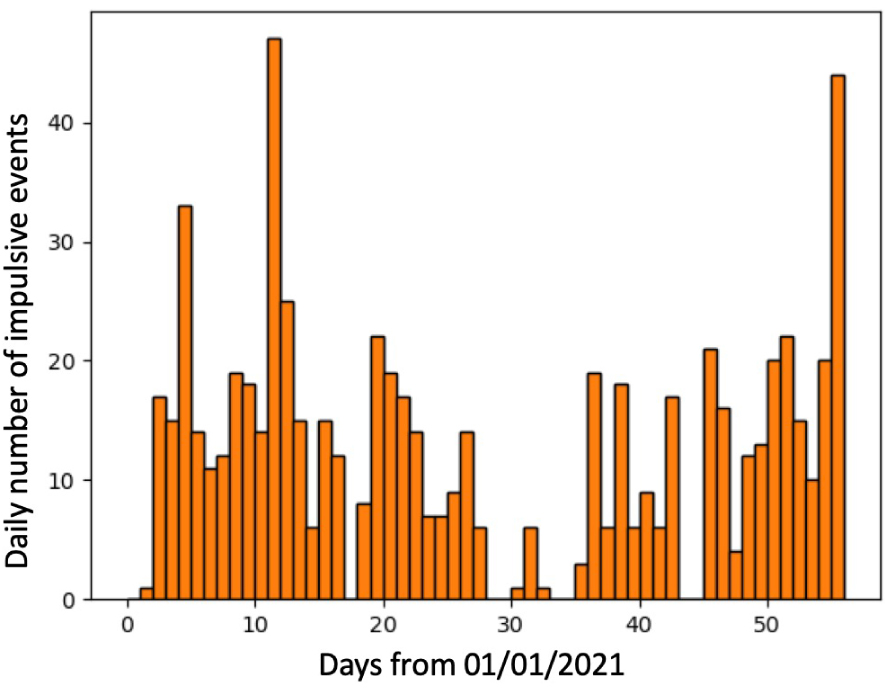
Histograms of the impulsive events detected by visual inspection during the months of January 2021 and February 2021.
We also tested a simple automatic detector tuned for these impulsive events based on the amplitude variations in the spectrograms of the four AuHs. The threshold levels (minimum amplitude level in the spectrum, minimum amplitude drop, maximum event duration, etc) were adjusted by fitting the previously handpicked detections during mid-November 2020 on the MAHY04 dataset. Daily automatic detections for the four AuHs is presented in Figure 7. The automatic detections led to the identification of more impulsive events than the events picked manually due to false detections related to the high noise level in the data (i.e., seismic shots or whale pulses). In addition, the high rate of automatic detections in April 2021 is likely an artifact due to the start of MAYOBS18 (ship noise) on site. Moreover, two AuHs (MAHY02 and MAHY03) are more sensitive to ship traffic (see Supplementary Material S1) and present higher automatic detection rates than the two other near-shore instruments (MAHY01 and MAHY04). Due to the high automatic detection rate during the SISMAORE, MAYOBS17 and CARAPASS seismic surveys, we concluded that this method of automatic detection was not effective in a poor SNR context for assessing the occurrence of impulsive events. In such a context, automatic recognition methods based on machine learning may be more successful and will be explored.
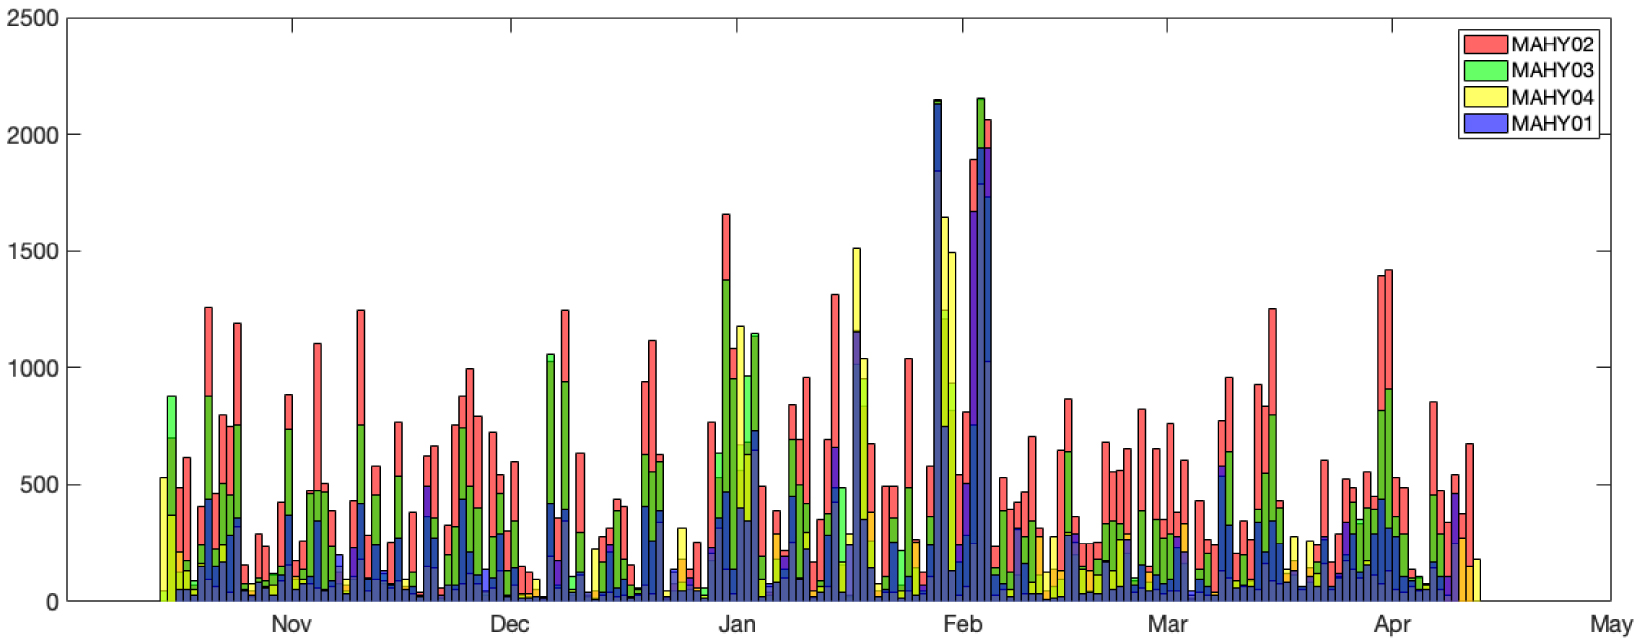
Histograms of the daily number of impulsive events detected by a simple automatic detection on the four AuH records during the first 6 months of the experiment (mid-October 2020 to mid-April 2021). The high level of automatic detections in January 2021 and February 2021 is an artifact due to poor SNR during seismic surveys. Indeed, the picks observed during the two time windows on 29–30/01/2021 and 2–4/02/2021 correspond to zero detection by visual inspection in Figure 6.
Summary of the number of impulsive events detected by visual inspection of the first five months of data
| Months | Analysis window | Count over 4 h | Minimum over 24 h | Maximum over 24 h | Average over 24 h | Context |
|---|---|---|---|---|---|---|
| Oct 2020 | Count in 00:00TU–04:00TU, day 31 | 50 | 300 | Noisy during MAYOBS15 | ||
| Nov 2020 | Count in 00:00TU–04:00TU, day 07 | 40 | 240 | |||
| Count in 00:00TU–04:00TU, day 14 | 100 | 600 | ||||
| Count in 00:00TU–04:00TU, day 21 | 50 | 300 | ||||
| Count in 00:00TU–04:00TU, day 28 | 30 | 180 | ||||
| Dec 2020 | Count in 00:00TU–04:00TU, day 5 | 50 | 300 | |||
| Count in 00:00TU–04:00TU, day 12 | 50 | 300 | ||||
| Count in 00:00TU–04:00TU, day 25 | 10 | 60 | ||||
| Jan 2021 | Count in 00:00TU–04:00TU, everyday | 0 | 47 | 13 | Noisy during seismic survey | |
| Feb 2021 | Count in 00:00TU–04:00TU, everyday | 0 | 22 | 11 | Noisy during seismic survey |
Our strategy was to estimate as fast as possible the level of activity (illustrated with orange–red colors) throughout the experiment. A subset of eight days was handpicked during the time of high activity from October 2020 to December 2020, and 59 days were handpicked during the time of low activity in January 2021 and February 2021 (Figure 6).
4.5. Localization of hydroacoustic activity
From a visual inspection of the days with a high SNR on the four AuH datasets (those with good detections of impulsive events), 15/11/2020 appears as one of the most active days. Hence, we focussed our analysis on this specific date. Hand picking the impulsive events on this day resulted in a catalog of 81 events containing information on their latitude, longitude, SL and uncertainties. In fact, there were more impulsive events detected by the AuHs during that day, especially by MAHY04, but only 81 of them were clearly recorded simultaneously by the four AuHs. The picking uncertainty is on the order of 6 s. The mean error on the positions is 1654 m while the mean error in origin time of the source is 0.87 s. All the events identified on 15/11/2020 are located in the Tiktak area of the new lava flow field that was emplaced between May 2020 and January 2021. Re-picking these 81 events in a zoomed time window (the procedure is explained in the Data Processing paragraph, see also see Supplementary Material S3) reduced the position errors to 258 m on average, and to 0.13 s in origin time. All the 15/11/2020 re-picked events are clustered near the small Tiktak mount, which is ∼60 m high and located near the center of the new lava flow field (Figure 8). The estimation of location errors (258 m) is based only on the Seas inversion. Uncertainties due to bathymetric effects, 3D variation in sound speed, or buoy displacements are not taken into account, but are likely to be limited and similar for all events.
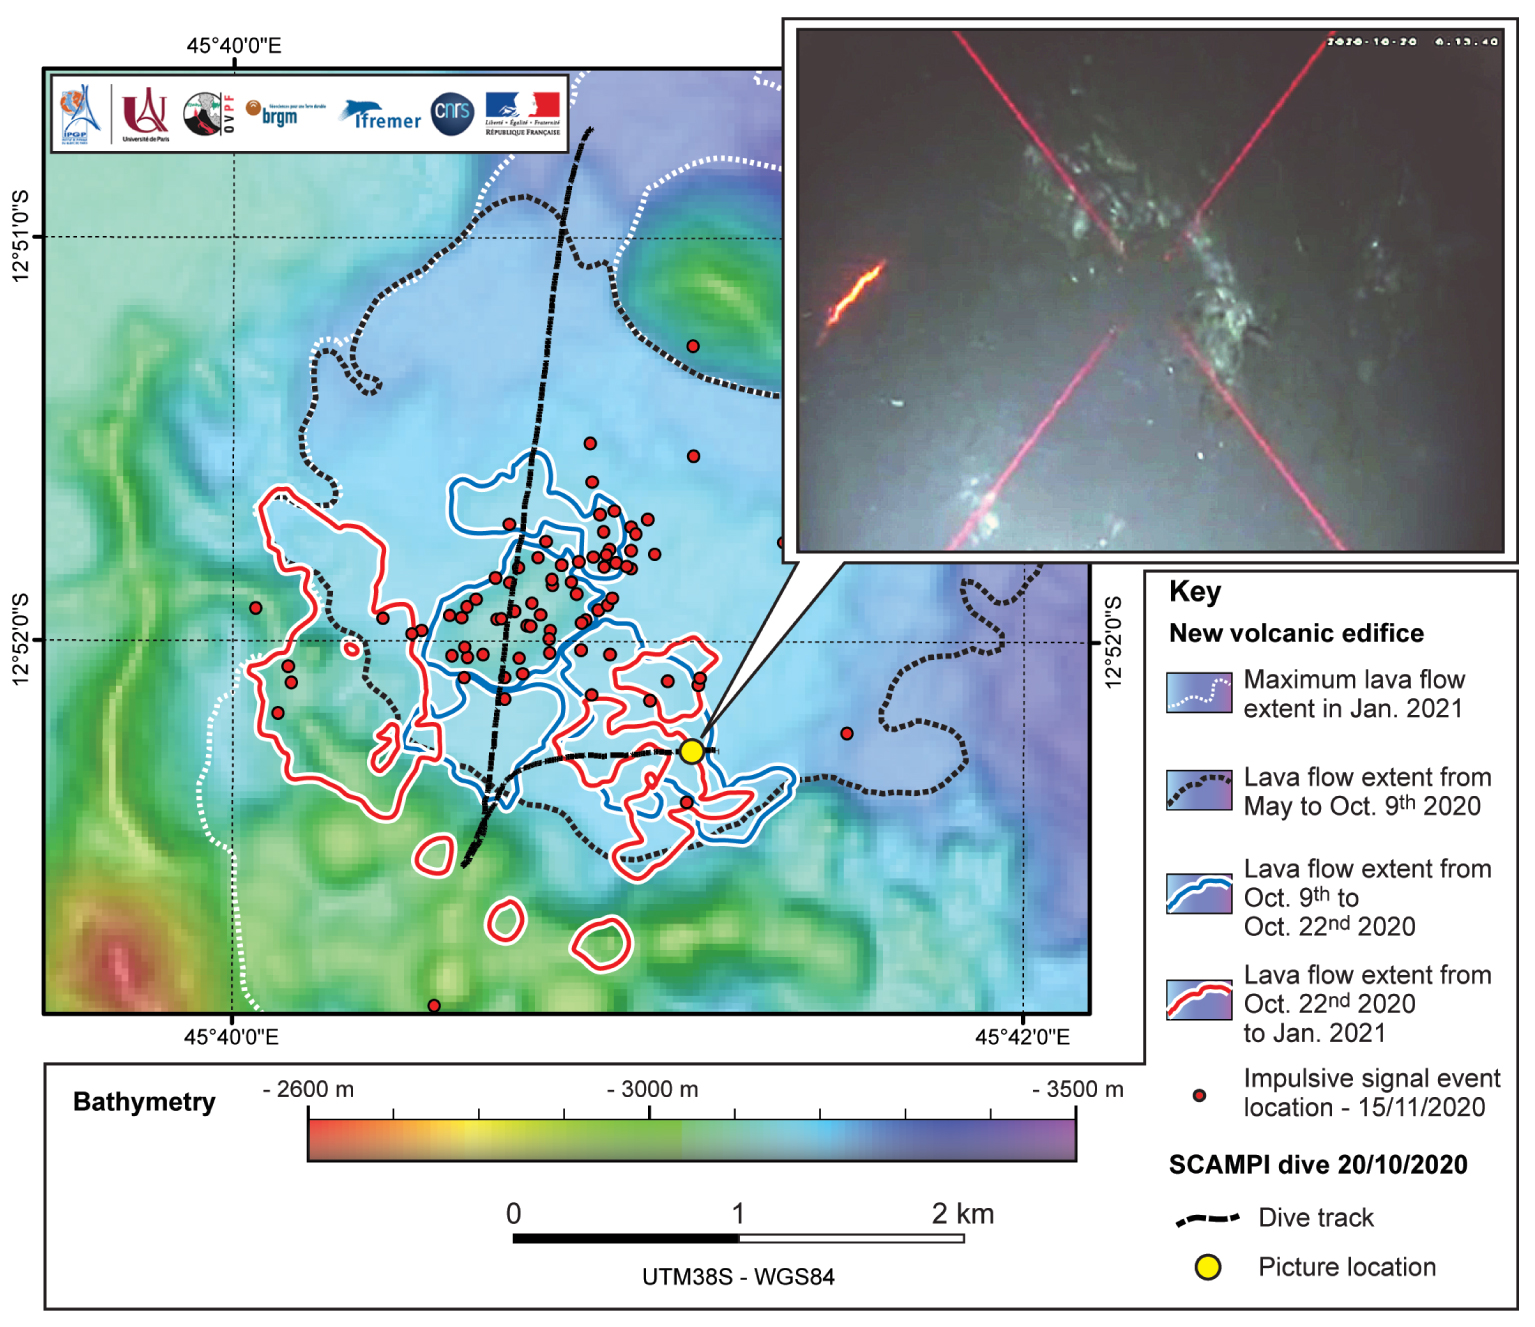
Impulsive events (red circles) detected on 15/11/2020 and located in the Tiktak area. The dashed black line tracks the SCAMPI deep-towed camera transect BS15-135. The black dotted line, blue solid line, and red solid lines outline the most recent lava flows detected by multibeam bathymetry between May 2020 and January 2021 (see key for detail). The deep-towed camera recorded a glimpse of incandescent lava at the position marked by a yellow circle as shown in the top left inset photograph. Red diagonal lines are lasers used for scale. Masquer
Impulsive events (red circles) detected on 15/11/2020 and located in the Tiktak area. The dashed black line tracks the SCAMPI deep-towed camera transect BS15-135. The black dotted line, blue solid line, and red solid lines outline the most recent lava ... Lire la suite
During MAYOBS15, a 5632 m-long dive with a towed camera (SCAMPI) across the Tiktak region (Transect BS15-135; Figure 8) recorded, for the first time, a glimpse of incandescent lava at the end of the transect on 20/10/2020 at 06:13:40TU, at position 12° 52.27′ S and 45° 41.15′ E [REVOSIMA 2021b, see inset in Figure 8]. The impulsive events are clustered in the Tiktak area which is the active lava flow field at that time. Hence, we regard these events as implosions when hot lava interacts with seawater. They correspond to the sound generated by the gas bubbles that implode under the effect of pressure. Both Wilcock et al. [2016] and Tan et al. [2016] documented similar signals in association with steam bursts, on the East Pacific Rise. These impulsive events appear to be associated with the emplacement of new lava flows, and therefore represent a potential new method for monitoring submarine volcanic activity.
5. History and morphological evolution of the Tiktak flow field
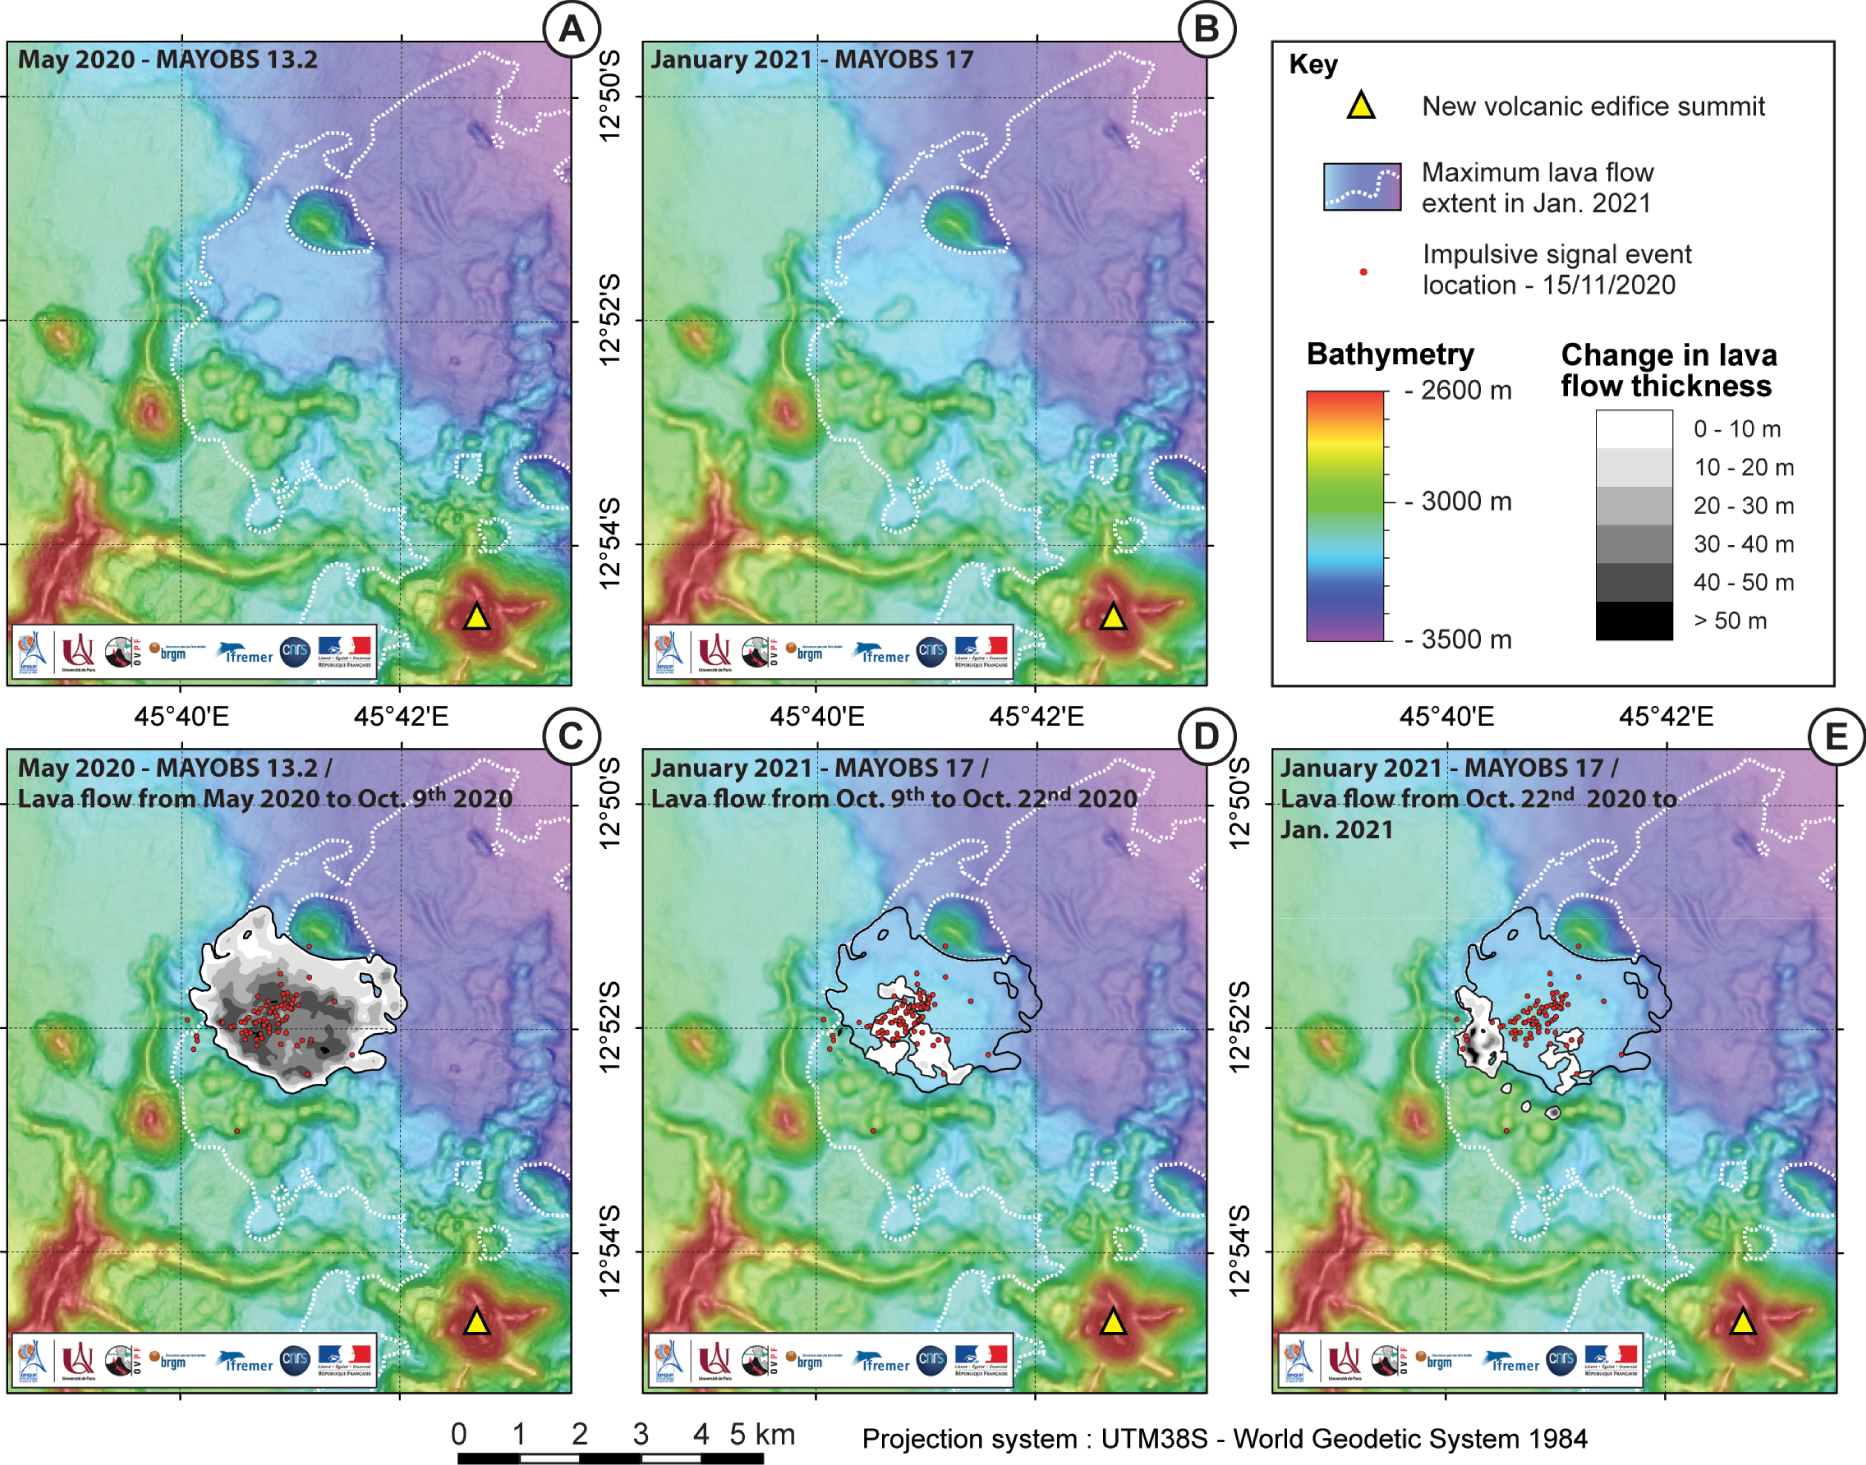
Chronological evolution of the Titkak lava flow field based on bathymetric data from successive multibeam surveys. Panels A and B show the bathymetric maps acquired in May 2020 [MAYOBS13-2, Rinnert et al. 2020a] and in January 2021 [MAYOBS17, Thinon et al. 2021]. Panels C, D, and E highlight depth changes (i.e. change in thicknesses of the new lava flows) between May 2020 and 09/10/2020 (C), [MAYOBS15, Rinnert et al. 2020b], between 09/10/2020 and 22/10/2020 (D), and between 22/10/2020 and January 2021 (E). All the impulsive events detected on 15/11/2020 (red circles) are located in the area covered with lava that erupted between May 2020 and January 2021. The lava flows which were emplaced during the period that brackets the hydroacoustic observations are less voluminous and therefore closer to the multibeam echosounder detection threshold (E). Masquer
Chronological evolution of the Titkak lava flow field based on bathymetric data from successive multibeam surveys. Panels A and B show the bathymetric maps acquired in May 2020 [MAYOBS13-2, Rinnert et al. 2020a] and in January 2021 [MAYOBS17, Thinon ... Lire la suite
To examine the relationships between the temporal and spatial distribution of the impulsive events and the lava flow field in the Tiktak region, we examined the available bathymetric data. Ship-borne multibeam echosounder data was acquired during three successive cruises (MAYOBS13-2, MAYOBS15 and MAYOBS17). The datasets were re-processed with the GLOBE software [GLobal Oceanographic Bathymetry Explorer, Poncelet et al. 2021] to produce digital terrain models (30-m grid-cell spacing) and seafloor backscatter imagery. Successive surveys were compared to detect depth changes due to new lava deposits and to estimate their area and thickness (Figure 9). Assuming a vertical resolution of 5 m, new volcanic material can be inferred when depth changes exceed 10 m over a sufficiently large area. The data show up to 60 m-thick new lava flow between May 2020 and October 2020 in the Tiktak area. It continued growing after October 2020, but had stopped growing by January 2021. The AuH array was deployed during the last months of activity of the Tiktak lava flows. The impulsive events detected on 15/11/2020 can be seen as a snapshot of the eruptive activity and we suggest that they highlight areas of active flow emplacement.
6. Perspectives
We investigate the hydroacoustic data to track the sounds generated as hot lava interacted with cold seawater. Such signals could either be produced near the outlet or at the flow fronts [Le Saout et al. 2020]. Further examination will be necessary to investigate their detailed relation with flow emplacement. Anyhow, these impulsive sounds can indicate the start and end of submarine eruptions. As observed by the rate of impulsive events, the eruption activity in the Tiktak area was highest in October–November 2020, significantly decayed in December 2020 until it stopped. Fortunately, the AuHs were deployed before the end of the eruption and are now in place to detect potential restart. Hydroacoustic monitoring can indeed be used as a proxy for the duration of the eruptive activity [e.g. Chadwick et al. 2016]. When combined with detailed seafloor mapping, it can reveal lava emplacement in time and space. Extrusion rates can then be estimated to study the dynamics of the eruption [Le Saout et al. 2020]. Here, this preliminary analysis reveals only a snapshot of the Tiktak eruption. A more detailed analysis should elucidate the time–space pattern of the impulsive sounds. Estimation of extrusion rates will be possible when seafloor morphology analysis and ROV bathymetry data become available.
The time pattern of the impulsive events may also help to detect missed events in the OBS data. Interestingly, they lie at the southern tip of the distal seismic swarm which is interpreted as a feeder dyke [Figure 10, Feuillet et al. 2021, Lavayssière et al. 2021, Retailleau et al. 2022]. However there is so far no sign of seismic activity in the upper crust above 25 km depth, nor in the overlying first kilometers of the sedimentary cover [Coffin et al. 1986, Masquelet et al. 2022]. The occurrence of this seismic cluster only between 25 and 50 km depth is still unexplained. We suppose that a more detailed analysis possibly using template matching might reveal nonvolcano-tectonic events in the so-called aseismic zone [e.g. Duputel et al. 2019]. The available hydroacoustic data do not provide the reason for why the upward and southward migration of magma in the crust seem silent, nevertheless it can pinpoint the time windows where available OBS data could be further analyzed.
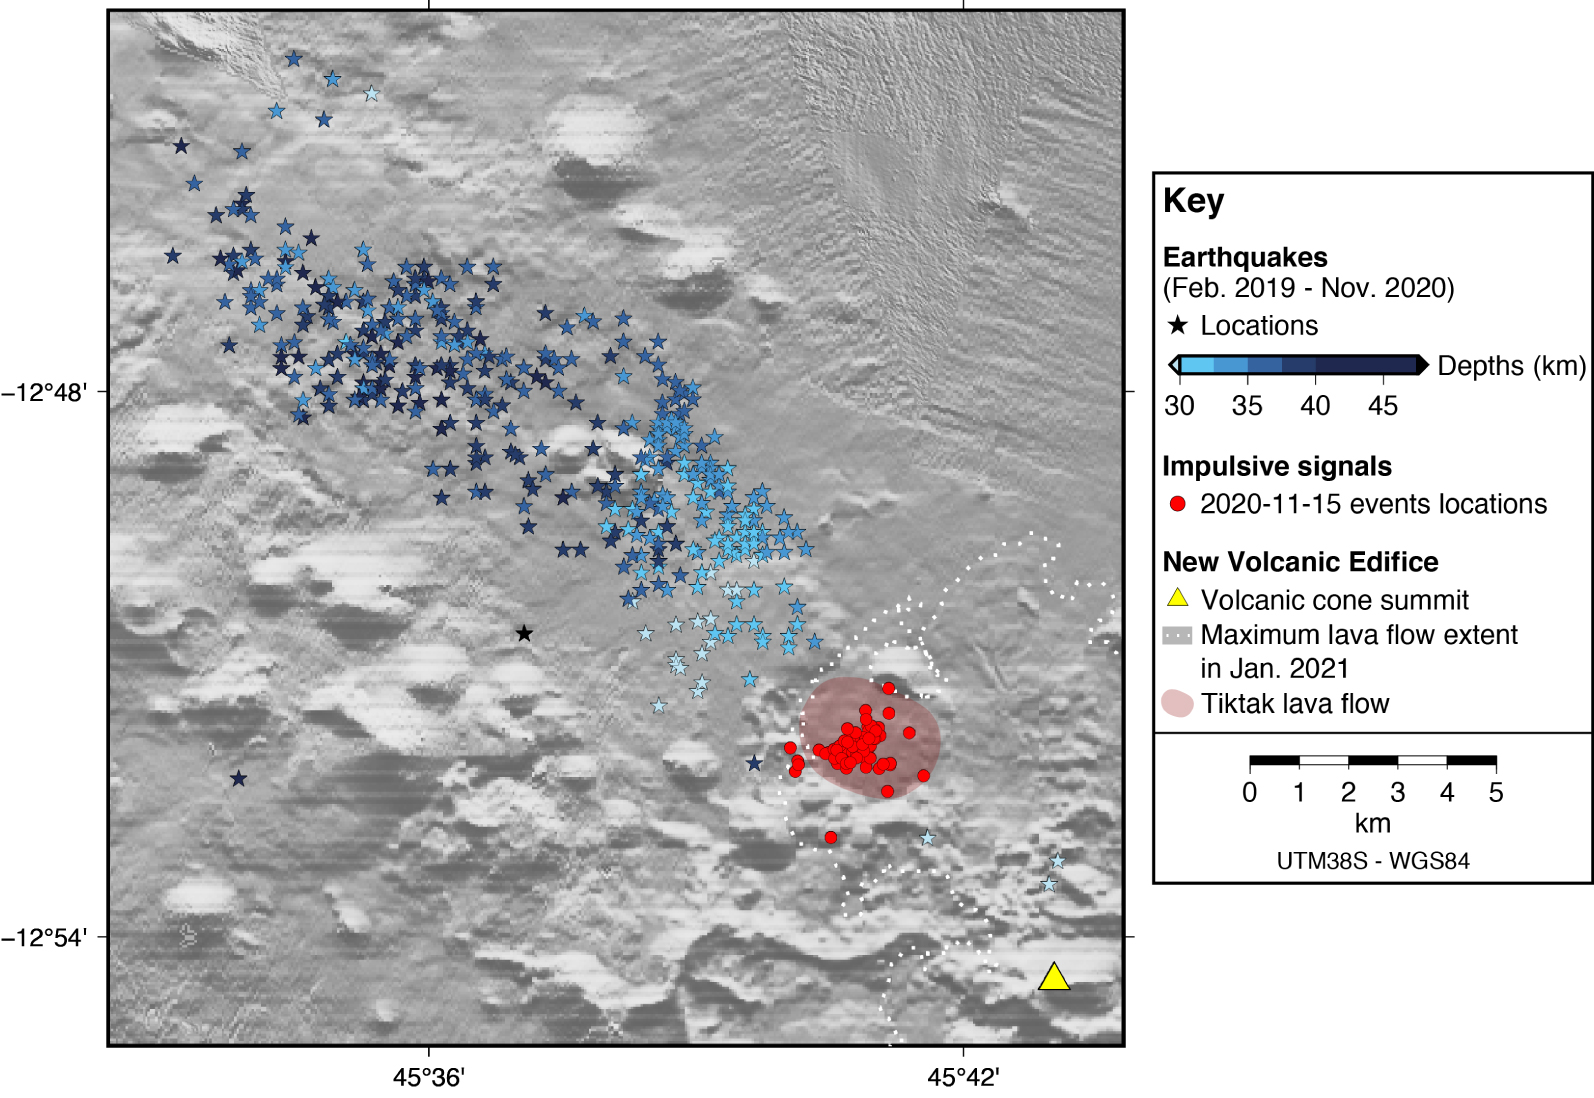
The hydroacoustic impulsive signals (red dots) interpreted as lava emplacement lie at the southern tip of the seismic swarm (colored stars). The events of the seismic swarm are the best-constrained locations from 25/02/2019 to 11/11/2020, using OBS and land seismic stations. The colors used for the earthquakes illustrate the depth of the epicenters: they show the upward and southeastward injection of magma through the feeding dyke [modified from Lavayssière et al. 2021].
Streaming real-time data to shore is not yet available and one can mitigate this problem by making frequent access to the hydroacoustic network, at short range from Mayotte. However, deploying and recovering the current AuH moorings requires vessels with an A-frame or a small crane, and a winch, which are not available in Mayotte. The recent development of a long-term hydrophone prototype [HYDROBS for HYDROacoustic OBServatory, Royer et al. 2019] may facilitate more efficient data recovery. It is equipped with three shuttles (13′′ glass spheres) that can be released on demand to collect the data. Data is duplicated once per day from the data logger to the shuttles wirelessly (1 Mb/s digital inductive through water). The shuttles can be recovered with any small vessel and are designed to be handled by nonspecialists. For instance, prior to its release, the shuttle synchronizes with the logger clock and when it surfaces, it automatically synchronizes with GPS time and stores the clock drift. Shuttles can be located on the sea surface with an AIS-like (Automatic Identification System) system. We plan to deploy an array of such moorings on the Mayotte volcano area in the near future.
7. Conclusions
Although the hydrophones were deployed more than two years after the onset of the eruption, they were able to record numerous impulsive events in the vicinity of the NVE. The coincidence of the location of the impulsive events with the area of active lava flow emplacement supports the interpretation that they are directly related to lava–water interactions, and as such, monitoring these acoustic events provides a way to remotely detect and locate ongoing submarine eruptions. However, the automatic detection and location of such impulsive events needs to be improved before the scientific value of the full dataset can be revealed and these new methods can be used for risk assessment and monitoring.
A new research and monitoring endeavor focussed on Mayotte has just started in France, with the MARMOR (Marine Advanced geophysical Research equipment and Mayotte multidisciplinary Observatory for Research and response) project funded by the 2021 PIA3-EQUIPEX plan. Similar to the Ocean Observatories Initiative [OOI, Kelley et al. 2014] that has streamed data live to shore since 2014 at Axial Seamount, MARMOR will finance a permanent cabled observatory to monitor the new Mayotte volcanic area with a network of multidisciplinary instruments deployed on the seafloor and in the water column, including hydrophones (HYDROBS type). These preliminary results show the potential value of hydroacoustic monitoring to better understand volcanic processes occurring on the seafloor during submarine eruptions.
Conflicts of interest
Authors have no conflict of interest to declare.
Acknowledgments
Since June 2019, all activities performed on Mayotte by the REVOSIMA (https://doi.org/10.18715/mayotte.revosima) monitoring network are funded by MESRI (Higher Education, Research and Innovation Ministry), MTE (Environment Ministry) and MOM (Overseas Territory Ministry) with the support from MI (Interior Ministry), MINARM (Armed Forces Ministry), DIRMOM (joint-government department for Major Hazards in the Overseas). All marine operations are performed as part of the MAYOBS set of cruises (https://doi.org/10.18142/291) and we thank the captains and crews of the R/V Marion Dufresne, R/V Pourquoi Pas ? and BSAOM Champlain. We thank W. Chadwick and an anonymous reviewer for their very constructive comments on this publication. The SCAMPI dive was successful at observing the lava flow activity thanks to the expertise J.-C. Komorowski, C. Berthod, L. Gurioli, C. Scalabrin and R. Quinquis, which was crucial to this analysis. We express our gratitude to M. Beauverger for providing technical support, A. Lemarchand for logistical support, and C. Quinio for administrative support. FD was financially supported by IUEM (UAR3113 and UMR6538). The data contributes to the Service National d'Observation en Volcanologie (SNOV).
Vous devez vous connecter pour continuer.
S'authentifier