


 CC-BY 4.0
1. Introduction
The Comoros archipelago is composed of four volcanic islands (Grande Comore, Mohéli, Ajouan and Mayotte) with volcanic activities recorded from the Miocene to the Holocene [Debeuf 2004]. Since May 2018, the island of Mayotte has registered intense seismic activities related to the birth of a large new submarine volcano 50 km offshore Petite Terre, with a volume estimated to be around 5 km3 [Feuillet et al. 2021]. The epicenters of the seismic swarms are located between 5 and 15 km east of Petite Terre for the proximal swarm (Figure 1) and from 25 km to 50 km east of Petite Terre for the distal swarm [Lemoine et al. 2020a; Saurel et al. 2022]. Perturbations in the water column associated with plumes likely linked to magmatic activity were reported in the new volcano area and in the vicinity of the seismic swarm closest to Petite Terre [Feuillet et al. 2021; Scalabrin et al. 2021]. Although variations in the frequency of earthquakes and their distribution have been observed since the start of the eruption in early July 2018 [Cesca et al. 2020; Lemoine et al. 2020a; Mercury et al. 2020; Saurel et al. 2022], persistence of continuous seismicity could generate earthquakes of magnitudes close to Mw4, or even higher, that would be widely felt by the population. Since May 10, 2018, 2054 earthquakes with magnitudes greater than 3.5 have been recorded, including 36 with recorded magnitudes greater than 5 (REVOSIMA bulletin no. 33, August 2021). These strong seismic activities are located near the island of Mayotte and mainly east of Petite Terre where steep submarine slopes are observed (Figure 1). The intense seismo-volcanic crisis that has affected Mayotte since 2018, the location of earthquakes near the steep slopes surrounding the island and the construction of a new volcanic structure [Feuillet et al. 2021] may trigger submarine instabilities offshore Mayotte (and in particular to the east). The triggering of tsunamigenic submarine landslides by intense seismic activity has already been documented, for instance in 2018 in Palu Bay (Sulawesi, Indonesia) after a Mw 7.8 earthquake [Liu et al. 2020]. However, recent studies show that low amplitude (M < 3) but cumulative seismicity may also trigger landslides [Bontemps et al. 2020]. Gravitational instabilities could occur on steep submarine slopes offshore Mayotte but also on the new submarine volcano 50 km offshore Petite Terre: such instabilities are not new on volcano edifices [e.g. Lebas et al. 2018; Le Friant et al. 2015, 2019; Lipman et al. 1988; Moore et al. 1989; Paris et al. 2020; Sassa et al. 2016; Watt et al. 2014]. For instance, the collapse of the Anak Krakatau volcano in Indonesia in 2018 [93 Mm3, Gouhier and Paris 2019] triggered a tsunami that hit the coast of the Sunda Strait with waves of up to 80 m [Grilli et al. 2019; Paris et al. 2020]. Stromboli is also a tsunamigenic volcano that triggered five tsunamis from 1916 to 1954 [Maramai et al. 2005] and one in 2002 [Tinti et al. 2006]. Another occurrence is the Soufrière volcano on Montserrat Island (Lesser Antilles), where a 200 Mm3 dome collapse generated a tsunami in 2003, with waves of up to 2 m [Pelinovsky et al. 2004]. Potential instabilities and resulting tsunamis of the submarine volcano Kick-‘em-Jenny (Grenada, Lesser Antilles) have been studied by Dondin et al. [2016].
Bathymetry from Lemoine et al. [2020b] based on: Gebco 2014 (https://www.gebco.net), HOMONIM SHOM DTM (100 m resolution, https://data.shom.fr), MAYOBS 1 [Feuillet et al. 2021, 30 m resolution], bathymetric surveys of SHOM (25 m resolution, https://data.shom.fr), litto3D (lidar data at 1 m resolution, https://data.shom.fr). The main seismic swarm related to the on-going volcano seismic crisis is indicated as well as the new volcano. The scenarios of potential submarine instabilities are indicated in red. The location of the gauge EB is indicated. The insert (corresponding to the black rectangle in the main map) defines five strategic areas that will be discussed and shows the locations of the gauges voK, EM, ND, SD, WA, EA, NEPT.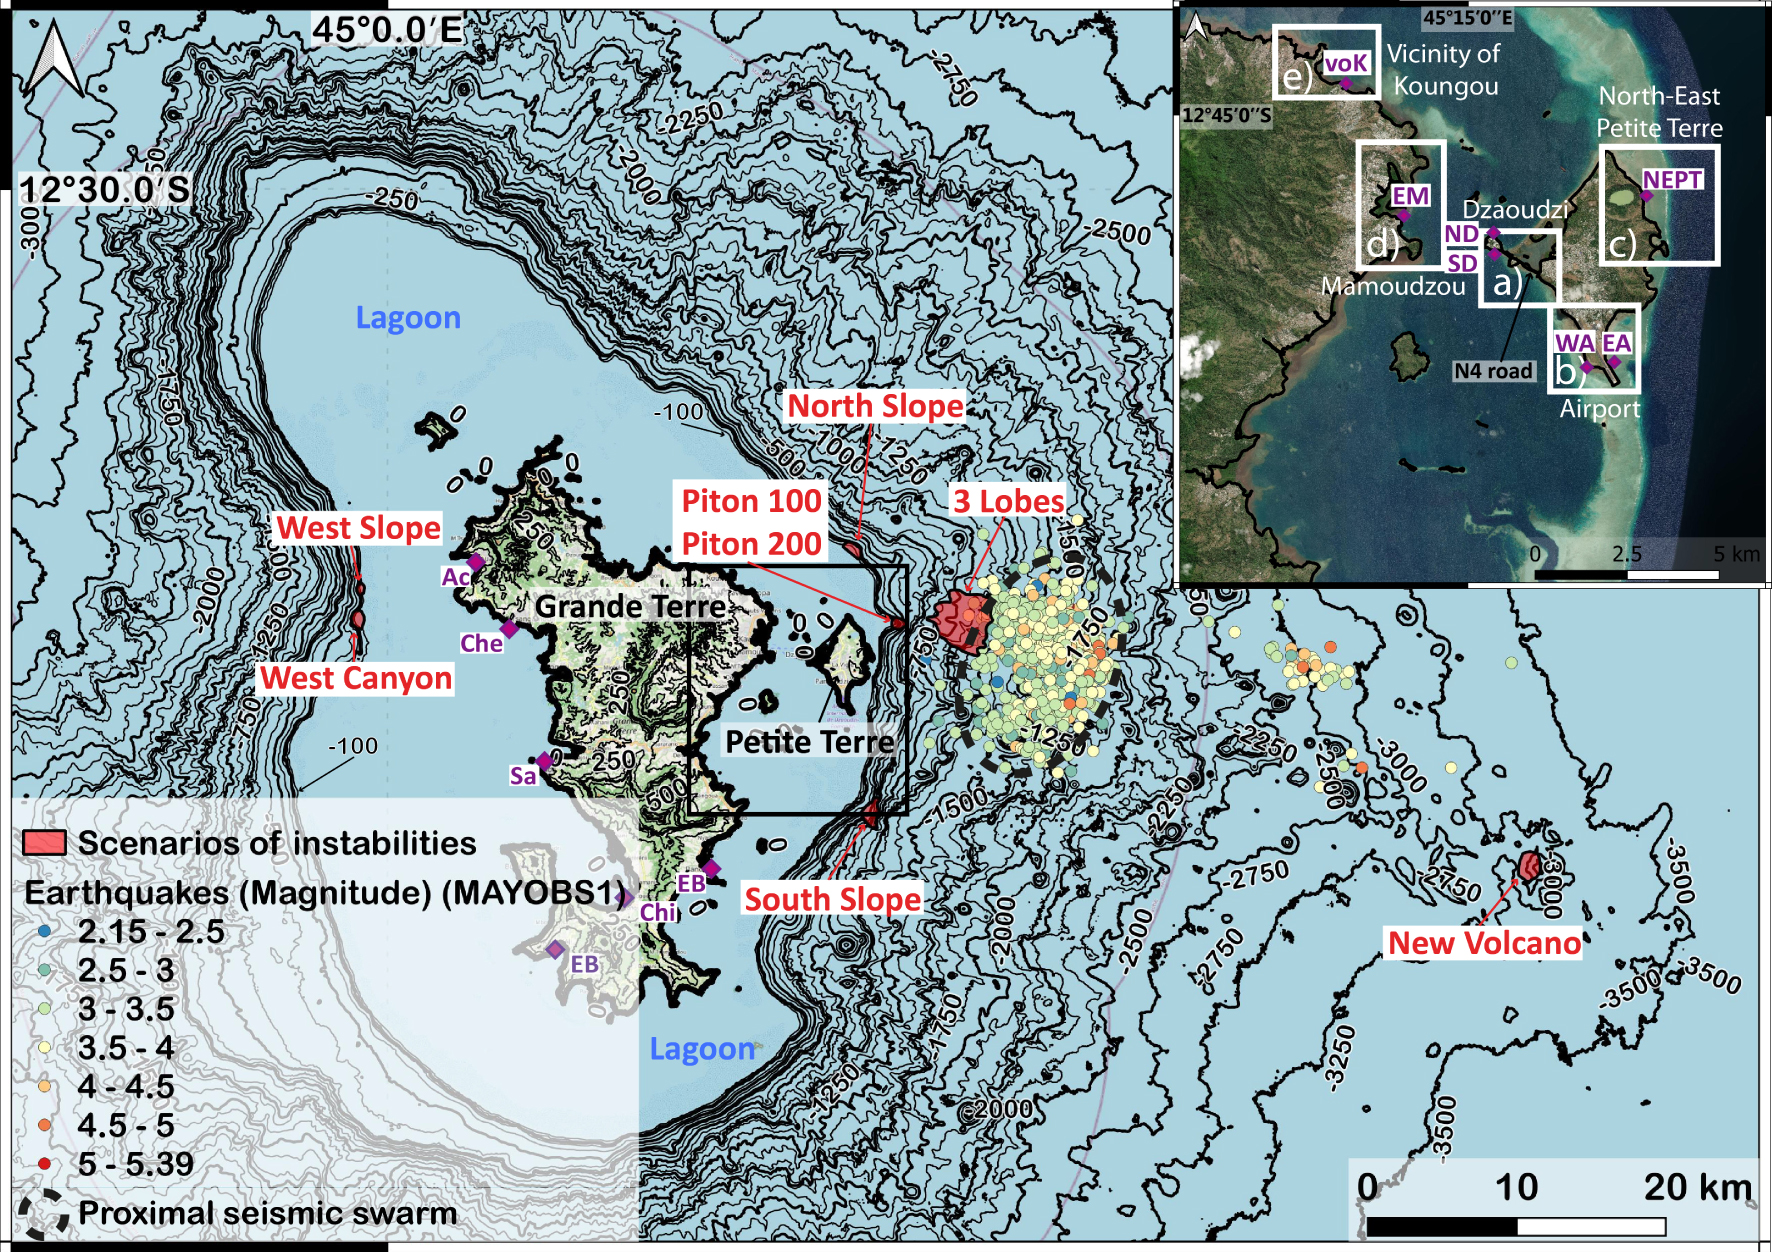
As discussed by Roger [2019], landslide-generated tsunamis could have a significant impact on Mayotte’s population and infrastructure. This impact can be quantified through hazard assessment. One of the main difficulties for hazard assessment is to identify the most probable landslide scenarios. Lemoine et al. [2020b] estimated the impact of 32 potential scenarios of submarine landslides on the slopes of Mayotte or on the new volcano. They then identified the scenarios that would be the most impactful for Mayotte. As a first attempt to assess tsunami hazards in Mayotte for national and local authorities in charge of risk mitigation, the deformation of the sea surface generated by each of the potential submarine landslides was calculated with the TOPICS software [Tsunami Open and Progressive Initial Condition System; Watts et al. 2003], based on simple empirical relations for the landslide description [Le Roy et al. 2015; Poisson and Pedreros 2010 and Di Risio et al. 2011 for a review of such empirical relations]. These relations represented the landslide motion as a rigid block moving along a constant slope. The displacement of the free surface of the water is modeled through empirical relationships that relate the geometric and physical characteristics of the landslide to the initial amplitude and wavelength of the generated tsunamis. However, beyond simple empirical relations or block models [Gylfadóttir et al. 2017], more realistic models describing the landslide exist (see for example the large number of models already used to simulate the 2018 Anak Krakatau landslide-generated tsunami listed in Grilli et al. [2021]). They may be used for hazard assessment as done for example by Giachetti et al. [2012] and Heinrich et al. [1998] who simulated tsunami waves generated by potential landslides on Anak Krakatau and Montserrat, respectively. A few years after these studies, landslides on these two volcanoes actually occurred. The generated tsunamis had characteristics (e.g. height and impacted areas) with orders of magnitude that were similar to the characteristics of the previously simulated tsunamis. As a result, despite the high uncertainty in such simulations [Løvholt et al. 2020] related to the potential scenario (location, volume, shape), the rheological laws describing these complex natural materials, and the model approximations, such numerical codes provide a unique tool to build hazard maps that are as physics based as possible. Full 3D models [e.g. Abadie et al. 2012; Rauter et al. 2022 and references in Romano 2020 and Grilli et al. 2021] or a combination of 3D and 2D models [Grilli et al. 2019; Løvholt et al. 2008] have been developed. As such models have huge computational costs, a significant number of shallow depth-averaged numerical models of tsunamis generated by landslides have also been developed over the past decades and applied to natural events [e.g. Abadie et al. 2010; Giachetti et al. 2012; Gittings 1992; Heinrich et al. 2001a, b; Kelfoun et al. 2010; Mangeney et al. 2000; Paris et al. 2019, 2020]. For tsunami wave simulation, most of the models applied at the field scale solve shallow (i.e. hydrostatic pressure) depth-averaged equations for a two-layer flow made of a layer of granular material moving beneath a water layer [Fine et al. 2003, 2005; Fernández-Nieto et al. 2008; Giachetti et al. 2011; Jiang and LeBlond 1992; Majd and Sanders 2014; Yavari-Ramshe and Ataie-Ashtiani 2015, and references within]. For the water wave propagation part, more advanced depth-averaged models, based on Boussinesq-type equations (non-hydrostatic pressure) that are weakly dispersive [e.g. Kirby et al. 2013; Popinet 2015; Zhou et al. 2011] are available. In particular, these non-hydrostatic models are necessary at least to accurately simulate tsunami wavelengths of about the same order of magnitude as the water depth [Gylfadóttir et al. 2017; Kirby et al. 2022 for a benchmark; Yavari-Ramshe and Ataie-Ashtiani 2016].
Submarine landslides are known to generate waves with wavelengths of a few kilometers [Papadopoulos and Kortekaas 2003]. In the seismo-volcanic context of Mayotte, the potential areas of instabilities are close to the island (as shown by the presence of confirmed past submarine instabilities on the slope and foot of the island [Thinon et al. 2021]). In these conditions, the water wave wavelengths could be about the same order of magnitude as the water depth (wavelengths from 1000 m to 5000 m [Lemoine et al. 2020b]). Consequently, to investigate the impact of tsunamis generated by submarine landslides, we need to use models that take into account the landslide dynamics but that also solve Boussinesq-type equations for the tsunami propagation. These models do not yet include an accurate description of the source (for instance accounting for correct topography effects [Delgado-Sánchez et al. 2020; Ma et al. 2015]) together with a precise simulation of the wave propagation. For instance, in his analysis of landslide-generated tsunamis in Mayotte with the GEOWAVE software, Roger [2019] first simulated the submarine landslide and then used the corresponding deformation as a source term for the tsunami simulation with the FUNWAVE model [Shi et al. 2012]. This strategy presents two drawbacks: (i) the landslide and the wave generation are not simulated in a single simulation and (ii) the shallow-water assumption inherent to FUNWAVE is not valid at the beginning of the simulation. To overcome this issue, we propose a framework for coupling two near-field and far-field numerical models as done for example by Grilli et al. [2019], each model being efficient to describe a specific part of the physical processes involved. We thus combine the HySEA model [Macías et al. 2017], used to describe the submarine avalanche and initiate the waves, with the widely used Boussinesq FUNWAVE-TVD model [Abadie et al. 2020; Grilli et al. 2019; Le Roy and Legendre 2017; Rohmer et al. 2017; Shi et al. 2012], used to propagate the wave and compute the flooding on the Mayotte coast. To implement this approach, we: (i) analyze morphological data offshore Mayotte to define scenarios of potential submarine landslides by reconstructing precise topography, (ii) process numerical simulation of the submarine landslide including a detailed description of the sources and of the granular flow, (iii) simulate the waves generated by the landslide, its propagation, and the coast inundation and discuss the pertinence of the combination of models.
2. Submarine landslide scenarios
The two islands of Mayotte (Petite Terre and Grande Terre) are surrounded by a well-developed shallow submarine shelf (defining the lagoon) extending offshore from 0.5 km east of Petite Terre to 17 km at certain locations around Grande Terre (Figure 1). The shelf-to-slope transition occurs at depths of 30 to 100 m. It corresponds to a significant topography slope break, from shallow slopes on the shelf (<9°) to flanks with maximum slopes of 25° to 60° locally. The slopes then decline away from the shelf-break, towards the more subdued topography of the surrounding area. In deeper water, many gullies and canyons (up to 150 m depth) form tributaries of large valleys. These canyons and discontinuities are present all around the island and may control the circulation of sediments.
In their exploratory study, Lemoine et al. [2020b] considered 62 scenarios around Mayotte that could generate tsunamis (32 instability scenarios located in Figure S1, 19 earthquake scenarios and 11 caldera collapse scenarios) and a sensitivity study was carried out on the density of collapsed material and tides. They concluded that the most impactful scenarios were associated with gravitational instabilities located on the slopes close to the reef and at the foot of the slope to the east of Petite Terre (see Figure S1). Repeated earthquakes located between 5 and 15 km from the coast east of Petite Terre could weaken the sedimentary pile and trigger tsunamigenic gravitational instabilities. The results of Lemoine et al. [2020b], combined with the location of the seismo-volcanic crisis, led us to focus our attention on the eastern coast of Mayotte. We performed a morphological analysis of the submarine slopes east of Mayotte using new bathymetric data collected in 2019 [MAYOBS 1 cruise in 2019, Feuillet et al. 2021] but we also considered scenarios on the western part of Mayotte that were considered by Lemoine et al. [2020b]. The extent, the depth, and the geometry of collapse structures were constrained by a geomorphological analysis of bathymetric surveys. The collapse structure was then constructed by digging into the present submarine slope within the defined extent. Sensitivity tests on the volumes and associated geometries of the collapsing mass are presented in Section 6.1, showing that they strongly influence wave generation. Thus, we consider 8 scenarios with different volumes and depths for numerical simulations to get an idea of the magnitude of the potential generated tsunami. The list of scenarios is not exhaustive and other scenarios could be considered in the future. We summarize the characteristics of the collapse scenarios in Table 1 [with reference to the scenarios used in Lemoine et al. 2020b] and in Figures 1 and 2.
Left column (a–g): location of scenarios of instabilities on bathymetry and associated cross-sections (the black curve represents the bathymetry before sliding and the red and orange curves represent the bathymetry after sliding) (a) Piton 200 (red) and Piton 100 (orange), (b) 3 Lobes, (c) south slope, (d) north slope, (e) west slope, (f) west Canyon, (g) new volcano; right column (h–n): thickness of the deposits calculated using HySEA for seven scenarios: (h) Piton 200, (i) 3 Lobes, (j) south slope, (k) north slope, (l) west slope, (m) west Canyon, (n) new volcano.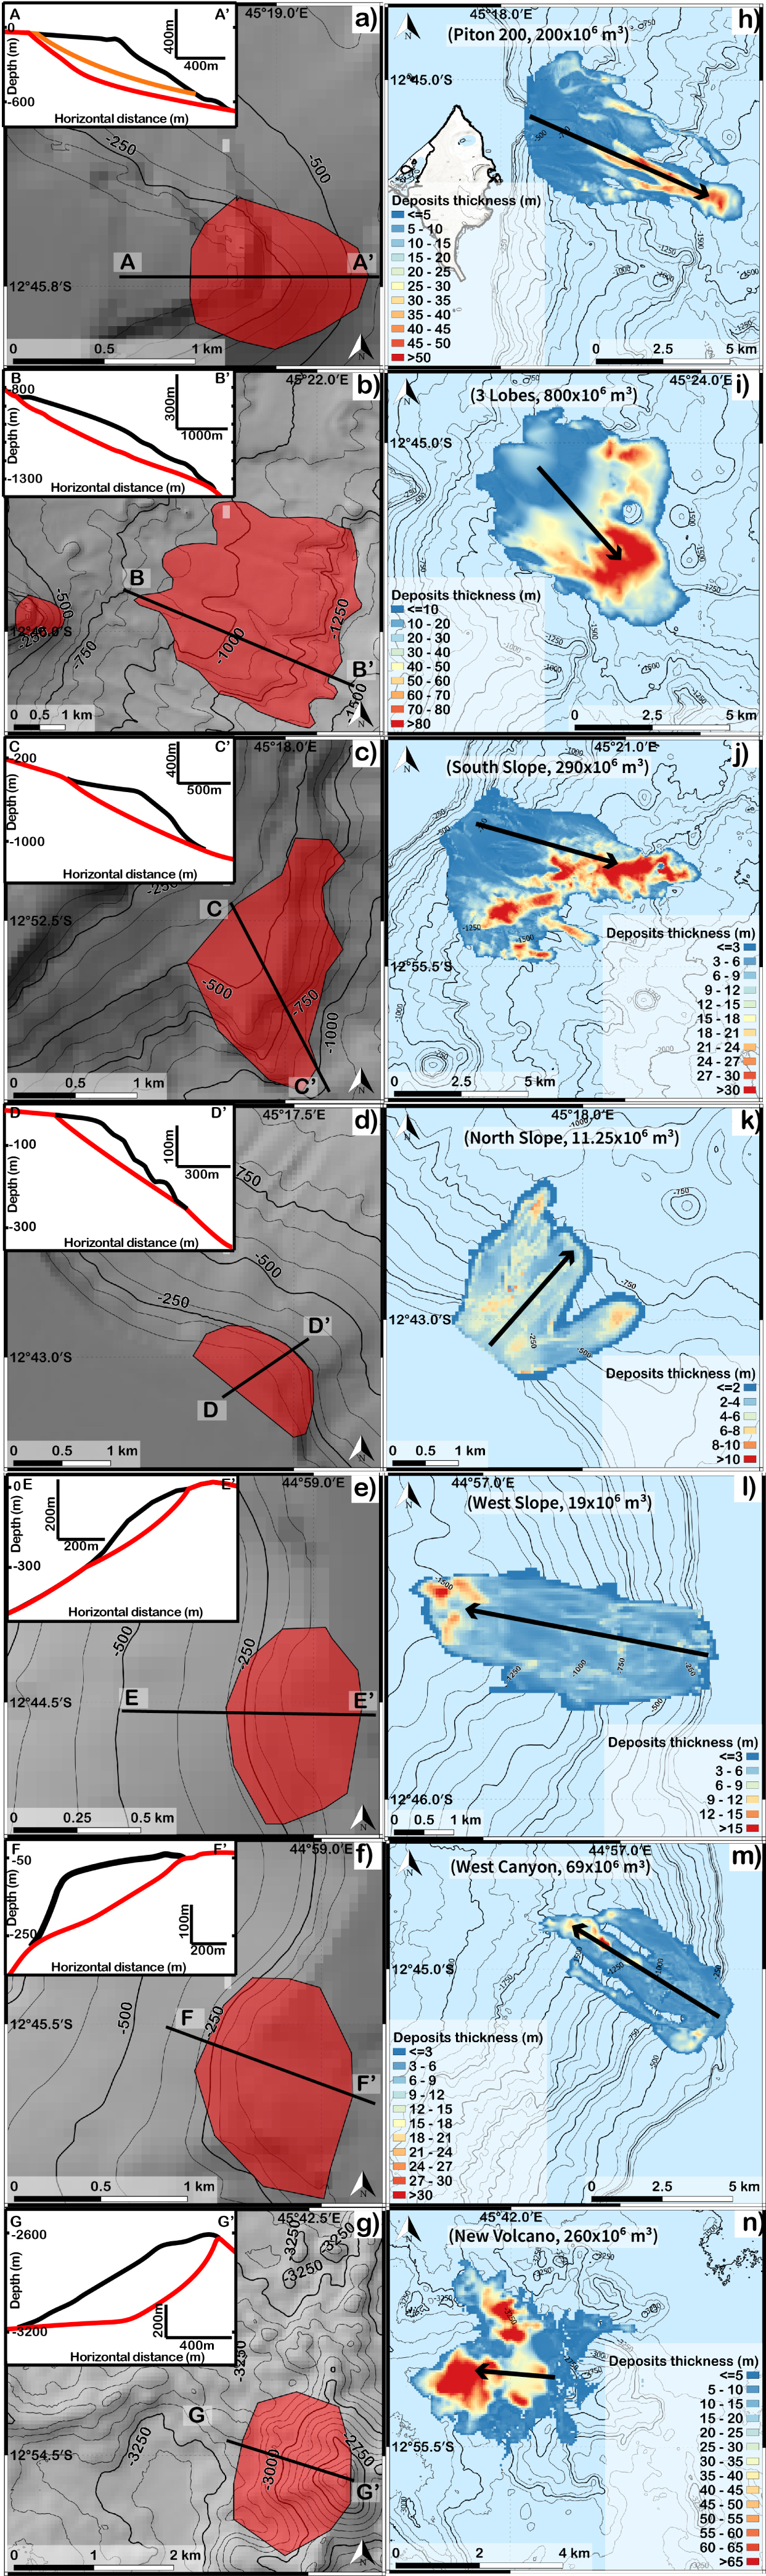
Characteristics of the eight scenarios (volume, bathymetry) and parameters (friction angles and coupling time) used for the numerical simulations
| Type of source | Name of the scenario | Volume (106 m3) | Bathymetry shallower/ deeper (m) | Pouliquen friction angle (deg.) | Coupling time (s) | Scenario with comparable volume and placement [Lemoine et al. 2020b] | ||
|---|---|---|---|---|---|---|---|---|
| 𝛿1 | 𝛿2 | 𝛿3 | ||||||
| Active volcano | New volcano | 260 | − 2600∕−3150 | 6 | 16 | 8 | 26 | Sce_47 |
| Bottom of the slope | 3 Lobes | 800 | − 850∕−1350 | 6 | 16 | 8 | 28 | Sce_35 |
| East reef | Piton 200 | 200 | − 50∕−600 | 7 | 17 | 9 | 35 | Sce_48 |
| Piton 100 | 100 | − 50∕−500 | 7 | 17 | 9 | 30 | Sce_36 | |
| North slope | 11.25 | − 50∕−250 | 10 | 20 | 12 | 28 | Sce_53 | |
| Bottom of east reef | South slope | 290 | − 400∕−1000 | 6 | 16 | 8 | 30 | Sce_42 |
| West reef | West Canyon | 69 | − 30∕−300 | 8 | 18 | 10 | 20 | Sce_40 |
| West slope | 19 | − 30∕−300 | 9 | 19 | 11 | 23 | Sce_39 | |
The volumes of the landslide scenarios vary from 11.25 × 10⁶ m3 to 800 × 106 m3. Six scenarios involve shallow depths: Piton 100, Piton 200, North Slope and South Slope to the east of Petite Terre and West Slope and West Canyon to the west of Grande Terre. Two scenarios are also considered at greater depths: the 3 Lobes scenario involves the morphological lobes close to the seismic swarm at middle depth and the New Volcano scenario involves the new submarine volcano at 3300 m depth. The Piton 200 scenario is located at the shelf to slope transition close to Petite Terre (2.5 km) at depths between 50 and 600 m below sea level. It probably involves a volcanic morphology (one volcano or a complex of volcanic cones) and a volume of 200 × 106 m3 (Figure 2a). The Piton 100 scenario is similar to that of Piton 200 but with a shallower profile and a volume of 100 × 106 m3. The 3 Lobes scenario is constrained by morphological discontinuities and gullies east of Petite Terre at depths between 850 and 1350 m below sea level and involves a volume of 800 × 106 m3 (Figure 2b). The South Slope (Figure 2c) and North Slope (Figure 2d) scenarios are located on the steep slopes at the shelf break at depths between 400 and 1000 m and 50 and 250 m respectively and involve volumes of 290 × 106 m3 and 11.25 × 10⁶ m3. The West Slope (Figure 2e) and West Canyon (Figure 2f) are both located to the west of Grande Terre at depths between 30 m and 300 m and involve volumes of 19 × 06 m3 and 69 × 106 m3. The New Volcano scenario involves the western part of the volcano (that will flow towards the west). It is located at depths between 2600 and 3150 m and involves a volume of 260 × 106 m3 (Figure 2g).
3. Numerical models and coupling
Let us briefly describe the two numerical models, HySEA and FUNWAVE-TVD, that will be used to simulate landslide dynamics and wave generation, and wave propagation, respectively, as well as the strategy adopted to couple these models.
3.1. HySEA
The two-layer hydrostatic HySEA code is a 2D extension of the model proposed by Fernández-Nieto et al. [2008], but using Cartesian coordinates. It describes submarine avalanches and the water motion on top of them. As in most landslide-generated tsunami models, the fluid and the granular mass are assumed to be incompressible and homogeneous. This means that the landslide is considered as an effective media described by an empirical rheological law, as discussed below. Therefore, the natural complexity of the phenomena is not fully taken into account. For instance, we do not take into account material heterogeneity, segregation and fragmentation processes, bed erosion and incorporation of air and/or water, or density variations that can be caused by the expansion or contraction of the material and their impact on pore fluid pressure [see Delannay et al. 2017 for a review of processes]. HySEA was developed by the EDANYA group [Asunción-Hernández et al. 2012; Asunción et al. 2013; Castro Díaz et al. 2005, 2006, 2008a, b; Macías et al. 2015] and has been successfully used to simulate tsunamis generated by landslides [Kirby et al. 2022 (for a benchmarking exercise); Macías et al. 2021; Esposti Ongaro et al. 2021]. From the depth-averaged equations, six unknowns are solved by the model, (h1,u1x,u1y) and (h2,u2x,u2y), representing the vertical height and horizontal velocity of the fluid (index 1) and granular layer (index 2), respectively, averaged in the vertical direction. The HySEA code is based on an efficient hybrid finite-volume-finite-difference numerical scheme on GPU architectures [Macías et al. 2020]. The equations are solved numerically using a relaxation method, as described in Escalante et al. [2019].
The appropriate rheology for subaerial and submarine landslides is still an open issue. Indeed, the high mobility of these gravitational flows [Lucas et al. 2014] and their complex deposit shape [Kelfoun et al. 2008] have only been reproduced by empirical laws with no clear physical origin. The empirical laws used in submarine landslide simulations include the simple Coulomb friction law [Brunet et al. 2017], the Voellmy rheology [Salmanidou et al. 2018], a retarding stress [Giachetti et al. 2012], the viscous law [Grilli et al. 2021], the friction-weakening law [Lucas et al. 2014], and the 𝜇(I) rheology [Brunet et al. 2017], the latter being derived from lab-scale experiments on granular flows. The 𝜇(I) rheology, resulting in the Pouliquen and Forterre [2002] flow law in depth-averaged models, includes the dependence of the friction coefficient on the velocity and thickness of the flow. Note that the thickness dependency behavior is qualitatively similar to that of the retarding stress. Following Brunet et al. [2017], we use this law here with empirical parameters. Indeed, as in most landslide simulations, the parameters of the laws have no physical meaning but result from empirical fits obtained to reproduce past events. The frictional rheology and in particular 𝜇(I) made it possible to reproduce the main characteristics of landslide dynamics and deposits [Brunet et al. 2017; Le Friant et al. 2003; Lucas et al. 2014; Moretti et al. 2015].
In depth-averaged models with frictional rheologies, the empirical friction coefficient 𝜇 = tan(𝛿), with 𝛿 the constant or flow-dependent friction angle, can be seen as a representation of the mean dissipation during the flow [Mangeney et al. 2007a; Pouliquen 1999; Pouliquen and Forterre 2002]. Pouliquen and Forterre [2002] developed a friction law for the whole range of possible thicknesses and Froude numbers (Fr) even though the experimental data only concerned steady and uniform flows. Depending on the value of the Froude number, the flow is assumed to be in a dynamic, intermediate or static regime and the friction coefficient can be written in each regime as a function of four parameters: L, which is a characteristic length of the grain diameter, and 𝜇1 = tan(𝛿1), 𝜇2 = tan(𝛿2) and 𝜇3 = tan(𝛿3), which are the tangents of the critical angles, 𝛿1, 𝛿2 and 𝛿3. The angle 𝛿3 corresponds to the asymptote of the curve 𝜃start(h), representing the slope angle at which a layer of thickness h is mobilized. Two other empirical parameters 𝛽 and 𝛾 appear in the rheological law describing (i) the critical Froude number above which the flow is assumed to be in the dynamic regime (Fr >𝛽) and (ii) the transition between the static and dynamic regime (𝛾), respectively. Several studies have shown that this law well reproduces laboratory experiments on granular flows such as erosion/deposition waves [Edwards and Gray 2014; Edwards et al. 2017, 2019; Mangeney et al. 2007b; Russell et al. 2019] or self-channeling flows and levee formation [Mangeney et al. 2007a; Rocha et al. 2019]. It has also made possible the production of conclusive results for submarine landslides in the Antilles [Brunet et al. 2017; Le Friant et al. 2003]. More precisely, a detailed comparison of the simulated and observed deposit of a submarine avalanche showed that the simulation with the 𝜇(I) rheology better reproduces observations than the simple Coulomb friction law [Brunet et al. 2017]. Following these studies and in order to only have one free empirical parameter (𝜇1), we assume that 𝛿2 −𝛿1 = 10° and 𝛿3 −𝛿1 = 2° are constants, their values corresponding to those measured at the lab-scale, and we fix L = 1 m. We also fix the parameters 𝛽 = 0.136 and 𝛾 = 10−3 as in Pouliquen and Forterre [2002] and Mangeney et al. [2007a]. Note that the value of 𝛾 has been shown to poorly affect the results in these studies. Finally, the value of 𝜇1 is first based on the volume-dependent friction law of Lucas et al. [2014], 𝜇1 = tan(𝛿1) = V−0.0774, empirically defined to fit the deposit of a series of almost dry landslides of different volumes V . We then subtract approximately 6° from 𝛿1 as was done empirically in Peruzzetto et al. [2019] and Moretti et al. [2015] to roughly account for water effect. Table 1 summarizes the angles used for each scenario. The effect of the friction between the landslide layer and the water layer mf is small in our case as discussed in Section 6.1 [Macías et al. 2021].
In our simulations, as in most landslide simulations in the literature [Yavari-Ramshe and Ataie-Ashtiani 2016], the initial mass is instantaneously released from rest at the initial instant, without considering the transition phase from a coherent mass to a granular flow.
3.2. FUNWAVE-TVD
The FUNWAVE-TVD code, widely used in the literature [e.g. Grilli et al. 2019], employs an enhanced version of the fully non-linear Boussinesq equations derived by Wei et al. [1995]. Chen [2006] improved the original equations of Wei et al. [1995] in order to include the vertical vorticity, which is well suited to describe wave-induced currents [Chen et al. 2003]. They also incorporated the adaptive vertical reference level of Kennedy et al. [2001] to improve the non-linear representation of the model. The FUNWAVE-TVD code solves either fully non-linear equations in a Cartesian framework [Shi et al. 2012] or a weakly non-linear spherical coordinate formulation with Coriolis effects [Kirby et al. 2013] to take into account Earth curvature. It uses a TVD shock-capturing algorithm with a hybrid finite-volume and finite-difference scheme. Following the approach of Tonelli and Petti [2009], wave breaking is detected when the ratio between wave height and water depth exceeds 0.8. The subsequent coastal inundation is simulated by cancelling off dispersive terms, hence solving the non-linear shallow-water equations. The third order strong stability preserving (SSP) Runge–Kutta scheme is adopted for time stepping.
The code is fully parallelized using the Message Passing Interface (MPI) protocol and efficient algorithms, ensuring a substantial acceleration of the computations with the number of cores. For operational uses, FUNWAVE-TVD has received many convenient features, such as the use of nested grids to refine the simulations in the interest areas or the use of heterogeneous Manning coefficients to characterize bottom friction.
3.3. Coupling between HySEA and Funwave-TVD
Coupling two numerical codes is a complex task because they are generally developed using different numerical schemes, computing libraries and language versioning. This is the case with HySEA and Funwave-TVD. To prevent any intrusive coupling option that could produce errors and numerical instabilities, we choose to run each of them sequentially, so that after simulating the initiation of the landslide and the associated waves with HySEA, and at a time tc (coupling time), HySEA results are passed on as initial conditions for FUNWAVE-TVD. This choice ensures that all parameters (wave velocities and free-surface elevation) are correctly transmitted from one numerical environment to the other. In order to explain our choice of tc, we represent, for the Piton 200 scenario, the free-surface elevation computed by HySEA along the main propagation line, from 0 to 90 s, roughly the time when the waves have vanished (Figure 3). We can identify in Figure 3 various times:
Evolution in time of the sea-surface elevation along a longitudinal plane collinear to the sliding direction. Source Position: location of the initial movement; tc1: time at which the wave is entirely formed at the free surface; tc2: time at which the maximum of energy is transmitted to the free surface.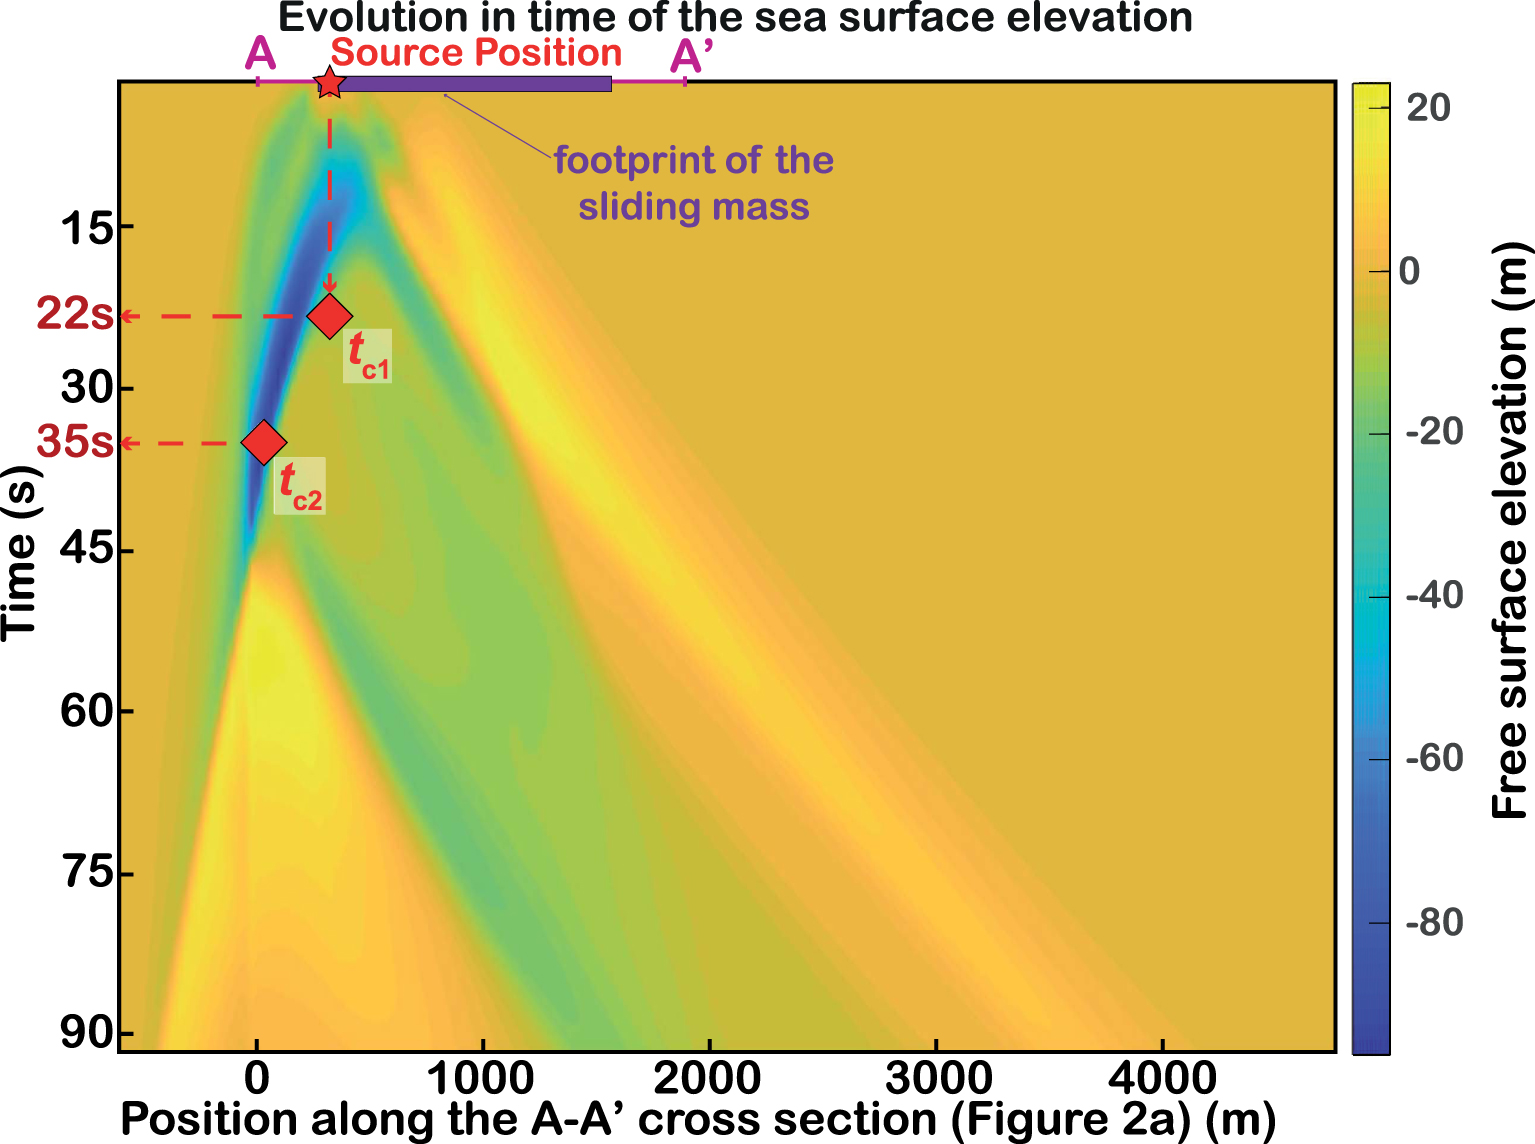
- early times when the first wave is emerging and is not yet formed;
- the time tc1 when the landslide has moved enough to generate a completely shaped wave at the sea surface located directly above. At this time, around 22 s, the wave amplitude has completely returned to zero (orange color) after negative (blue color) then positive (yellow colors) values;
- the time tc2, around 35 s, when the wave has reached a maximum of amplitude (dark blue color) at the free surface surrounding the source area. At tc2, the initial first wave has grown and it can be considered to be completely formed because of the level of energy transmitted by the granular flow;
- later times where secondary waves are propagating.
To define tc for each scenario, we consider (i) situations where the sliding mass has transmitted a sufficient level of energy to the free surface to generate a complete wave and (ii) minimal errors introduced by the HySEA hydrostatic approximation when simulating wave propagation. In order to be sure to form a maximal amplitude wave (and so being conservative enough in terms of final impacts) while minimizing non-hydrostatic effects during propagation, we decided to fix tc at the value of tc2. Table 1 summarizes the coupling times chosen for each scenario.
4. Model setup
The numerical simulations of landslide and sea-surface deformation were carried out under the following conditions:
- wave propagation was simulated in mean high water springs (+1.92 m at Dzaoudzi to the Mayotte vertical datum IGN1950 following the RAM 2017), which, in most cases, reduces the protective effect of the reef [Thran et al. 2021], compared to the other reference tide levels (e.g. mean high water neaps or mean tide level with values of 1.02 and 0.35 m/IGN1950 respectively),
- a global island subsidence of 0.15 m linked to the deflation phenomenon that has been observed since summer 2018 [Cesca et al. 2020; Lemoine et al. 2020a; Feuillet et al. 2021], without taking into account the west-east differential visible in GNS measurements,
- two DTM (Digital Terrain Model) with spatial resolutions of 50 m and 10 m were used. They are the same as those in Lemoine et al. [2020b]. They are based on: Gebco 2014 (https://www.gebco.net), HOMONIM SHOM DTM (100 m resolution, https://data.shom.fr), MAYOBS 1 [Feuillet et al. 2021, 30 m resolution], bathymetric surveys of SHOM (25 m resolution, https://data.shom.fr), and litto3D (lidar data at 1 m resolution, https://data.shom.fr). The 50 m DTM is used for the landslide and wave propagation simulation, and the 10 m DTM for the inundation. The mesh resolution remains constant throughout the domain. It is either 50 m when performing the large-scale simulation for the propagation of the waves and 10 m when performing the inundation simulation. The extent of the 10 m mesh grid is however smaller than that of the 50 m mesh grid to limit simulation time and focus on specific areas,
- in FUNWAVE-TVD, one-way nested grids are used to simulate inundation together with wave propagation. The 10 m DTM receives as boundary conditions the free-surface elevation and flow velocities from the simulation on the 50 m DTM. Absorbing layers are used as boundary conditions for the wave propagation simulation on the 50 m DTM,
- in FUNWAVE-TVD, the spatial changes in the bottom friction (related to land use) are taken into account by the model using Manning’s roughness coefficients, n [see details in Lemoine et al. 2020b]. Typical values of n are determined from the literature [see e.g. Bunya et al. 2010] and vary for example between 0.02 s/m1∕3 for the deep ocean and 0.14 s/m1∕3 for the mangrove forest. Note that n is constant in HySEA (see sensitivity test in figure of Section 6.1),
- in FUNWAVE-TVD: the wave breaking approach of Tonelli and Petti [2009] is activated and the simulations at 10 m resolution are conducted with a one-way nested grids (DTM at 10 m receives as boundary conditions the free-surface elevation and flow velocities from the simulation at 50 m resolution). For the boundary conditions of the model at 50 m resolution, we consider absorbing layers.
For the eight scenarios, the landslides and the tsunamis (generation, propagation and inundation phases) were first simulated with a 50 m mesh grid surrounding the whole island of dimensions 151.2 km by 110.4 km (part of it is represented in Figure 4). The results are presented with maps of the extension of landslide deposits (Figure 2h–n) and maps of maximum sea-surface elevation due to the tsunami including Grande Terre and Petite Terre (Figure 4a–h). In this paper, the term sea-surface elevation refers to the deformation in sea level caused by the generated tsunami and not an absolute elevation value. For the most impactful tsunamis, the one-way nested grid approach was used for a realistic simulation of the flooding (10 m resolution) in terms of extension, water depth (sea-surface elevation—bottom elevation) and currents. For these simulations, we focus on strategic areas provided by the local authorities: (a) Dzaouzi, (b) Airport, (c) North-east Petite Terre, (d) Mamoudzou, (e) Vicinity of Koungou (Figure 1).
Maximum sea-surface elevation (MSSE) in meters calculated for the eight scenarios (resolution: 50 m): (a) Piton 200, (b) Piton 100, (c) 3 Lobes, (d) new volcano, (e) north slope, (f) south slope, (g) west Canyon and (h) west slope. The volumes of the landslides and the coupling times used are indicated for each scenario. The bold black line is the Histolitt coastline from SHOM.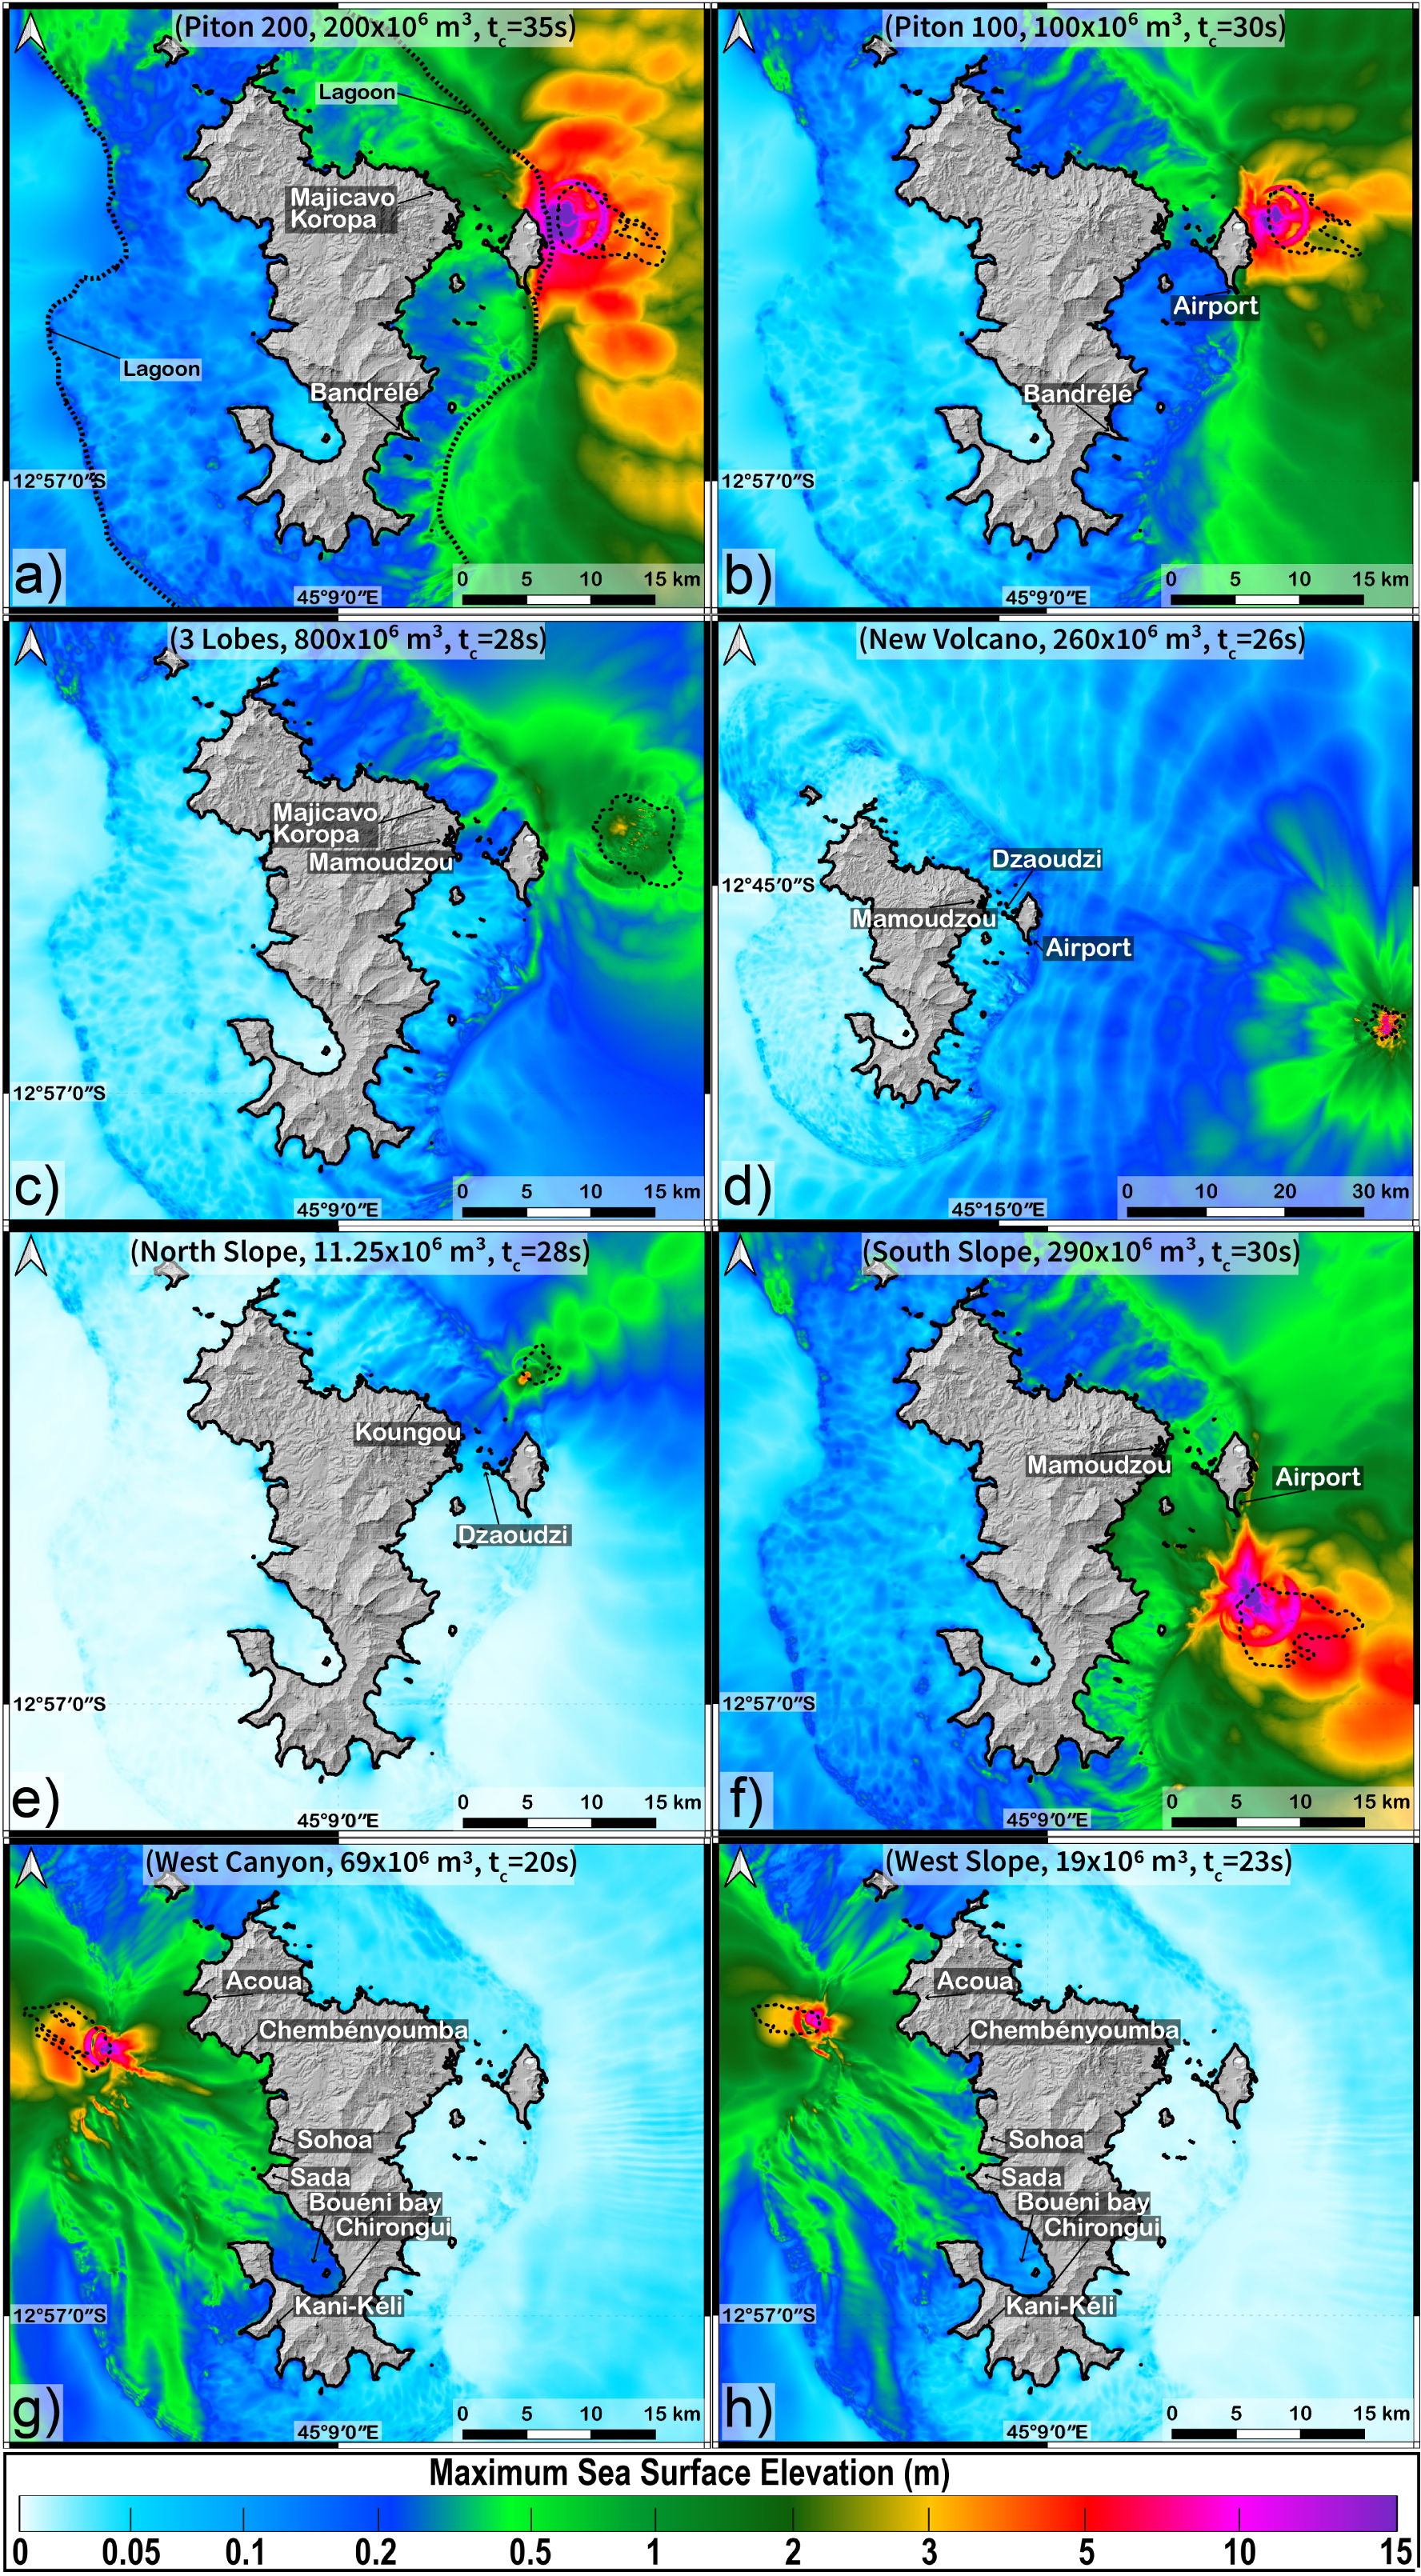
The simulations performed with FUNWAVE-TVD were run on a cluster composed of 4 to 8 nodes, each with 24 CPU processing cores. Simulations on the 50 m DEM take between 15 and 36 h. Simulations on the 10 m DEM last between 28 and 50 h.
5. Results
5.1. Landslide simulation at low resolution (50 m)
We first simulate the submarine landslides and tsunamis with HySEA. For the Piton 200 scenario, the velocity of the front of the avalanche varies from 53 m/s at 40 s to 25 m/s at 150 s. Considering the steep slope and the volume of the slide, these velocities values seem to be around what can be found in the literature, even if 53 m/s is at the upper limit for submarine slides. Indeed, the velocity for the landslide of the 1741 Oshima–Oshima tsunami was estimated to be around 100 m/s [Satake 2001], which is similar to the velocities of the subaerial flank collapse of Mount St Helens [70 m/s Voight et al. 1983]. Other studies show lower slide velocity values such as Ward and Day [2003] who estimated an average velocity of 40 m/s for Ritter Island (supposedly, the front is faster). In our simulation, the landslide stops at 260 s, extending over an area of 28 km2 with a maximum thickness of 52 m (Figure 2h). We simulated the landslide deposits for all 8 scenarios (Figure 2h–n). The deposit extension varies from 12 km2 to 36 km2 and the maximum deposit thicknesses vary from 30 m to 90 m. The runout distance (distance between scar highest point and deposit front) varies from 2.3 km to 9.2 km. As expected, higher friction angles induce smaller runouts and deposit areas (see Section 6.1). The topography strongly controls the dynamics and emplacement of the landslide (Figure 2h–n) as found for instance by Peruzzetto et al. [2019, 2021] and Fischer et al. [2012].
5.2. Tsunami propagation simulations at low resolution (50 m)
The sea-surface elevation at low resolution (50 m) for the 8 landslide scenarios (Figure 4) is simulated with FUNWAVE-TVD:
- Piton 200 (V = 200 ×106 m3): This scenario is located in shallow water. Results of the numerical simulations show an impact offshore the east coast of Petite Terre and mainly on the northeast coast of Grande Terre (Figure 4a). The shallow depth of the landslide (between 50 and 600 m) and its location close to Petite Terre lead to sea-surface elevations at the coasts of more than 10 m northeast of Petite Terre in uninhabited areas (with a maximum at 15 m, 19 m very locally) and 2.3 m to the northeast of Grande Terre near Majicavo Koropa, an inhabited area (Figure 4a).
- Piton 100 (V = 100 ×106 m3): The Piton 100 scenario is located at the same place as the Piton 200 scenario but only half of the volume is involved. Figure 4b shows sea-surface elevations at the coasts of maximum 10 m northeast of Petite Terre (uninhabited area) and 1.2 m northeast of Grande Terre (inhabited area). Off the airport, the maximum sea surface recorded is 2.3 m while it is 1.2 m northeast of Grande Terre and 0.4 m at the N4 road. Note that reducing the volume of the landslide by two does not decrease the sea-surface elevation by the same factor (Figure 4b). Off the coast of Grande Terre, where the sea-surface elevation was between 1 m and 3 m in the Piton 200 scenario, the maximum difference between the 100 and 200 scenarios is about 0.5 m. In the area close to the source of the landslide (northeast of Petite Terre) these differences are greater than 1 m or even 3 m locally where sea-surface elevations calculated for Piton 200 were between 5 m and 10 m.
- 3 Lobes (V = 800 ×106 m3): This scenario mobilizes the largest volume and is located at a greater depth. This scenario therefore has less impact than other scenarios on the Mayotte coasts (Figure 4c). Only the eastern coast of Petite Terre appears to be impacted with water elevations up to almost 2 m reached in the uninhabited areas northeast of Petite Terre. For Grande Terre, the elevations at the coasts are about 1 m (near Majicavo Koropa) and 1.3 m locally near Mamoudzou (Figure 4c).
- New Volcano (V = 260 ×106 m3): This scenario investigates a landslide on the flank of the new volcano located 50 km east of Mayotte at more than 3000 m below sea level (Figure 4d). Although the volume is high (260 × 106 m3), the sea-surface elevation off the coasts of Mayotte is low. We observe that the maximum sea-surface elevation reaches 0.7 m very locally on the east coast of Petite Terre. Offshore Mamoudzou, the maximum elevation of the sea surface is 1 m locally but most of the values are less than 0.2 m (around 0.15 m). The maximum sea-surface elevations calculated offshore Dzaoudzi and the airport are 0.8 m and 0.5 m respectively (Figure 4d).
- North Slope (V = 11.25 ×10⁶ m3): This landslide scenario is located at a shallow depth and close to the reef, however it has little impact on the coasts of Mayotte with sea-surface elevations about 0.2 m offshore Koungou and Dzaoudzi, with local maximums at 0.7 m and 0.9 m respectively (Figure 4e).
- South Slope (V = 290 ×106 m3): This scenario investigates a landslide located south of Petite Terre. It has a strong impact on the east southeast coasts of Grande Terre and mainly on the east coast of Petite Terre. The location of the landslide near the entrance of the lagoon leads to a sea-surface elevation of more than 7 m southeast of Petite Terre in uninhabited areas and about 1.8 m off the coasts near Mamoudzou (inhabited area) (Figure 4f). The airport area is also fairly exposed with a maximum sea-surface elevation of 3.4 m.
- West Canyon (V = 69 ×106 m3): This scenario is located offshore the western coast of Grande Terre. It has a fairly limited impact off the west coast of Mayotte and has little or no impact off the east coast. The maximum sea-surface elevation reaches up to 4 m locally (Figure 4g). In the Sada and Sohoa region, the maximum sea-surface elevation reaches 2.4 and 2.8 m respectively. Offshore the Chembényoumba and the Acoua area, the maximum sea-surface elevations are 2.2 m and 2.1 m respectively.
- West Slope (V = 19 ×106 m3): This scenario located offshore the west coast of Grande Terre has a limited impact off the west coast of Grande Terre and no impact off the east coast. The maximum sea-surface elevations reach up to 3 m locally (Figure 4h). Offshore the Sada and Sohoa region, the maximum sea-surface elevation reaches 1.2 and 2 m respectively. Offshore Chembényoumba and Acoua, the maximum sea-surface elevations are 1.3 m and 2 m respectively.Table 2.
Times of arrival of the first tsunami wave at the gauges placed around Mayotte for each simulated scenario (locations of the gauges in Figure 1)
Scenario Airport Dzaoudzi Koungou Mamoudzou Bandrélé Piton 200 3′55′′ 8′35′′ 11′35′′ 8′25′′ 8′35′′ Piton 100 2′50′′ 9′30′′ 12′30′′ 11′30′′ 10′30′′ 3 Lobes 3′48′′ 12′28′′ 13′48′′ 14′08′′ 6′08′′ New volcano 6′46′′ 14′56′′ 17′46′′ 18′16′′ 11′26′′ North slope 4′28′′ 10′28′′ 9′28′′ 12′28′′ 15′28′′ South slope 5′30′′ 11′20′′ 15′30′′ 13′50′′ 7′10′′ Scenario Acoua Chembényoumba Sada Chirongui Kani-Kéli West Canyon 7′10′′ 9′ 10′50′′ 20′10′′ 20′40′′ West slope 6′13′′ 9′03′′ 10′43′′ 19′03′′ 20′53′′ - Piton 200 (V = 200 ×106 m3): 1 min after the start of the simulation, the first waves reach the east coast of Petite Terre (Figure 5a–d). The airport area is reached by waves in 3′55′′. At 6′, the first waves propagate in the lagoon towards the northeast of Grande Terre and Dzaoudzi. The waves reach the coasts of Grande Terre at 8′25′′ for the south of the east coast and 10′35′′ for the northeast coast. Mamoudzou is only hit by the waves at 11′15′′. At 20′, the waves have not yet reached the west coast of Grande Terre; they are just starting to propagate in this part of the lagoon. Note that the tsunami is not necessarily preceded by a withdrawal of the sea and that the first wave does not always have the highest elevation as seen on the pink plot (Figure 5d).
- South Slope (V = 290 ×106 m3): 2′ after the start of the wave propagation, the first waves reach the east coast of Petite Terre (Figure S2a–d). The airport area is reached by waves in 5′30′′, but the interior of the lagoon remains protected. Still at 5′30′′, the first waves propagate in the lagoon towards the southeast of Grande Terre and Dzaoudzi. The waves reach Dzaoudzi at 11′20′′, then continue to propagate in the lagoon and reach Mamoudzou in 13′50′′. 15′ after the beginning of the propagation of the waves, the northeast coast of Grande Terre is reached by the waves.
- West Canyon (V = 69 ×106 m3): 7′10′′ after the start of the landslide, the first waves reach the west coast of Grande Terre starting with the Acoua region, then the Chembeyoumba area at 9′ (Figures S3a–d). The waves then propagate in the Lagoon towards the southwest of Grande Terre. The Sada region is reached by the waves at 10′50′′ before the waves propagate in Bouéni bay and reach Chirongui at 20′10′′. Finally, the southwest coast of Mayotte is reached at 20′40′′ with the Kani-Kéli region.
5.3. Coastal flooding simulations and hazard mapping at high resolution (10 m)
To get precise results near the coast of Mayotte, high resolution simulations (10 m) were performed at the local scale for the Piton 200 and South Slope scenarios as they are the most impactful (Figure 4) in the area of the current seismo-volcanic activity. We described here the results for Piton 200 (V = 200 × 106 m3) which is the most impactful scenario. The results were post-processed to obtain the maximum water depth (Figure 6) and maximum flow velocities (Figure 7). Results for the South Slope scenario are shown in Figures S4 and S5.
Maximum water depths (MWD) with 10 m resolution for the Piton 200 scenario. The color scale represents the value of MWD calculated for each point: (a) Dzaoudzi and route N4, (b) airport and Pamandzi, (c) Mamoudzou, (d) northeast coast of Petite Terre, and (e) Koungou. The bold black line is the Histolitt coastline from SHOM.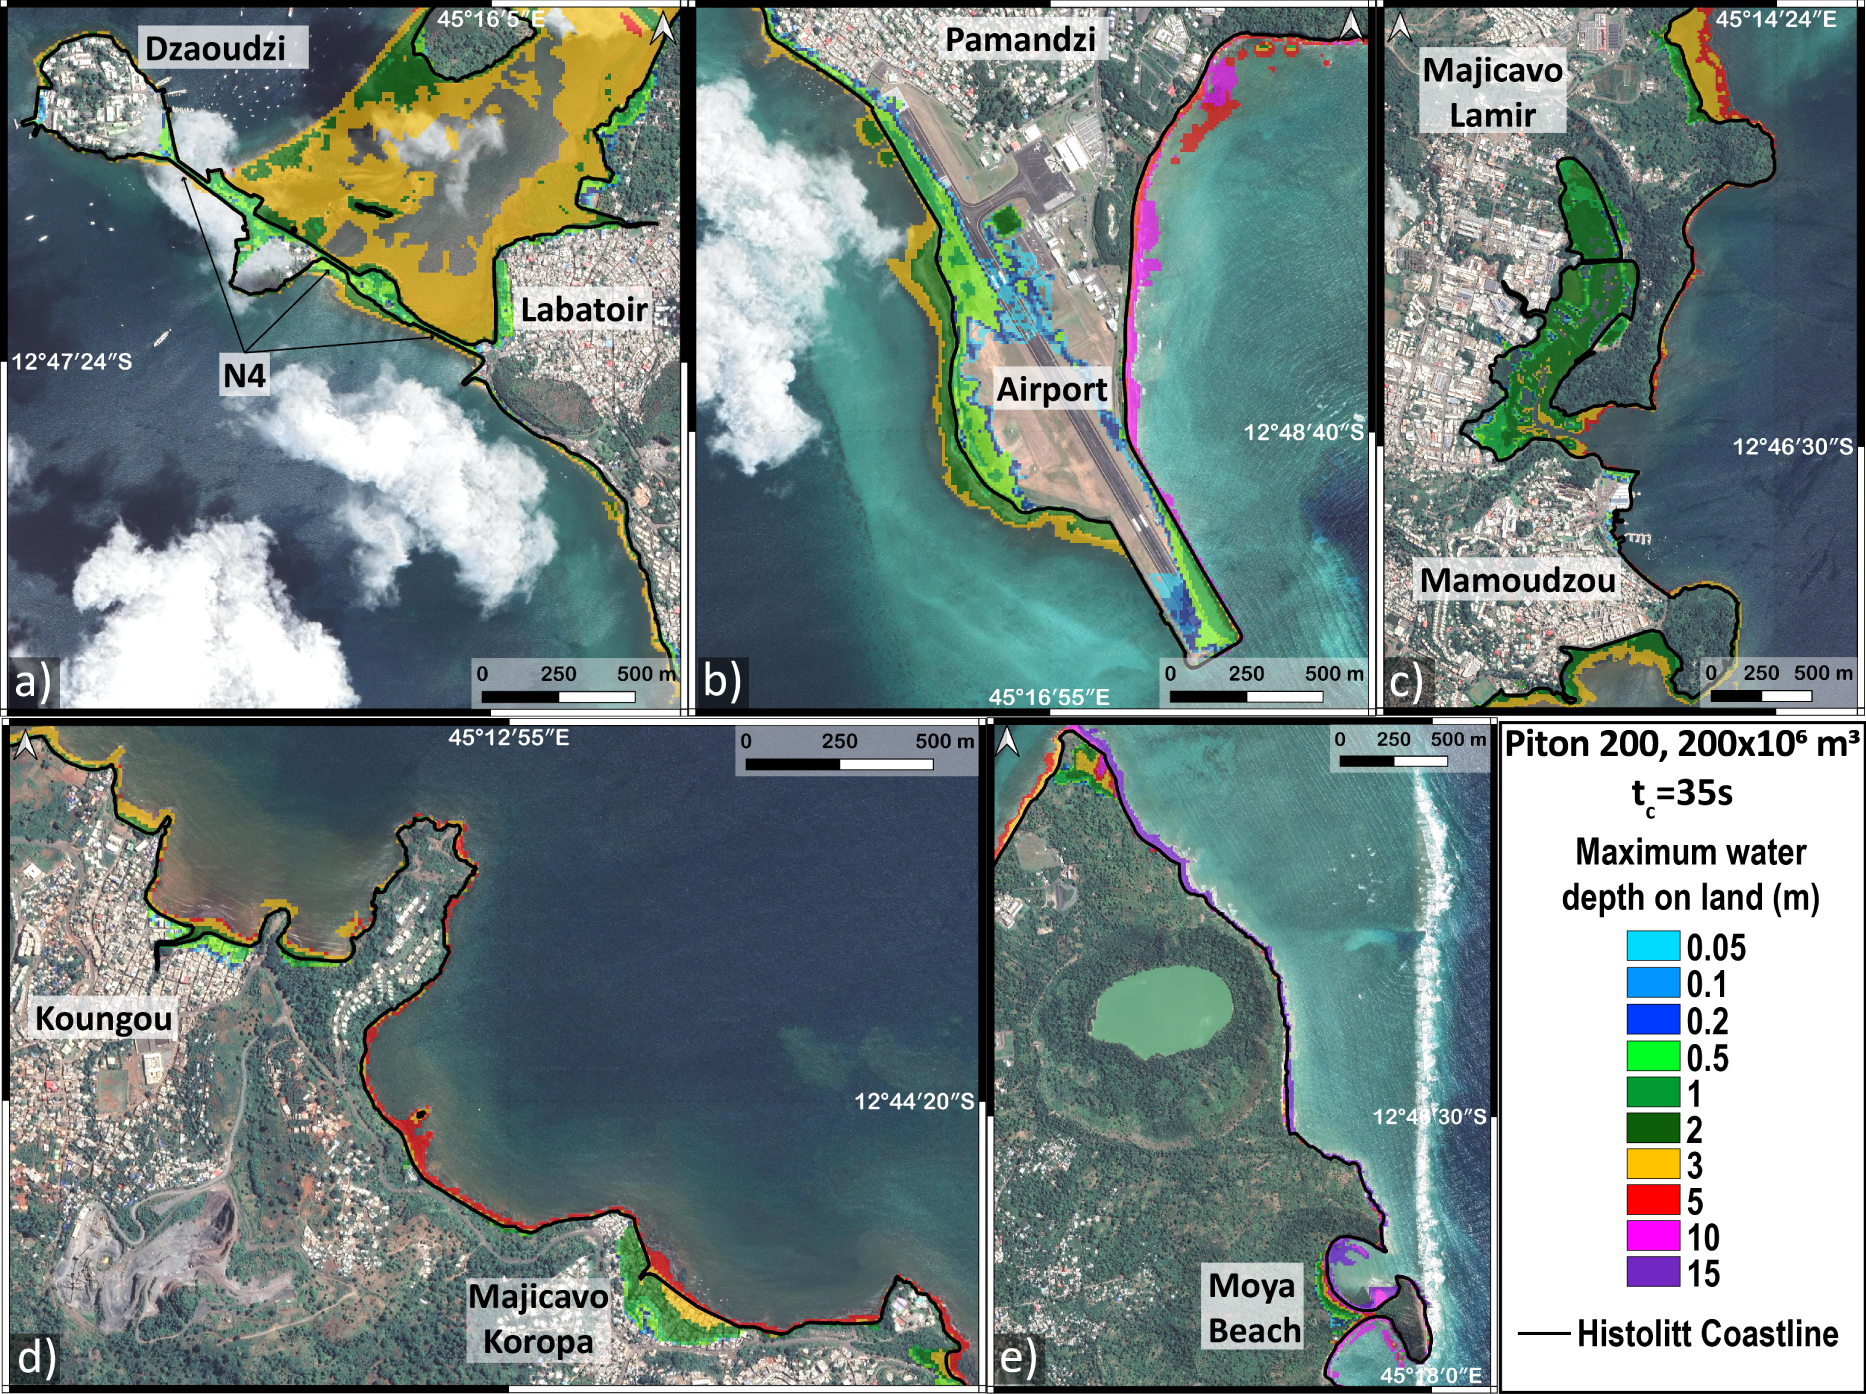
Maximum water velocities in m/s with 10 m resolution for the Piton 200 scenario. The color scale represents the value of the maximum water velocity calculated for each point: (a) Dzaoudzi and route N4, (b) airport and Pamandzi, (c) Mamoudzou, (d) northeast coast of Petite Terre, and (e) Koungou. The bold black line is the Histolitt coastline from SHOM.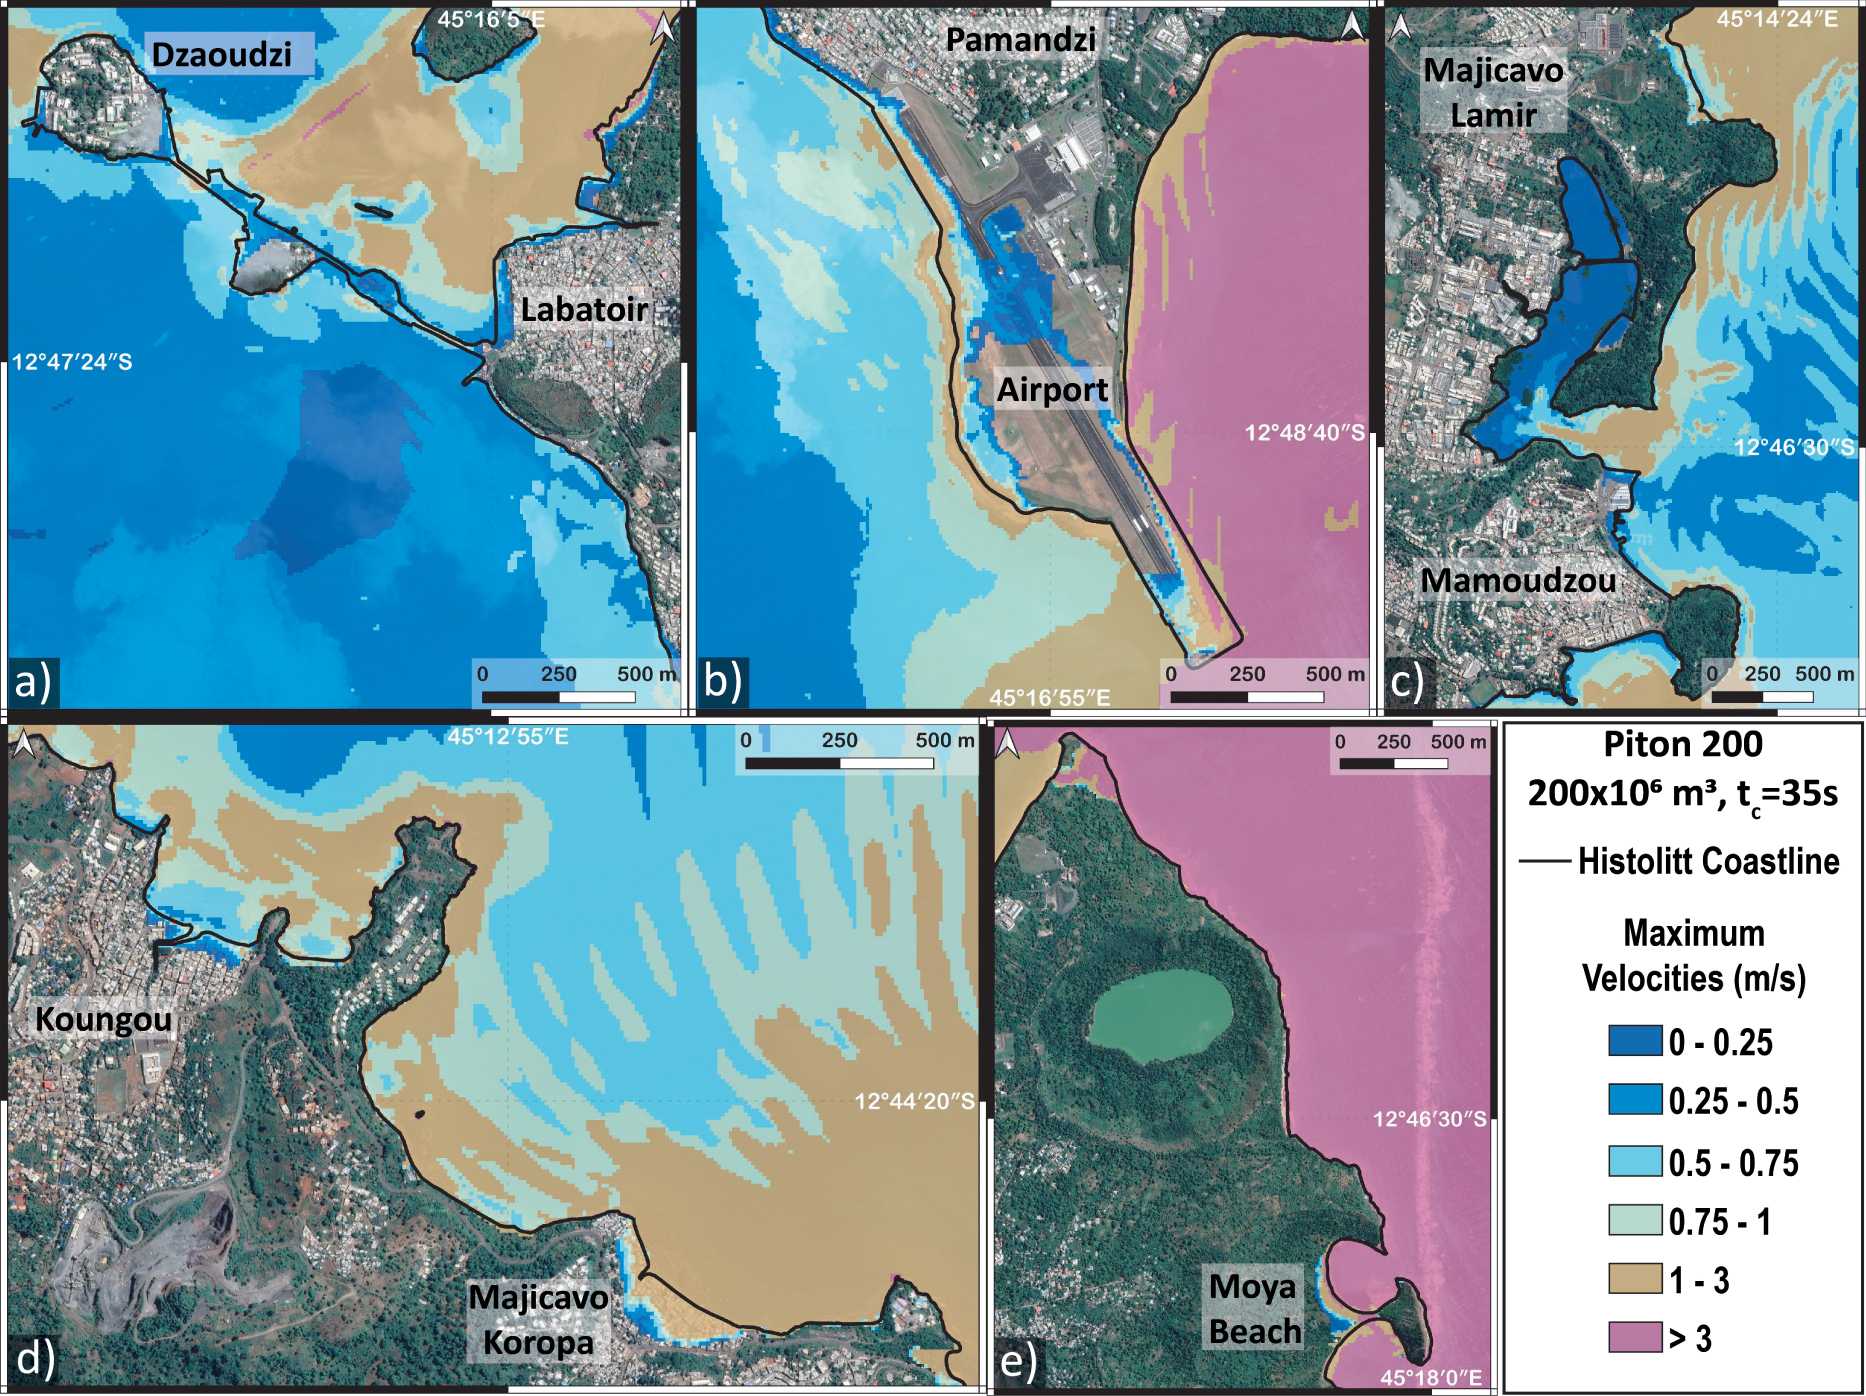
Figure 6a shows that the N4 road leading from Labatoir to Dzaoudzi is partially submerged with water depth varying from 10 cm to 1.5 m. The airport area is also subject to partial flooding with water depths of up to 35 cm on the runway and 1.50 m near the runway (Figure 6b). At Mamoudzou, maximum water depths of 1.50 m are reached (Figure 6c) north of the large Mamoudzou market. In the Koungou region, maximum water depths of 2.60 m are reached on the first buildings (such as in Majicavo Koropa, Figure 6d) and up to 1.90 m at a distance of 50 m from the shore. In the northern part of Petite Terre (Figure 6e), water depths of 6 m are reached in an uninhabited area and 8 m near Moya beach.
Figure 7 shows that the maximum velocities are reached on the eastern side of Petite Terre and can exceed 3 m/s close to the airport (Figure 7b) and Moya beach (Figure 7d). These values are lower in the lagoon, where the depth is greater, and do not exceed 0.75 m/s (e.g. Figure 7a). Finally, significant velocities of 1 to 3 m/s can be observed again near the coastline and on land in some bays such as Mamoudzou (Figure 7c) and Koungou (Figure 7d) as well as on the west coast of Petite Terre (Figures 7a and 7b).
6. Summary and discussion
6.1. Sensitivity analysis
As discussed above, significant uncertainties are associated with these landslide and tsunami simulations [Løvholt et al. 2020]. We have tested the effect of the main assumptions and parameters involved in the models: the landslide volume, the friction law and parameters involved, the Manning coefficient, and the hydrostatic approximation. When the friction coefficient 𝜇1 of the friction law increases to reach typical values used for dry avalanches of similar volumes (𝛿1 = 13°, 𝛿2 = 23° and 𝛿3 = 15°) compared to our so-called reference case (Pouliquen friction law, 𝛿1 = 7°, 𝛿2 = 17° and 𝛿3 = 9°, L = 1 m, n = 0.025 m−1∕3, mf = 0, Hydrostatic version of HySEA), the landslide runout is much smaller (Figure 10a) and the maximum generated waves are about two meters smaller at gauge 2 (Figure 10c). Decreasing the typical diameter of the granular material involved (L = 0.1 m instead L = 1 m) in the 𝜇(I) rheology does not change the maximum amplitude but slightly changes the wave shape after the first wave arrival. When L = 0.1 m, the simulated water wave becomes closer to the simulation using the Coulomb friction law with 𝛿 = 7°. Indeed, in the 𝜇(I) rheology, when L gets smaller, 𝜇 tends to 𝜇1. The difference between the landslide deposits simulated with the 𝜇(I) rheology and the Coulomb friction laws is however significant (Figure 10a). The friction between the landslide layer and the water layer mf and the Manning coefficient n poorly affect the generated wave for typical values of mf between 0 and 10−4 m−1 and Manning n between 0 and 0.05 [e.g. Macías et al. 2021; González-Vida et al. 2019] (Figure 10b,c), at least during the first tens of seconds before the coupling time tc. The strongest effect is related to the hydrostatic assumption. Indeed, in the particular case of Mayotte, the non-hydrostatic simulations give very different results with a more rounded and longer-period wave with a maximum amplitude of the same order of magnitude (a few meters), but more than two times smaller than the hydrostatic simulation at gauge 2. The picked waves obtained with the hydrostatic assumption are typical of such approximation (see e.g. Figure 3b of Giachetti et al. [2012] or Figures 9 and 10 of Gylfadóttir et al. [2017]). Finally, the maximum wave amplitude increases as the landslide volume increases (Figure S6) and the waveform changes.
6.2. Numerical models and coupling approach
We used here the depth-averaged hydrostatic version of HySEA (i.e. with one layer for the avalanche and another layer for the water column, as opposed to the multilayer HySEA model where the water column is divided into several layers). The depth-averaged hydrostatic version of HySEA has been already applied to real landslides and tsunamis [Macías et al. 2017, 2020]. The accuracy of hazard maps related to landslide-generated tsunamis would be significantly improved by more advanced models accounting for non-hydrostatic effects in the landslide [Garres-Díaz et al. 2021] and water wave propagation, different coordinate systems for the landslide and avalanche [Delgado-Sánchez et al. 2020], in-depth variations [Garres-Díaz et al. 2021], and grain–fluid interactions [Bouchut et al. 2016]. However, some of these models are not yet applicable for field-scale simulations or require more parameters that are not easy to calibrate, which could lead to significant uncertainties.
In order to preserve the numerical stability of each code (HySEA and FUNWAVE-TVD) when coupling them and to be the least intrusive possible, the coupling consisted in considering the wave parameters (velocities and free-surface elevation) computed by HySEA at a certain time as initial conditions of FUNWAVE. This protocol needs to evaluate the coupling time (tc) so that it reflects the best continuity between the two codes. Thus, the choice of tc is important because it affects the simulated impact of the scenarios. Taken too early, the landslide will not yet have fully formed the water wave and the impact will be reduced. Taken too late, the wave will have started to spread with hydrostatic conditions and the impact may be overestimated. This time also depends on the characteristics of the landslide (depth, thickness, volume, slope, etc.) and its interaction with the topography. Starting the FUNWAVE-TVD simulation later increases the impacted area and the elevations of water at the coasts. For example, in the Piton 200 scenario, if we start the FUNWAVE-TVD 13 s before tc2, the maximum water elevation is reduced by 3.1 m at the airport and by 0.8 m in Dzaoudzi. Thus, using a slightly longer coupling time is a way to obtain envelope scenarios satisfying precautionary principles in terms of hazard assessment, as done in this work.
6.3. Tsunami generation, wave propagation and inundation by combining the scenarios
Figure 8 displays the maximum sea-surface elevation obtained by combining the results of numerical simulations from all the eight scenarios simulated for a 50 m mesh grid. The most penalizing scenarios can locally generate elevations of the water level greater than 1 m, in particular along the eastern coast of Petite Terre where they can reach several meters locally for the most impactful scenarios. The scenarios considered here are associated with rather maximizing assumptions. The most impactful sources are linked to sliding masses of large volume and occurring at shallow depths, i.e. close to the reef and along the slope east of Petite Terre. A good example is the Piton 200 scenario (Figure 4a) that mainly participates in defining the map of the maximum elevations of the water body (Figure 8) for the east part of Petite Terre. Other considered scenarios have a limited impact, with elevations of the water level less than 30 cm at the coast of the lagoon and the reef. This point is particularly illustrated by the impact of the 3 lobe scenarios (huge volume at middle depth) and the South-Slope and North-Slope scenarios (small volume at shallow depth) (Figure 4). This also concerns the collapses of the new volcanic edifice, corresponding to one of the most significant cases in terms of destabilized volume. However, the movements transmitted to the water are so deep that the impact at the free surface is strongly attenuated and the impact along the coasts is low.
Map of the maximum sea-surface elevation (values in m) combining the results of the eight simulated scenarios (resolution: 50 m). The bold black line is the Histolitt coastline from SHOM.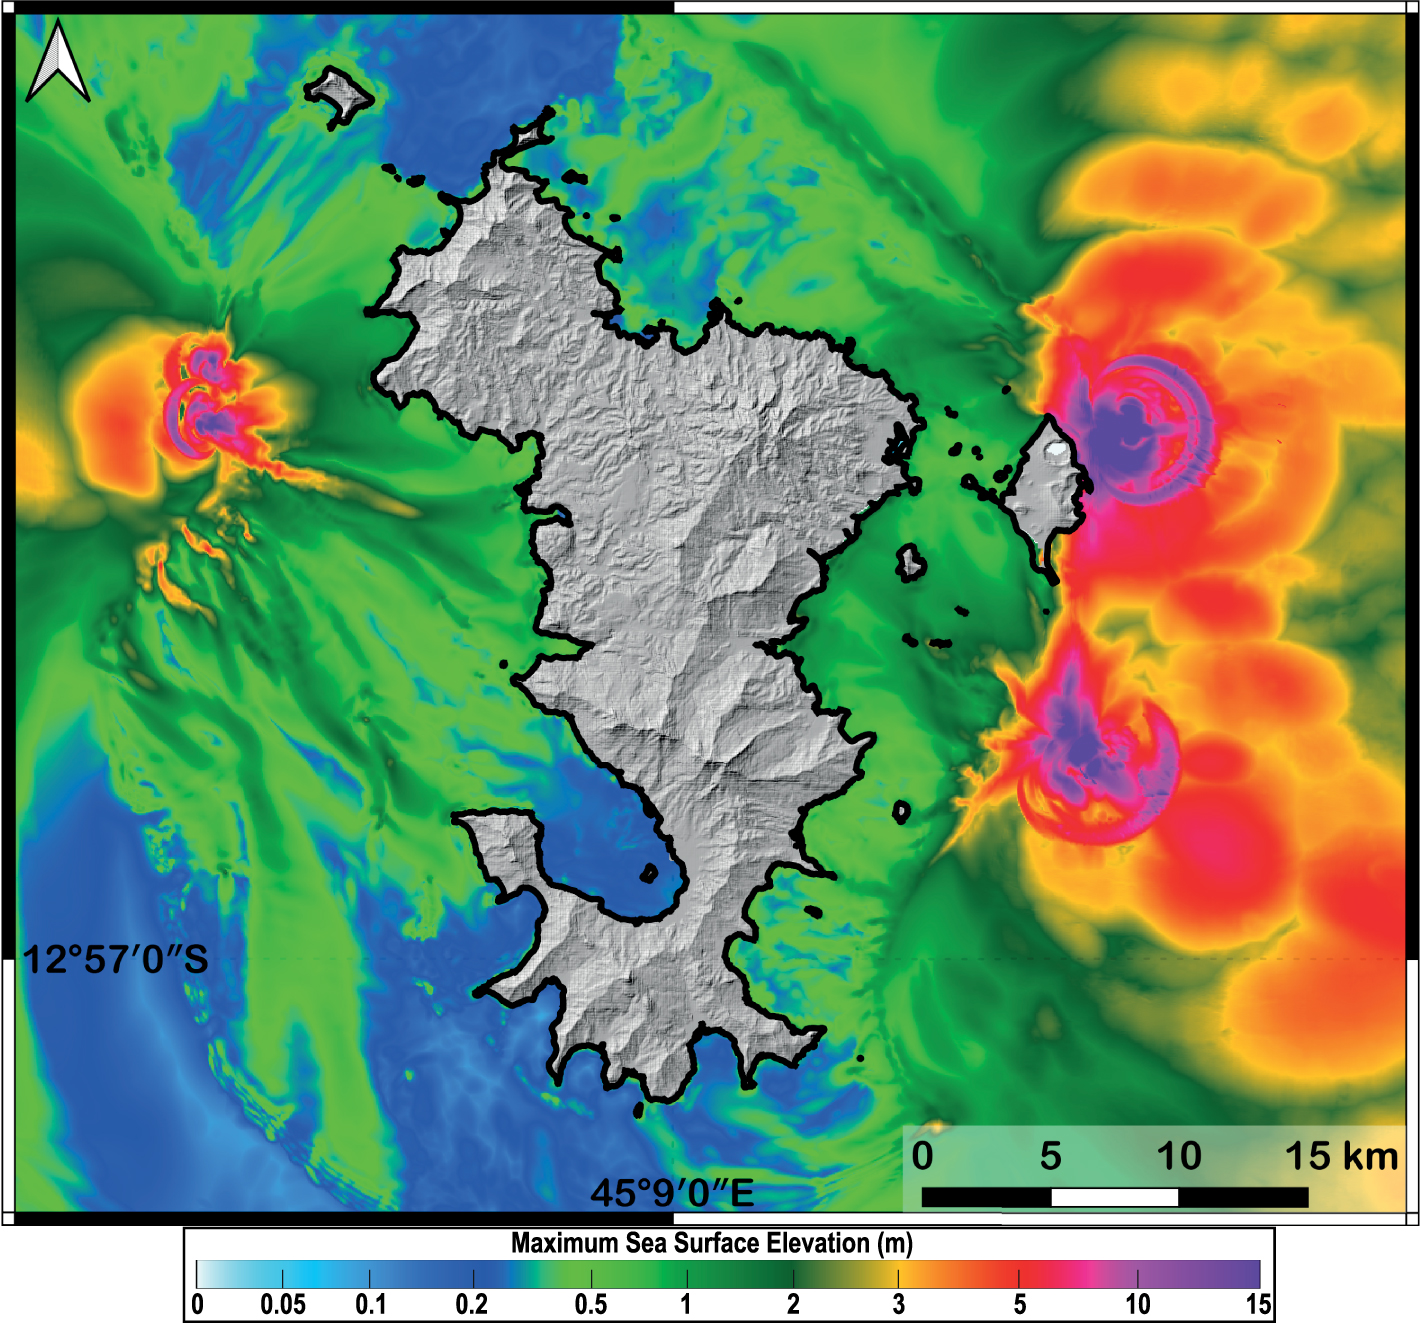
The impact on the coast of simulated potential tsunamis is heterogeneous and depends not only on the considered scenarios but also on the coastal areas as is generally the case. Globally, modeled impacts of tsunamis along the coast of Mayotte can be considered as moderate, except for some maximizing scenarios along the eastern side of the island. This side of the island is the most exposed since we considered potential landslides in this area, associated with the ongoing seismo-volcanic activity. However, the reef plays an essential protective role since it can dissipate much of the energy of tsunamis coming westward, as it does for cyclonic waves [Kunkel et al. 2006; De la Torre et al. 2008]. The east coast of Petite Terre is much more exposed because of the lack of a reef. Elsewhere, coastal morphologies characterized by steep slopes associated with the presence of mangroves also mitigate the impact of submersion due to dissipation processes. Given the orders of magnitude of the modeled events, it is essential to take into account the tides and the subsidence linked to regional deflation (phenomenon of emptying of the magmatic chamber [Cesca et al. 2020; Lemoine et al. 2020a; Feuillet et al. 2021]). In our study, unfavorable assumptions (full spring tide and homogeneous subsidence of 15 cm) have been considered during the modeling of tsunamis in order to conserve the logic of the “worst credible risky case”.
More locally, in addition to the exposure to the phenomenon, the level of risk depends on the presence of buildings, roads or particular infrastructures such as the airport or administrative centers and their vulnerability. The most exposed areas (in terms of wave height) are not associated with a high level of risk as they are located along the eastern coast of Petite Terre that is almost uninhabited (beaches surrounded by relief and cliffs). Higher resolution simulations (10 m resolution) were carried out for some of the most impactful scenarios such as Piton 200 and South Slope in order to model the potential flooding. To engage operational communication with local authorities, we were encouraged to map a simplified parameter representing the intensity of flooding along the coasts. Because it has been computed by integrating all the most impactful scenarios, it reflects the intensity, from low to very high, on a specific area, as defined by the French coastal risk prevention plan guide [MEDDE 2014] (Table 3). The resulting mapping is thus obtained by combining the water depths and flow velocities simulated for the most impactful scenarios, and for simplification, it has been associated with the notion of hazard (or pseudo-hazard), even if it is not feasible or realistic to associate a probability with the considered simulated scenarios. However, the performed simulations show that inundations located on Petite Terre, and in particular at the airport and Dzaoudzi, lead to a high pseudo-hazard level. On Grande Terre, specific local conditions (mangrove, steep slopes) mitigate the impact of inundation. Figure 9 exhibits such high to very high pseudo-hazard levels along the entire coastline studied, impacting in particular some coastal urbanized sectors (e.g. Figure 9d) and coastal infrastructures (Figure 9a,b). In addition, tsunami arrival times for these scenarios are around a few minutes (Figure 9), which is relatively short to set up an early warning system.
Hazard value and time of travel of the tsunami from the combined results of the most impactful scenarios (Piton 200 and South Slope) with a 10 m resolution. The color scale represents the value of the hazard calculated for each point: (a) Dzaoudzi and route N4, (b) airport and Pamandzi, (c) Mamoudzou, (d) northeast coast of Petite Terre, and (e) Koungou. The bold black line is the Histolitt coastline from SHOM. The colored lines and dashed lines represent the travel times of the tsunami in minutes.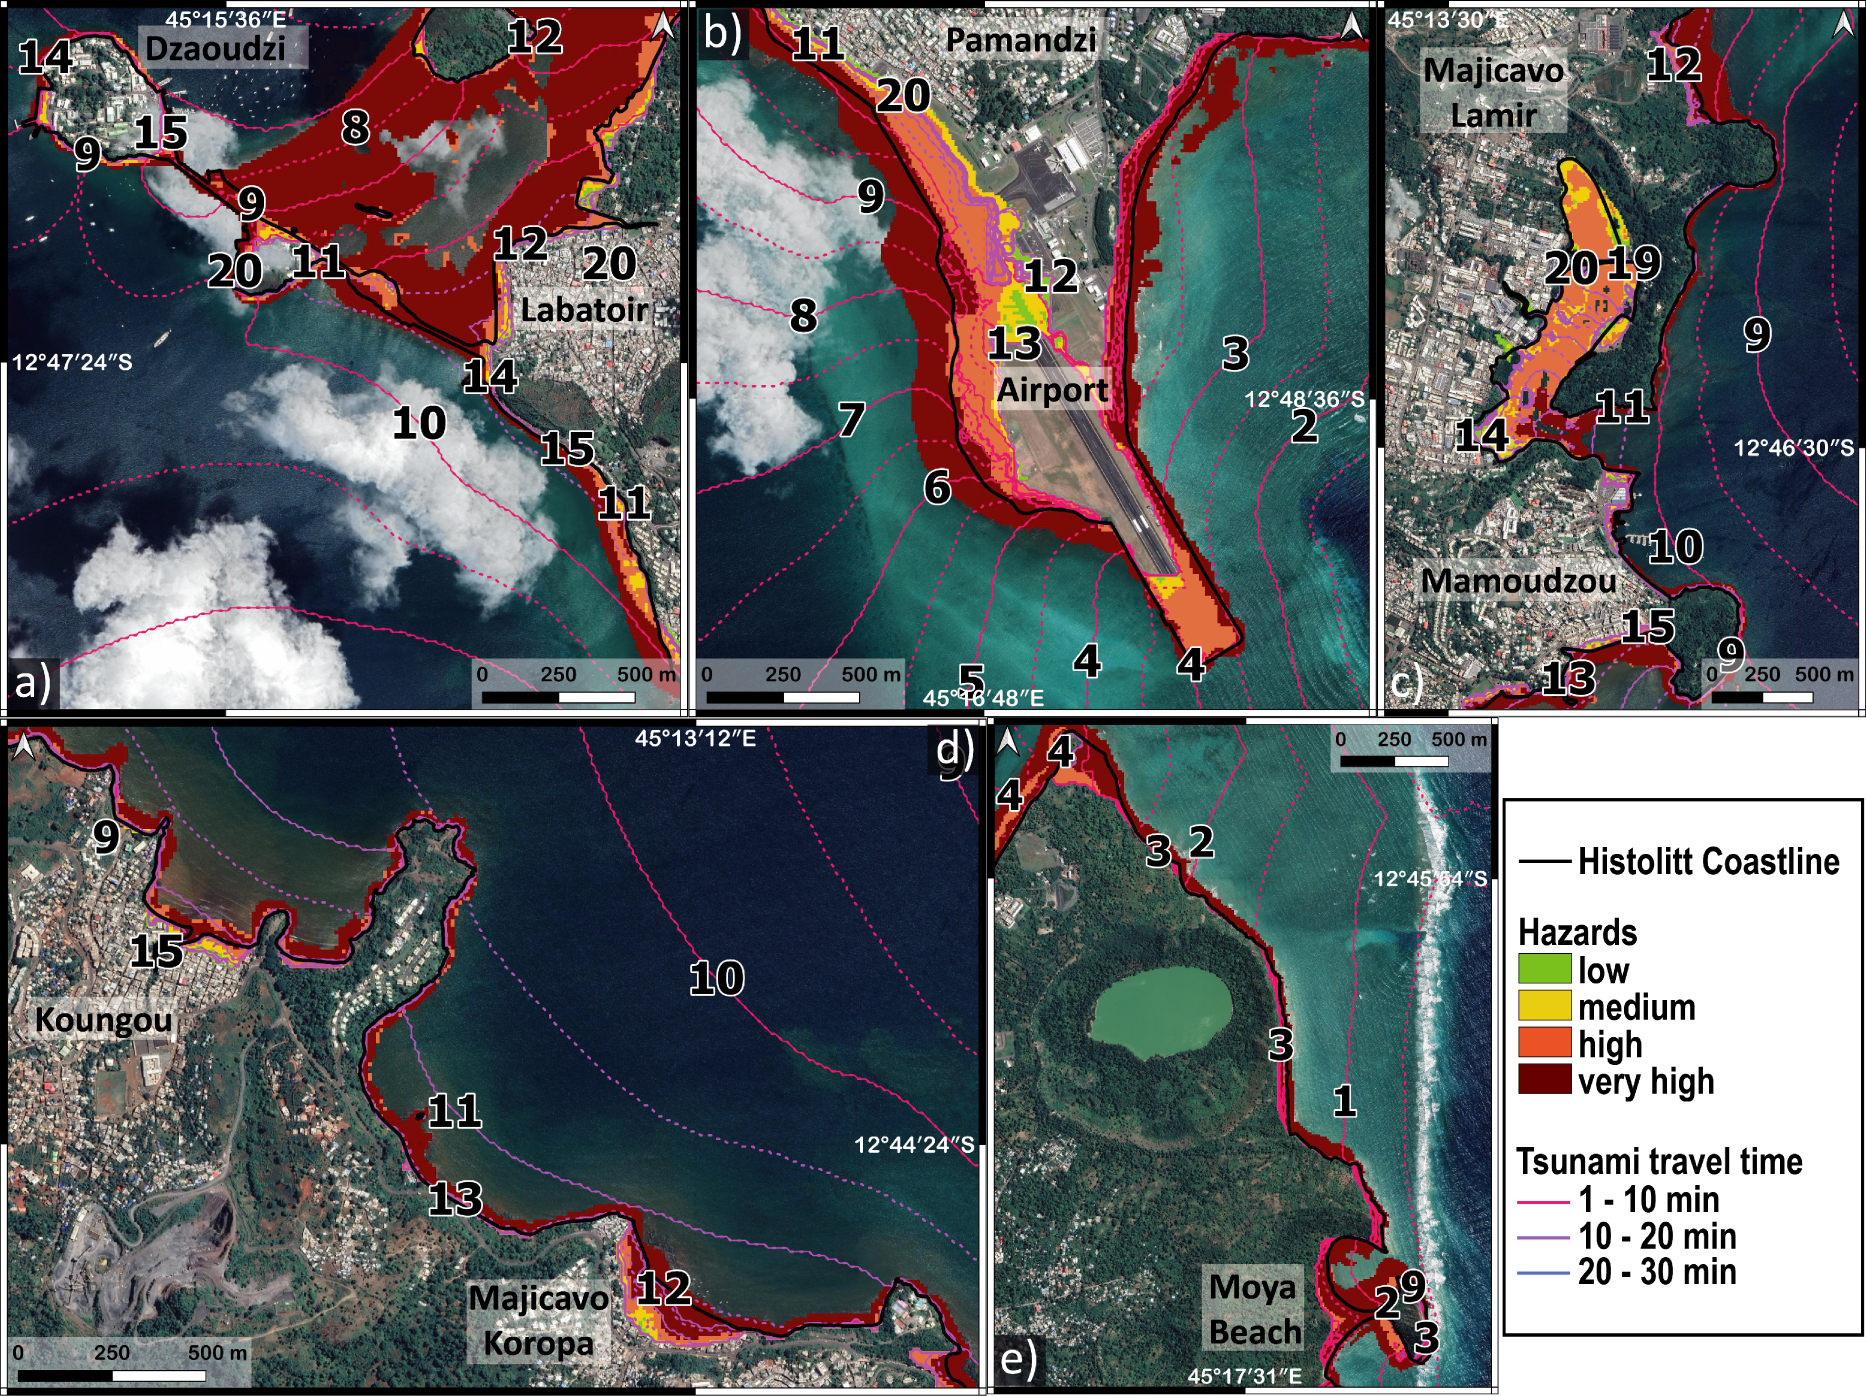
Sensitivity tests performed on the Piton 200 scenario with varying Manning coefficient n, friction angles 𝛿i, water landslide friction mf, value of the typical grain diameter L, and version of HySEA (parameters can be found in Table 4). (a) Deposit extension for each sensitivity test and locations of the gauges, (b) sea-surface elevation at gauge 1, (c) sea-surface elevation at gauge 2. The reference simulation is the thick black curve.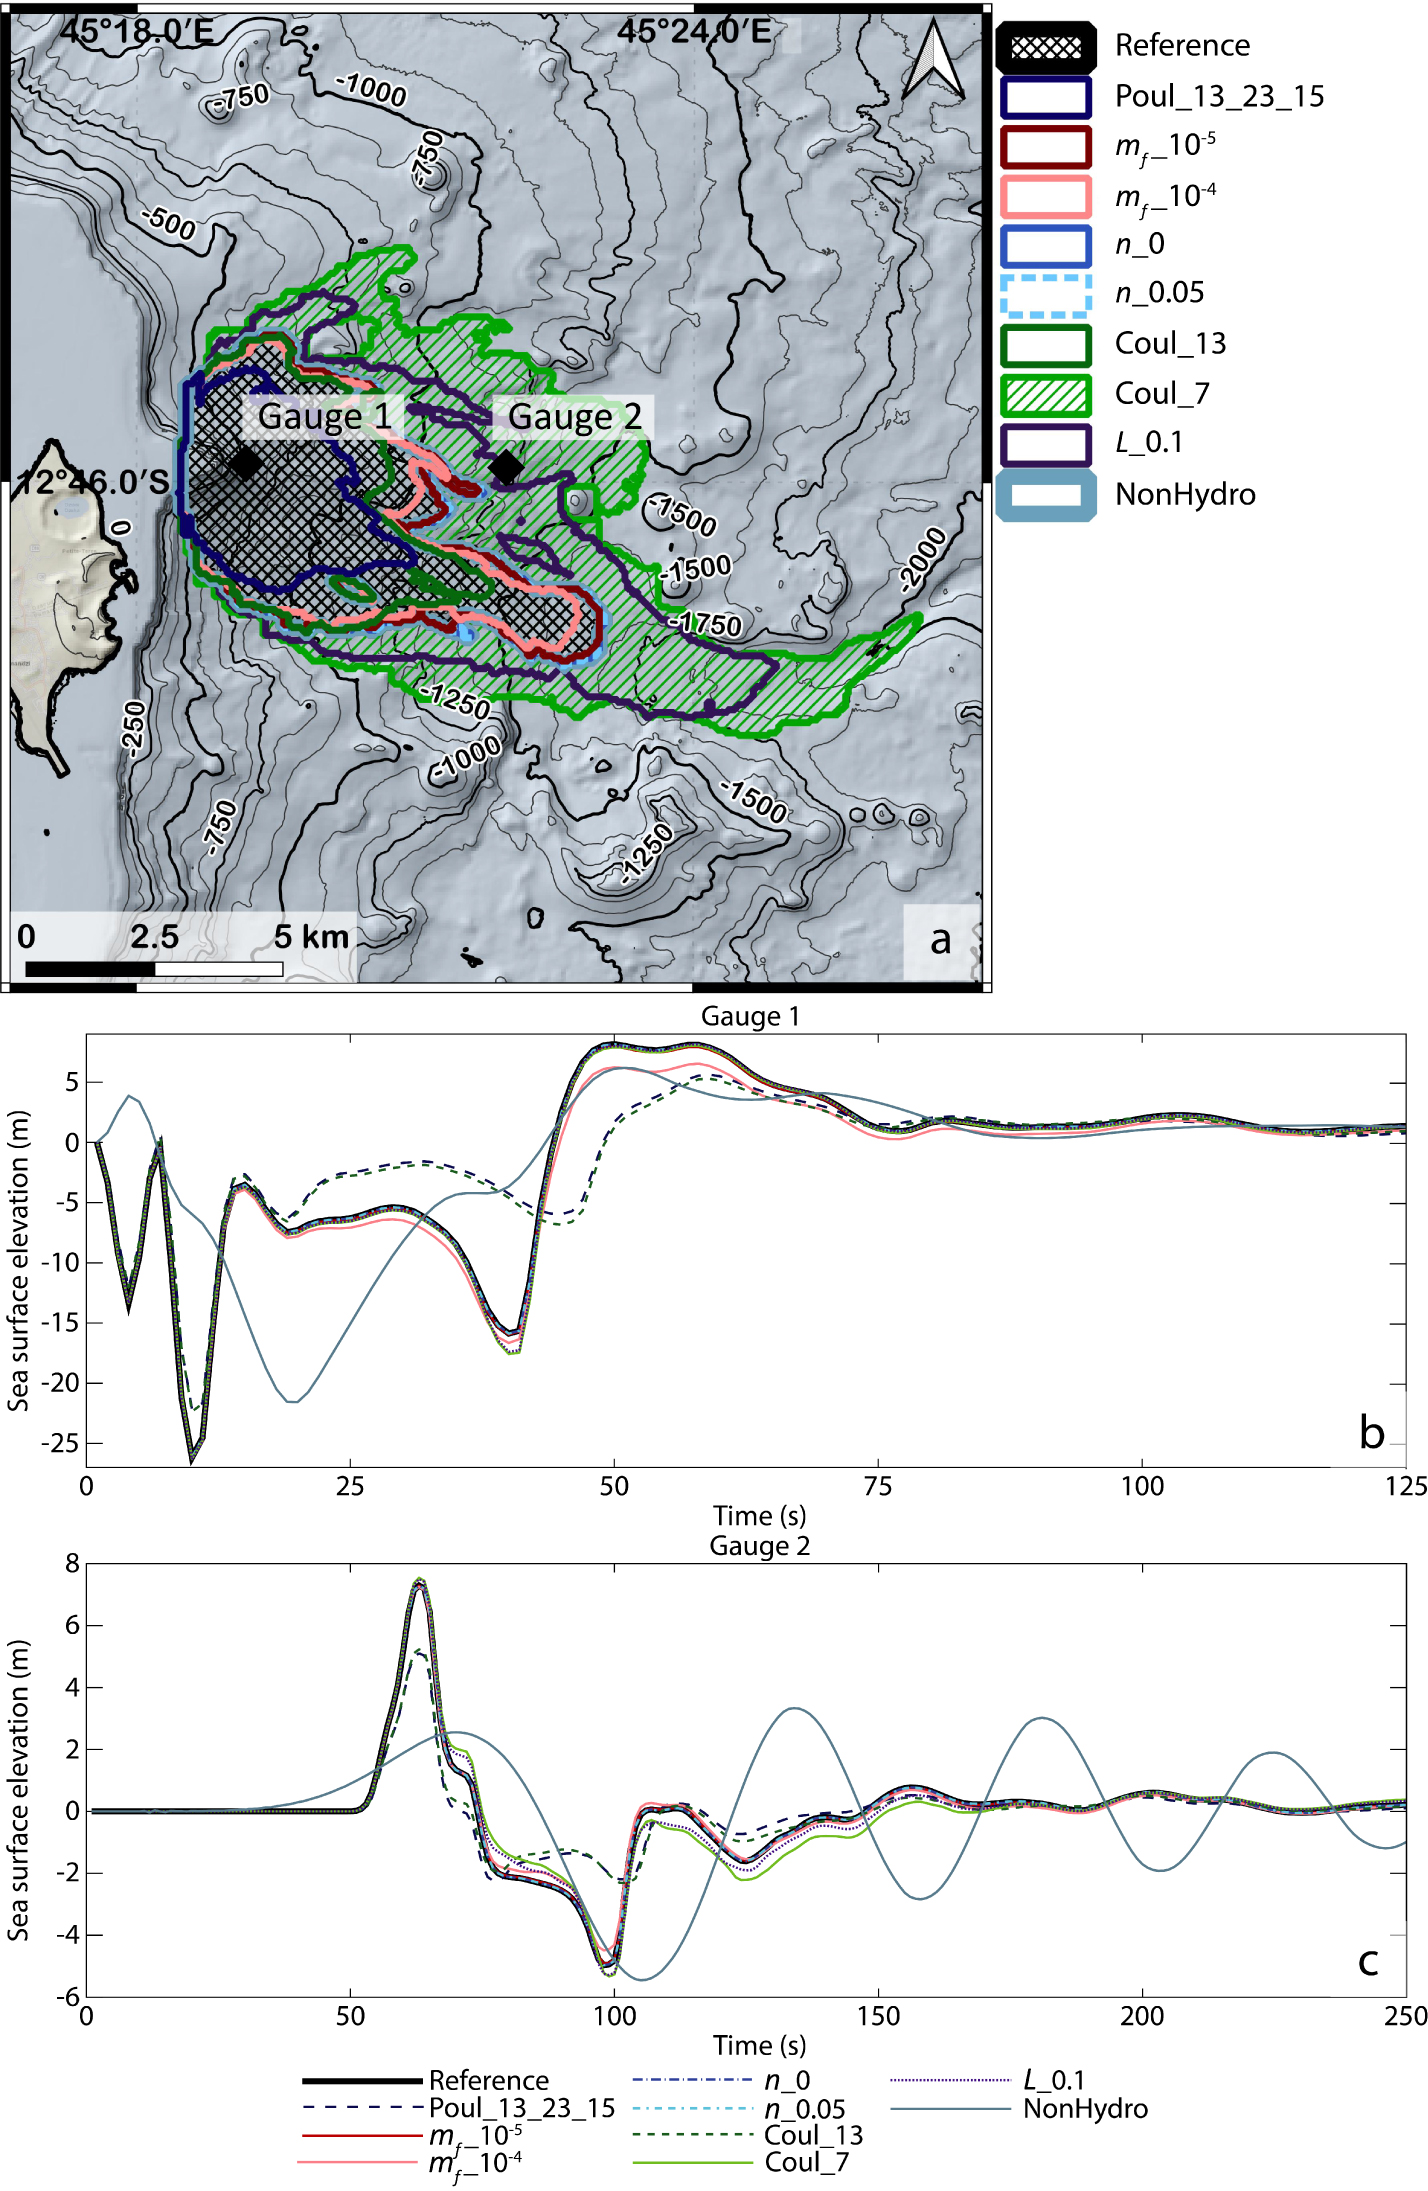
Parameters used to represent the intensity of the flooding, as defined in the French coastal risk prevention plan guide [MEDDE 2014]
| Water height (m) | Submersion dynamics: velocities | ||
|---|---|---|---|
| 0 m/s < V < 0.2 m/s | 0.2 m/s⩽V < 0.5 m/s | Fast: V ⩾0.5 m/s | |
| H < 0.5 m | Low | Medium | High |
| 0.5 m⩽H⩽1 | Medium | Medium | High |
| H⩾1 m | High | High | Very high |
Parameters involved in the sensitivity tests performed by varying the landslide volume V , the friction law and associated friction angles 𝛿i, the Manning coefficient n, the typical grain diameter L in the Pouliquen (𝜇(I)) flow law, friction between the avalanche and water layer mf, and version of the model (hydro and non-hydro)
| No of the simulation | Name | Volume (106 m3) | Friction law | Friction angle (deg.) | L in m Pouliquen law | Manning n (m−1∕3⋅s) | Water-landslide friction mf (m−1) | Version of HySEA | ||
|---|---|---|---|---|---|---|---|---|---|---|
| 𝛿1 | 𝛿2 | 𝛿3 | ||||||||
| 1 | Reference | 200 | Pouliquen | 7 | 17 | 9 | 1 | 0.025 | 0 | Hydro |
| 2 | Poul_13_23_15 | 200 | Pouliquen | 13 | 23 | 15 | 1 | 0.025 | 0 | Hydro |
| 3 | mf _10−5 | 200 | Pouliquen | 7 | 17 | 9 | 1 | 0.025 | 0.00001 | Hydro |
| 4 | mf _10−4 | 200 | Pouliquen | 7 | 17 | 9 | 1 | 0.025 | 0.0001 | Hydro |
| 5 | n_0 | 200 | Pouliquen | 7 | 17 | 9 | 1 | 0 | 0 | Hydro |
| 6 | n_0.05 | 200 | Pouliquen | 7 | 17 | 9 | 1 | 0.05 | 0 | Hydro |
| 7 | Coul_13 | 200 | Coulomb | 13 | 0.025 | 0 | Hydro | |||
| 8 | Coul_7 | 200 | Coulomb | 7 | 0.025 | 0 | Hydro | |||
| 9 | L_0.1 | 200 | Pouliquen | 7 | 17 | 9 | 0.1 | 0.025 | 0 | Hydro |
| 10 | NonHydro | 200 | Pouliquen | 7 | 17 | 9 | 1 | 0.025 | 0 | Non hydro |
| 11 | V_100 × 106 | 100 | Pouliquen | 7 | 17 | 9 | 1 | 0.025 | 0 | Hydro |
| 12 | V_50 × 106 | 50 | Pouliquen | 8 | 18 | 10 | 1 | 0.025 | 0 | Hydro |
7. Conclusion
Since May 2018, Mayotte Island has experienced intense seismic activities linked to the on-going seismo-volcanic crisis. This could weaken the submarine slopes of Mayotte and trigger submarine landslides associated with tsunamis. To address the hazards associated with such events, we have combined two complementary numerical models (the HySEA and the Boussinesq FUNWAVE-TVD models) to numerically simulate eight potential submarine landslides and the associated generation and propagation of waves. Our results show that, for the most penalizing scenarios, the generated elevations of the water level are generally around 1 m, except in Petite Terre where they can reach very locally more than 15 m in an uninhabited area. Indeed, the most impactful sources are linked to sliding masses of large volumes and occurring at shallow depths, i.e. close to the reef and along the slope east of Petite Terre, as represented by the Piton 200 scenario. Other considered scenarios have a limited impact, with less than 30 cm elevations of the sea level at the coast of the lagoon and the reef. The impact on the coast is therefore non-uniform and depends on the side of the island. Globally, the eastern side of the island is the most exposed since it faces the location of landslides potentially generated by the seismo-volcanic activity. Fortunately, at this location, the reef plays a key protective role by dissipating much of the energy of tsunamis coming westward. Preserving the reef is therefore crucial to maintain this natural protection.
Our simulations show that, for some of the most impactful scenarios, such as Piton 200 and South Slope, inundations located on Petite Terre, and in particular at the airport and Dzaoudzi (up to 1.5 m), can lead locally to a very high hazard level. On Grande Terre, specific local conditions (mangrove, steep slopes) mitigate the impact of any inundation. Note that preserving the mangroves is also crucial to reduce flooding.
Our study paves way to the development and use of complex numerical models to simulate both landslides and wave propagation processes [e.g. Rauter et al. 2022; Yavari-Ramshe and Ataie-Ashtiani 2016, for a review], instead of simple empirical laws for the landslides [Lemoine et al. 2020b]. This should improve hazard and risk assessment strategies in contexts similar to Mayotte, i.e. in active seismo-volcanic contexts near the coast. To understand the results presented in this study, it is essential to be aware of the uncertainties linked to the scenario definition, model approximations, empirical rheological laws, and the simplification of natural complexity (see Section 6.1 and Figure S6). Each of these parameters affect the tsunami wave, but the non-hydrostatic effects dominate in such a context and should thus be accounted for in the future. Furthermore, we have not taken into account the heterogeneity of the material involved, grain/fluid interactions, and the transition phase from an initially coherent mass to a granular flow. However, the purpose of these simulations is to give the order of magnitude of waves, for a set of realistic submarine landslide scenarios, using state-of-the-art models. Thus, our results confirm the potential of advanced numerical models to build precise hazard maps suitable for use in land-use planning or the design of evacuation plans [Leone et al. 2021].
This approach can be advanced in different aspects. More precise scenarios could be determined using new geological data from future marine surveys and drilling in the targeted areas. From the modeling point of view, the simulation accuracy could be significantly improved by developing more advanced numerical models for landslide and tsunami waves accounting for non-hydrostatic effects, different coordinate systems for the landslide and the tsunami, grain–fluid interactions in the granular mass, and multilayer approaches for the landslide and tsunami wave. Another key improvement would be to account for uncertainties and develop probabilistic approaches in the simulated hazard maps [Løvholt et al. 2020], based notably on series of simulations using for example statistical emulation [e.g. Salmanidou et al. 2019].
Conflicts of interest
Authors have no conflict of interest to declare.
Acknowledgements
We thank staff scientists and crew for the data provided by MAYOBS 1 cruise that was funded by the CNRS-INSU TELLUS MAYOTTE program (SISMAYOTTE project). This study was supported by the Réseau de Surveillance Volcanologique et Sismologique de Mayotte (REVOSIMA). Since June 2019, all activities on Mayotte are funded by le Ministère de l’Enseignement Supérieur, de la Recherche et de l’Innovation (MESRI), le Ministère de la Transition Ecologique (MTE), le Ministère des Outremers (MOM), le Ministère de l’Intérieur (MI), and le Ministère des Armées with the support of the DIRMOM (Direction Interministérielle aux Risques Majeurs en Outremer) and the MAPPPROM (Mission d’appui aux politiques publiques pour la prévention des risques majeurs en Outremer) throughout the REVOSIMA. The work was also funded by the contract ERC-CG-2013-PE10-617472 SLIDEQUAKES along with the Spanish Government and FEDER through the Research Project MTM2015-70490-C2-2-R. This study contributes to the IdEx Université de Paris ANR contract ANR-18-IDEX-0001.