

1 Introduction
Teleosteans are one of the most thoroughly studied vertebrate groups. Since the pre-cladistic work of Greenwood et al. 〚2〛 defining monophyletic groups in basal Teleostei, the relationships among these clades were the subject of numerous publications involving conflicting hypotheses (e.g., 〚2–5〛). To the extreme, the consensus of these different proposed phylogenies is still a mostly unresolved cladogram 〚6〛. One of the main problems remains the loose concept of Euteleostei 〚5, 7〛 (Fig. 1, right) and the relationships of basal clupeocephalans, i.e. mainly Clupeomorpha (anchovies, herrings), Ostariophysi (carps, piranhas, catfishes), Esocoidei (pikes) and Salmoniformes (trouts, Fig. 1). Following the results obtained by a number of authors 〚1, 8–10〛, the criticism of the euteleostean concept and the rise of the new clade Otocephala (Clupeomorpha plus Ostariophysi) have been argued, leaving unclear the relationships of Esocoidei 〚10〛.
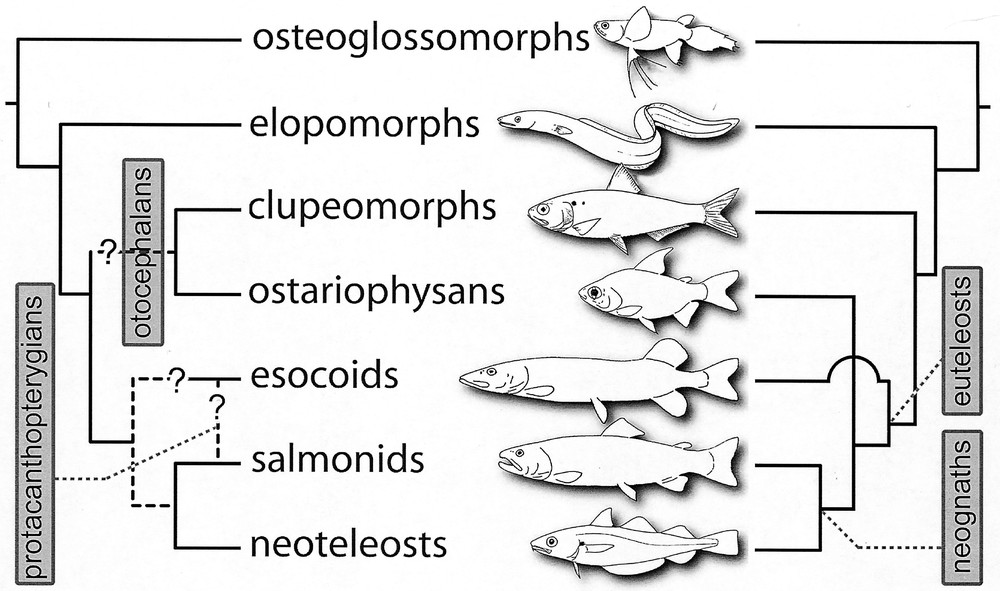
Interrelationships of extant teleosts, as they were summarised twenty years ago by Lauder and Liem (right, 〚21〛), and as they were questioned by Lecointre and Nelson in 1996 (left, 〚10〛). The tree on the left is the phylogenetic framework we have used as a starting point for our work. The questions we want to answer are the following. Are clupeomorphs and ostariophysans sister-groups (monophyletic otocephalans) or are euteleosts monophyletic? Are esocoids more closely related to salmonids (monophyletic protacanthopterygians) or are they the sister-group of the neognaths?
1.1 The classical Euteleostei
Greenwood et al. 〚2〛 published a classification that included for the first time in ichthyology a group named Division III, combining some isospondylous groups and all their supposedly derivative taxa, later on corresponding to the Euteleostei. Indeed, the Euteleostei contain esocoids, ostariophysans, salmonids, and all the remaining more derived teleosts, and excludes clupeomorphs, osteoglossomorphs (elephant fishes), and elopomorphs (eels) (Fig. 1, right). Patterson and Rosen 〚5〛 defined this group on the basis of three controversial morphological synapomorphies: presence of an adipose fin posterior to the dorsal fin, nuptial breeding tubercles on the head and the body and an anterior membranous component to the first uroneural). These traits have been discussed by Rosen 〚7〛, who retained only the first, and criticised by Lecointre 〚9〛 and Lecointre and Nelson 〚10〛. Although extensive research has been conducted since this time, no other morphological synapomorphies have been proposed for this assemblage. One of the reasons that can be adduced for this lack of results is that, in fact, euteleosts have never been discovered from a real data matrix. The group is a remnant of pre-phylogenetic classifications, a posteriori justified. Rosen 〚5〛 adopted a ‘verificationist’ methodology, trying to find characters corroborating ill-defined groups, not falsifying them.
1.2 The Otocephala dismembers the Euteleostei
From partial sequences of 28S rRNA of a sample of craniates, Le et al. 〚8〛 first found a sister-group relationship between clupeomorphs and ostariophysans, contradicting the monophyly of the Euteleostei. Lecointre and Nelson 〚10〛 proposed an alternative definition of the Euteleostei that excluded the Ostariophysi. Johnson and Patterson 〚1〛 adopted this point of view, naming Euteleostei the group comprising all teleosts more advanced than Ostariophysi (a group equivalent to the Neognathi of Rosen 〚11〛, Fig. 1, right). They proposed a molecular synapomorphy for this group (〚1〛 p.316, their insertions in figure 24), but the alignment of this region is, at best, ambiguous and so are the hypotheses of primary homology. Three morphological derived characters were also proposed by these authors: a particular pattern of development of supraneurals (Esocoids having a partially different pattern and ostariophysans an autapomorphic state of character), the presence of a stegural and the presence of caudal median cartilages (absent in esocoids). Again, a methodological issue arises concerning this newly defined Euteleostei: the group is defined in order to contain ‘the rest’ of the taxa, after considering the evidence for the clupeomorph–ostariophysan sister-group relationship, and a research is conducted to corroborate a group that has not been discovered from a data matrix. Johnson and Patterson 〚1〛 named Otocephala the clade grouping Clupeomorpha and Ostariophysi.
Arratia 〚3, 4〛 also analysed the relationships of basal teleosteans, based on morphological characters. She included a considerable number of fossil taxa in her sampling. Some of the obtained topologies 〚3, 4, 12〛 showed a clupeomorph-ostariophysan sister-group relationship, named Ostarioclupeomorpha. However, we are not much confident about these results. First, this grouping must be tested, including more clupeomorph and gonorynchiform fossil taxa. The only published internal phylogeny of the Clupeomorpha 〚13〛 shows a basal polytomy between Armigatus brevissimus, Ellimmichthyiformes (both fossil taxa) and Clupeiformes. In order to discuss primitive clupeomorph characters, A. brevissimus should be included in Arratia’s analysis. The inclusion of fossil gonorynchiforms would test some features (pleurostyle, pattern of hypurals, etc.) present in both clupeiforms and otophysans.
The second and most important bias of this study is a peculiar way of coding. In all the analyses published by Arratia concerning large samplings 〚3, 4, 12〛, there are a number of characters that have a character-state defined as ‘other condition’ or ‘non-observable’. Some of the synapomorphies of her cladograms are, thus, recognised as non-homologous features. Concerning clupeomorphs (sensu Grande 〚13〛), eight over 51 informative characters (15%) have this kind of character-states. The influence of this particular way of coding should be analysed substituting all this character-states by ‘?’. This will be discussed below.
1.3 Protacanthopterygii
Within their Division III, the assemblage Protacanthopterygii was first recognised by Greenwood et al. 〚2〛, as containing salmonoids (salmonids, plecoglossids, osmerids), argentinoids, galaxioids, esocoids, stomiatioids, alepocephaloids, bathylaconoids, myctophoids (lantern fishes and neoscopelid-like fishes), all gathered in the order Salmoniformes, to which three other orders were added, the Gonorhynchiformes (milkfish), the Cetomimiformes, and the Ctenothrissiformes. They considered protacanthopterygians as the primitive group of euteleosts, with different groups giving rise to paracanthopterygians (cods), atherinomorphs (killies) and acanthomorphs (tunas). Only gonorynchiforms were considered as a group without derivatives. Many studies have given different interpretations of the contents and interrelationships within the protacanthopterygians 〚14–19〛. Johnson and Patterson 〚1〛 summarised the results of all these works and thoroughly criticised Begle’s analyses. The overall results are so different to each other than the strict consensus is a mostly unresolved cladogram. Nevertheless, esocoids were generally regarded as the sister-group of the other euteleosts 〚6, 7, 15, 17, 18, 20, 21〛, whatever the meaning of the latter (Fig. 1, right). Nelson 〚6〛 also tentatively regards protacanthopterygians as paraphyletic, with a group composed of esocoids, salmoniforms and osmeroids (smelts) as the sister-group of the other euteleosts, but without evidence supporting this assemblage. Johnson and Patterson 〚1〛 redefined the Protacanthopterygii as Argentiniformes (argentines and slickheads) plus Salmoniformes (trouts and smelts), excluding pikes. Molecular data has not helped very much in the past because of a lack of sequences of a great number of involved taxa, in particular osmeroids (smelts), alepocephaloids (slickheads), argentinoids (argentines) and galaxoids. Nevertheless, the molecular phylogeny of Bernardi et al. 〚22〛, based on growth hormone amino acid sequences found a sister-group relationship between esocoids and Salmonidae, contradicting both the basal position of esocoids among euteleosts 〚21〛 or as a member of the Neognathi 〚1〛. Lecointre and Nelson 〚10〛 ended their review of clupeocephalan relationships on that ambiguity (their figure 1I p. 198, present Fig. 1, left), which we will try to solve in the present paper.
1.4 A perspective from molecular data
In the present paper, the strategy followed for phylogenetic analysis is a separate analysis of six genes in order to assess the repeatability of the clades of interest (i.e., identifying the sister-group of esocoids and the sister-group of clupeomorphs). There are two reasons for that. The first one is methodological, the second one is practical. The first reason is that reliability of clades comes from their repeatability from independent sources of data. This point of view does not reject the ‘total evidence’ approach 〚23〛 (better called ‘simultaneous analysis’ by Nixon and Carpenter 〚24〛). Actually, our way to practice molecular systematics tries to benefit from the advantages of both separate analyses (without consensus, see materials and methods) and simultaneous analysis of all the available data in a single matrix 〚25〛. However, in the present study, there is a strong limitation to performing this simultaneous analysis of all the available data. This leads to the second reason: practically, among all the available teleostean DNA sequences published to date, there is a poor taxonomic overlap among genes. In spite of the fact that, for the present study, DNA sequences were obtained for a number of key-taxa in the rhodopsin gene and the 28S rDNA gene (see Table 1), the global simultaneous analysis of the six genes remains not possible. This has only a limited impact on the purpose of the present paper, as we focus on two sister-group relationships: what is the sister-group of the esocoids? What is the sister-group of clupeomorphs?
Taxonomic sampling with corresponding Genbank accession numbers. Sequences in bold are those obtained in this study.
| MLL | 12S–16S | RAG1 | 18S | 28S | RHODOPSIN | ||
| Osteoglossomorpha | Osteoglossum sp.–AF137220 | O. ferreirai–X99172/X99171 | O. sp.–AF137188/AF137167 | H. alosoides–X98840 | S. sp.–Z18720/Z18692/Z18746 | P. buchholzi–AF137210 | |
| H. alosoides–X99170/X99169 | N. notopterus–AF137190/AF137169 | ||||||
| P. buchholzi–AF137189/AF137168 | |||||||
| Elopomorpha | Anguilla sp.–AF137221 | E. hawaiiensis–X99176/X99175 M. atlanticus–X99178/X99177 | Anguilla sp.–AF137191/AF137192 | E. hawaiiensis–X98841 | Anguilla anguilla–L78007 | ||
| M. atlanticus–X98846 | |||||||
| Megalops atlanticus AY158050 | |||||||
| Albula vulpes–X98842 | |||||||
| E.punctifer–X98844 | |||||||
| Ophicthis rex–X98843 | |||||||
| Clupeomorpha | Chirocentrus sp.–AF137222 | C. harengus–X99162/X99191 | Chirocentrus–AF137194/AF137193 | Clupea harengus–X98845 | C. harengus–Z18764/Z18701/Z18758 | S. pilchardus–Y18677 | |
| L. miodon–X99196/X99195 | Engraulis encrasicholus | Engraulis encrasicholus AY158051 | |||||
| ‘S. Tanganicae’–X99194/X99193 | AY158055, AY158059, AY158052 | ||||||
| Ostariophysi | Chanos chanos–AF137223 Barbus tetrazona (AF137224) | Kneria sp.–U33990/U34028 | C. chanos–AF137195/AF137172 B. tetrazona–AF137196/AF137173 | I. punctatus–AF021880 | I. nebulosus–Z18704/Z18678/Z18732 | Chanos chanos AY158046 | |
| Cyprinus caripio–NC001606 | Hepsetus odoe | Danio rerio–AF109368 | |||||
| AY158058, AY158062, AY158053 | |||||||
| Danio rerio–AC024175 | Tinca tinca–Z18723/Z18694/Z18749 | Cyprinus carpio–U02475 | |||||
| Ictalurus punctatus–NC003489 | G. gobio–Z18677/Z18703/Z18731 | Carassius carassius AY158048 | |||||
| A. mexicanus–U12328 | |||||||
| Esocoidei | Esox lucius–AF137225 | Esox lucius–AF137197/AF137174 | Esox lucius | Esox lucius AY158044 | |||
| AY158056, AY158060, AY158054 | |||||||
| Umbra pygmaea | Dallia pectoralis AY158047 | ||||||
| AY158057, AY158061, AY158063 | |||||||
| Salmonidae | O mykiss–AF137229 | Oncorhynchus mykiss–NC001717 | Oncorhynchus mykiss–AF137176 | Salmo trutta–X98839 | O. mykiss–Z18709/Z18683/Z18760 | Salmo trutta AY158045 | |
| Salvelinus alpinus–NC000861 | Salmo trutta–AF137177 | Salmo salar–Z18718/Z18691/Z18745 | C. autumnalis–L42954 | ||||
| Osmeroidei | G. maculatus–AF137228 | Nesogalaxias neocaledonicus AY158043 | |||||
| Plecoglossus sp.–AF137227 | P. altevalis–AF137198/AF137175 | ||||||
| Alepisauroidei | Harpadon sp.–AF137230 | S. saurus–AF049723/AF0449733 | Harpadon sp.–AF137199/AF137178 | ||||
| Stomiiformes | C. pseudopallida–AB026029/AB0226041 | ||||||
| Myctophiformes | H. hygomii–AF049734/AF049724 | ||||||
| Acanthomorpha | Channa sp.–AF137258 | Gadus morhua–X99772 | G. morhua–AF137200/AF137179 | F. heteroclitus–M91180 | P. fluviatilis–U87442/U87424/Z18686 | Perca fluviatilis AY141295 | |
| Dicentrarchus sp.–AF137246 | D. labrax–AF137203/AF137202 | S. altivelis–M91182 | S. scombrus–U87448/U87429/Z18693 | Scomber japonicus AY141311 | |||
| D. mawsoni–AF137249 | D. mawsoni*Z32707/Z32726 | T. lucerna–Z18763/Z18768/Z18762 | Liza saliens–Y18670 | ||||
| Fugu sp.–AF036382 | Fugu pardalis–AB029314 | Chelon labrosus–Y18669 | |||||
| Lampris sp.–AF137231 | Lampris guttatus–AF049726/AF149984 | T. nigroviridis–AJ270033 | Mugil cephalus–Y18668 | ||||
| Lophius sp.–AF137233 | Atherina boyeri–Y18676 | ||||||
| Mola mola–AF137260 | Mola mola–AF137205/AF137183 | Mola mola–AF137215 | |||||
| Mugil cephalus–AF137234 | M. cephalus–AF137201/AF137180 | Ostracion sp.–AF137213 | |||||
| Psettodes sp.–AF137259 | P. americanus–AF369067 | Balistes sp.–AF137212 | |||||
| Salarias sp.–AF137250 | Gadus morhua–AF137211 | ||||||
| Stromateus sp.–AF137256 | S. diadema–U57537 | ||||||
| Zeus faber–AF137241 | Zeus faber–AF049723/AF049733 | P. reticulata–Y11147 | |||||
| Psettodes sp.–AF148143 | |||||||
| Bedotia geayi AY141267 | |||||||
| Zeus faber–Y14484 |
2 Materials and methods
2.1 Taxon sampling and DNA extraction
The taxonomic sampling was performed, as far as possible, in order to allow a comparison between trees. First, the taxonomic sample was limited to teleosteans, rooting each tree on osteoglossomorphs and elopomorphs, in order to obtain the same maximum divergence time of the taxonomic sample in each data set, and to avoid mutational saturation in some of the data sets. Secondly, for the questions at hand, it is not necessary to increase the computation time by inflating the number of acanthomorph taxa for some data sets (e.g., rhodopsin), the number of otophysans for others (e.g., 12S-16S), moreover when the corresponding taxa are not available in others. Therefore, the number of acanthomorphs and otophysans will be limited to a few of them with complete sequences. Some taxa are lacking for some genes, our effort in acquiring new data were focused on two promising nuclear genes, rhodopsin and 28S rDNA. Taxa are listed for each gene in Table 1.
Most of the tissues were muscle fixed in 70% ethanol, though some were stored at –80 °C. Ethanol-fixed tissues were dried in a vacuum centrifuge before DNA extraction. Tissues were powdered in liquid nitrogen using a mortar and pestle, and then suspended in a CTAB solution at 60 °C, following the method of Winnpenminck 〚26〛. 0.5 units of RNase was added to the second aqueous phase, and then incubated at 37 °C for 30 min to remove RNA. Total genomic DNA was precipitated by the addition of 2/3 of the total volume of isopropanol and stored at 4 °C from 2 h to overnight, depending on the size of the pellet. After centrifugation, the pellet was washed following the method of Winnpenminck 〚26〛, dried, and resuspended in sterile ultra-pure water. DNA concentration and quality was evaluated with a spectrophotometer.
2.2 DNA amplification and sequencing
To obtain the new 28S rDNA sequences, PCR reactions 〚27, 28〛 were performed in a 50 μl volume using 0.3 μg of template DNA and 50 picomoles of each one of the two primers. Primer sequences are: C’1, 5’ACCCGCTGAATTTAAGCAT3’; D2, 5’TCCGTGTTTCAAGACGGG3’; C’72, 5’GTGCAGATCTTGGTGGTAGT3’; D8, 5’ATTCCCCTGGTCCGCACCAGTT3’. The PCR mix usually contained (final concentrations) 20 mM Tris-HCl, pH 8.55, 16 mM (NH4)2SO4, 2.5 mM MgCl2, 150 μg ml–1 BSA, 5% DMSO, 330 μM dNTP each, and 0.3 μl (1.5 units) of Taq polymerase (Bioprobe), 50 picomoles each of the two primers and 0.3–1.2 μg of template DNA. Temperature cycles were performed using a Biometra trioblock. Thermal cycling was denaturation 94 °C 4 min, annealing temperature (AT) 2 min, extension 72°C 2 min, then 29 × (94 °C 1 min, AT 1 min, 72°C 1min.), 72°C 4 min, pause at 20 °C. The D2 domain was amplified with the primers C’1 and D2 (AT at 55 to 60 °C depending on the species). The D8 domain was amplified with the primers C’72 and D8 (AT also between 55 and 60 °C, depending on the species). PCR products, which were always opened in a separate room under a special hood, were checked by electrophoresis in 1% agarose-BET and TBE buffer 〚29〛, and visualised with the molecular weight marker VI of Boehringer Mannheim. PCR products were cloned in the phagemidic PCRscript TM SK(+) vector using the PCR-script TM SK (+) cloning kit (Stratagene) following the procedure recommended by the manufacturer. This kit has a unique SrfI site in the MCS of the vector. The ligation is performed in the presence of SrfI and Ligase; SrfI reopens religated vectors, and then maintains a high steady-state concentration of opened vector DNA, consequently increasing the ligation efficiency. A classical white/blue selection 〚29〛 was used for screening recombinant clones. Four white colonies per cloning were picked and grown overnight in L-broth at 37 °C. The phagemidic DNA was then extracted 〚29〛. For each colony, the size of the insert was checked by digestion of the recombinant phagemidic DNA with BssHII and electrophoresed in 1% agarose gel (as described above). Sequencing on microplates was performed with the T7 sequencing kit from PHARMACIA, using the method of terminator dideoxynucleotides 〚30〛. Each colony was sequenced with external vector primers KS and T3, and at least two colonies per cloning were sequenced. To get the complete variable domains D2 and D8 of the 28S gene, two internal primers were used for sequencing, C’2: 5’GAAAAGAACTTTGRARAGAGAGT3’ and C’8: 5’AACTTCGGGATAAGGATTGGCTC3’, respectively.
To obtain the new rhodopsin DNA sequences, the forward primers were Rh193: CXT ATG AAT AYC CTC AGT ACT ACC and Rh545: GCA AGC CCA TCA GCA ACT TCC G ; the reverse primers were Rh667r: AYG AGC ACU GCA UGC CCU, Rh1039r: TGC TTG TTC ATG CAG ATG TAG A, and Rh1073r: CCR CAG CAC ARC GTG GTG ATC ATG. DNA amplification was performed under the same proportions as above; however, the thermo-cycles were different: denaturation 94 °C, 4 min; annealing temperature (AT) 2 min; extension 72 °C, 2 min; then 29 × (94 °C, 30 s, AT 30 s, 72°C, 30 s); 72 °C, 4 min; pause at 20 °C. The annealing temperature was between 50 and 60 °C, depending on the species. PCR products were visualised, then purified by agarose gel extraction using Qiaex II kit (Quiagen). Thermo Sequenase Cycle Sequencing Kit (Amersham) was used for direct sequencing, followed with numbers of thermo-cycles: 95 °C/ min, 72 °C/2 min then 95 °C/30 s, 53 °C/60 s, 72 °C/60 s for 30 cycles, and 72 °C/10 min. The reacted samples were loaded after denaturation on each lane of an acrylamide–urea electrophoresis gel. Radiolabels were previously incorporated into the primers used for sequencing by end-labelling the 5 end of the primers with T4 polynucleotide kinase and 〚gamma 33P〛 ATP. The primers used for sequencing the different domains or genes were the same as those for PCR. However, internal primers were also necessary for completing the sequencing when PCR products were longer than 500 bp. After electrophoresis, the gel was dried and then exposed with an X-ray film for at least one night.
2.3 Quality of molecular data
The possibility of sequence errors was checked by comparing our sequences to the sequence obtained from a second exemplar, or to the sequence made from a new DNA extraction. Sequences were obtained and checked several times, from two times to four times. Sequences were read and entered twice using the MUST package 〚31〛. Alignments were manually performed using ED of MUST. Marginal segments of DNA sequences of each data set were excluded from the analysis because of incomplete taxonomic sampling. Portions of DNA sequences were excluded because of ambiguous alignments (alignments available upon request; the positions excluded are indicated in Table 2). For each data set, the numbers of taxa, characters, variable positions, positions informative for parsimony, and tree statistics are given in Table 3. Mutational saturation was explored for each gene by plotting the pairwise number of observed nucleotide differences against the pairwise number of inferred substitutions 〚32–34〛. For DNA sequences of coding genes, this was performed at each codon position for transitions and transversions separately. For this, the COMP-MAT program of MUST was used, the pairwise number of observed differences being computed by MUST and the pairwise number of inferred substitutions being computed using PAUP 3.1.1. 〚35〛 as the number of steps met in the path joining the two species in the most parsimonious tree. The patristic distance matrix was obtained by saving the MP tree with its branch lengths from PAUP and transferring it to the AF_PAUP3 and TREEPLOT programs of MUST. For each dataset, the correlation index (R) of the cluster of dots is given in Table 3. For the new rhodopsin sequence data, these saturation plots are given in Fig. 2.
Stretches of DNA of ambiguous alignment removed from the analyses are shown. These stretches include marginal regions in which the dataset becomes incomplete. Alignments are available upon request, either with (FASTA) or without (NEXUS) stretches of ambiguous alignments.
| Deleted Segments | Indels Coded as Characters | ||||
| 12S-16S | 1–532 | 749–1957 | 2136–2199 | 2452–2676 | |
| 18S | 1–106 | 2153–2178 | |||
| 28S D2 domain | 483–491 | ||||
| 28S D8 domain | 638–667 | ||||
| MLL (nuc) | 1–174 | 386 | 413–493 | 538–end | |
| MLL (aa) | 462–487 | 532–end | |||
| RAG1 (nuc) | 106–213 | 493–495 | |||
| RAG1 (aa) | 1–168 | 49-51 | |||
| Rhodopsin |
Data for the datasets explored. R: correlation index between observed and inferred differences as an estimation of the saturation (SAT.) of the sequences. Columns 2–5 give, for each sequence, the number of taxa sampled, the number of characters retained in the alignment, the number of variable sites, and the number of cladistically informative sites. Columns 6–10 provide data (the number of most parsimonious trees (MPTs), their length, consistency index, C.I., excluding uninformative sites and the retention index) for the most parsimonious trees found. Columns 12–15 provide the same data for the strict consensus trees calculated when more than a single MPT had been found.
| SAT. | SEQUENCES | MPTs | STRICT CONSENSUS | |||||||||||
| R | Taxa | Characters | Variable sites | Informative sites | Number | Length | C.I. | C.I. info | R.I. | Length | C.I. | C.I. info | R.I. | |
| 12S-16S | 0.542 | 20 | 634 | 334 | 225 | 7 | 1122 | 0.482 | 0.415 | 0.413 | 1186 | 0.456 | 0.39 | 0.348 |
| 18S | 0.715 | 13 | 1846 | 546 | 240 | 4 | 438 | 0.822 | 0.668 | 0.641 | 445 | 0.809 | 0.649 | 0.608 |
| 28S | 0.891 | 10 | 654 | 281 | 149 | 3 | 627 | 0.681 | 0.588 | 0.569 | 629 | 0.679 | 0.585 | 0.565 |
| MLL (nucleotids) | 0.951 | 24 | 331 | 277 | 201 | 4 | 1060 | 0.477 | 0.429 | 0.426 | 1066 | 0.475 | 0.426 | 0.420 |
| MLL (aminoacids) | 0.869 | 28 | 298 | 251 | 193 | 4 | 845 | 0.678 | 0.636 | 0.610 | 849 | 0.678 | 0.632 | 0.410 |
| Rag1 (nucleotids) | 0.855 | 19 | 405 | 283 | 233 | 1 | 1154 | 0.478 | 0.446 | 0.452 | — | — | — | — |
| Rag1 (aminoacids) | 0.652 | 29 | 233 | 153 | 86 | 4 | 483 | 0.776 | 0.724 | 0.540 | 547 | 0.686 | 0.622 | 0.268 |
| Rhodopsin (nucleotids) | 0.910 | 29 | 702 | 375 | 303 | 1 | 1655 | 0.382 | 0.351 | 0.481 | — | — | — | — |
| Rhodopsin (aminoacids) | 0.799 | 29 | 236 | 111 | 77 | 25 | 448 | 0.460 | 0.401 | 0.508 | 492 | 0.419 | 0.362 | 0.419 |
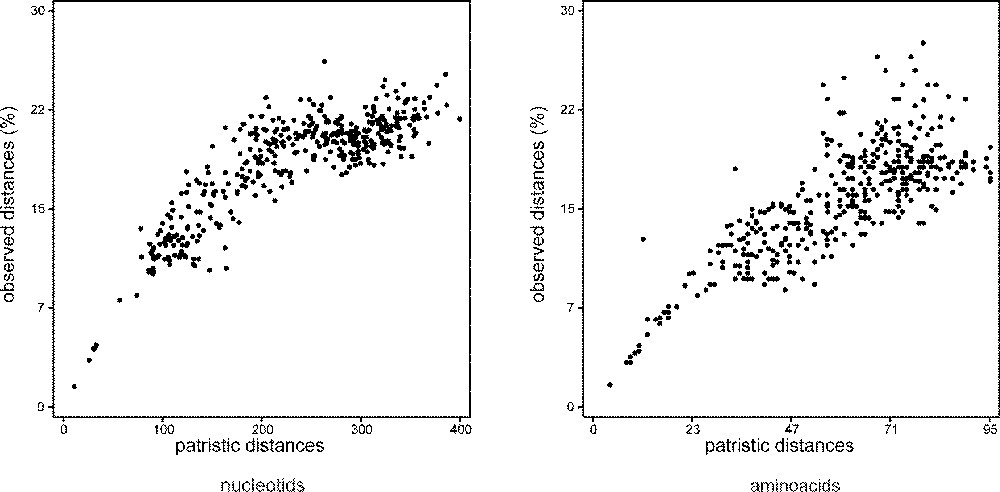
Absolute saturation plots for Rhodopsin transitions and Rhodopsin transversions. X axis: pairwise number of inferred substitutions; Y axis: pairwise number of observed differences (%).
2.4 Strategy for phylogenetic analysis
Reliability of a phylogenetic inference does not come from the statistical robustness of a clade, even when calculated from a ‘total evidence’ 〚23〛 approach 〚25〛. Following Kluge 〚23〛, and Barrett et al. 〚36〛, supporters of the ‘total evidence’ approach recommended to combine all the available data in a single matrix (i.e. the ‘simultaneous analysis’ of Nixon and Carpenter 〚24〛) in order to globally maximise the congruence of the whole set of available relevant characters. The assumption of this approach is that there are no significant natural differences between partitions, the outline of our data partitions being technical and historical artefacts. When the ‘total evidence’ approach is applied in molecular phylogenetics, the major empirical problem is the evaluation of reliability of clades. A number of molecular phylogeneticists use branch lengths and indicators of robustness, like the Bremer index 〚37〛, or bootstrap proportions 〚38〛 as indicators of ‘reliability’ of phylogenetic inferences from simultaneous analyses, a behaviour already criticised by Hillis and Bull 〚39〛. However, these robustness indicators do not escape from classical pitfalls of phylogenetic reconstruction 〚32, 40〛 provoked by unequal rates of changes among lineages or base compositional bias, pitfalls that are better detected through separate analyses. In particular, the long-branch attraction artefact 〚40–43〛 is so widespread and powerful that one must wonder whether a high bootstrap proportion can be given higher confidence than a low one. Therefore, in molecular phylogenetics, it is often impossible to know from a single tree whether the basal position of a long branch is due to a long-branch attraction artefact (the long branch being attracted towards the outgroup) or due to common ancestry, whatever the statistical robustness associated. Separate analyses are often of great help in making an opinion 〚40, 43–46〛. Robustness indicators being corrupted by positively misleading signals, it is clear that robustness is not reliability.
The rejection a priori of naturalness of partitions cannot be accepted. Molecular systematists generally recognise that the way homoplasy accumulates within genes is not completely randomised. Non-random aspects of molecular homoplasy obtained by functional constraints can be detected without phylogenetic tools through mutational hotspots within some positions or regions free to vary, and/or compositional bias analysis. These phenomena provide particular properties of homoplasy accumulated within a gene with regard to tree reconstruction. These properties that can be very different from one gene to another, provoking differing positively misleading signals which are far more difficult to obtain from a morphological matrix. For instance, a set of unrelated taxa sharing the same strong compositional bias in a gene will be ‘artefactually’ clustered in the tree based on DNA sequences of this gene. As a result, phylogenies of a set of taxa separately inferred from different genes can exhibit some degree of taxonomic incongruence. Robustness indicators (like bootstrap supports or Bremer supports) do not escape from these pitfalls or from long-branch misplacements 〚32, 42〛. These facts have been recognised for long ago, for instance under the notion of ‘process partitions’ of Bull et al. 〚47〛. If homoplasy accumulates in a non-random manner within genes while in a heterogeneous manner between genes, our partitions have some degree of naturalness, and separate analysis (without consensus) is first needed as an exploratory step to check the impact of differences in homoplasy storage on each phylogenetic inference.
Molecular systematics benefits from the ‘taxonomic congruence’ approach, which analyses datasets separately 〚48–51〛, at least as a heuristic step. The congruence of inferences separately drawn from independent data is a strong indicator of their reliability. If we keep in mind the fact that molecular homoplasy can have very different effects on tree reconstruction from one gene to another, obtaining the same clade from separate analysis of several genes despite this fact renders the clade even more reliable. In other words, obtaining the same tree or even some common clades means that there is a common structure in these datasets that must come from common evolutionary history. Miyamoto and Fitch 〚51〛 suggested that relationships among taxa that are supported by different independent datasets are particularly robust, even if the statistic supports are weak, equivalent to obtaining independent corroboration of an experimental hypothesis from a different experimental source. These mutual tests may be lost in combining datasets right from the beginning. Empirically, this point of view implies that two independent genes have poor chance to contain the same positively misleading signals. It is yet possible to imagine that two or three genes can exhibit the same positively misleading signals (for instance the same long branches due to common parameters in population genetics of the corresponding taxa), the risk here is by far lower than blindly trusting the bootstrap proportions from the direct simultaneous analysis. We would therefore be inclined to prefer the same clade repeatedly found from several datasets with low bootstrap proportions rather than a clade highly supported from a single dataset. In other words, the repeatability of a clade is a more convincing indicator of its reliability than bootstrap proportions are.
Nonetheless, separate analyses, if not followed by the simultaneous analysis, bear the burden of implicit uncontrolled weighting. Simply put, if conclusions are drawn from two trees, one based on 10 informative positions and the other based on 100, an implicit weighting of 1/10 is used in the conclusions. We acknowledge the need for basing our final phylogenetic inferences from the tree that maximises the congruence of all the available characters. Therefore, separate analysis is not the ultimate goal of phylogenetic reconstruction. The correct way to proceed is to combine advantages of both separate analysis (without consensus) and simultaneous analyses: simultaneous analysis is used to infer the ultimate clades, however separate analysis is required for assessing reliability of these clades. Priority is given to the criterion of repeatability over bootstrap proportions to assess reliability of clades found in the tree from the simultaneous analysis.
2.5 Phylogenetic analysis
Datasets include both protein-coding genes as well as ribosomal genes: rhodopsin gene DNA, nuclear 28S rDNA, nuclear 18S rDNA, RAG1 gene DNA, MLL gene DNA, and mitochondrial 12S-16S rDNA. For genes encoding a protein, the phylogenetic signal was also explored at the amino acid level. Following the strategy justified above, separate phylogenetic analyses 〚24, 25〛 were performed using parsimony with PAUP4 b6 〚52〛. Most parsimonious trees were obtained either through Branch and Bound search or heuristic search with 100 random stepwise addition sequences (MULPARS on), followed by TBR swapping trees without steepest descent. Gaps were treated as fifth state of characters. When an insertion shows the same sequence across taxa, this is recoded as a single character. For separate and simultaneous analyses, parsimonious trees were obtained without differential weighting strategies, and regardless of saturation detected in transitions. It has been shown from differing sequence datasets that homoplasy is not homogeneously spread across the tree 〚53〛, probably an effect of unequal rates through times and among lineages. This partly explains why under-weighting transitions and/or third codon positions more often leads to signal loss and less phylogenetic accuracy than extracting phylogenetic signal 〚33, 54–56〛. Moreover, some types of transitions accumulate saturation while others do not 〚33〛. The taxonomic congruence was determined through comparing separate phylogenetic trees without consensus. By principle, consensus techniques were not used for comparing trees from different sources of data because special attention was paid (1) to repeated clades and (2) to branch lengths in order to retain the possibility of detecting ‘artefactual’ branching (e.g. when a taxon escapes from its clade only in one of the three trees because of a rate acceleration in the evolution of the gene in this taxon). This information would have been lost in a strict consensus tree. For robustness analyses, Bremer supports were calculated 〚37〛 and bootstrap proportions 〚38〛 were obtained from 1000 iterations using PAUP. As this paper focuses on particular sister-group relationships, when a dataset did not yield the corresponding clade, the strength of the conflict between both topologies (i.e. with and without that clade) was measured using the Wilcoxon signed-rank test 〚57〛 as performed by PAUP4 〚52〛.
3 Results
The tree, or the strict consensus of the most parsimonious trees, obtained from each data set, is shown in Fig. 3. Table 3 shows the characteristics of these trees. The presence or absence of the Otocephala on the one hand, and the Protacanthopterygii (understood as a sister group relationship between esocoids and salmonids, plus osmeroid representatives when present) on the other hand, is shown in Table 4.
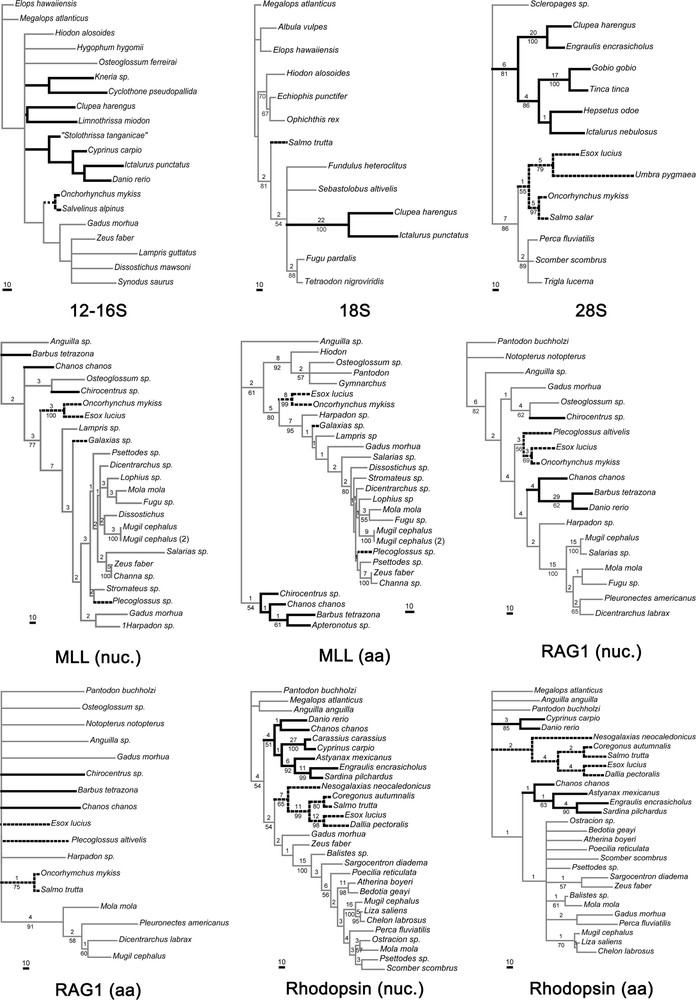
Most parsimonious trees or strict consensus of MP trees from each one of the molecular datasets. Characteristics of datasets and trees are given in Table 3. Branch lengths are given under ACCTRAN. Numbers above nodes are Bremer supports, numbers below nodes are bootstrap proportions calculated from 1000 iterations. Nuc.: nucleotide sequences, aa: amino acid sequences. In bold, the otocephalans; in dashed lines, the protacanthopterygians.
Repeatability of the two clades we focus on. In each square, the first symbol is the presence (+) or absence (–) of the clade in the strict consensus tree, the second is the number of equiparsimonious trees, the third is, when the clade is not present, the range by which the number of steps increases when the clade is constrained, the fourth is the corresponding range of P values of the Wilcoxon signed-rank test performed on tree lengths, obtained by constraining each equiparsimonious tree under the null hypothesis that the tree length of the constrained tree is not significantly different than the original length. For RAG1 amino acid dataset, notice that the clade of interest is present among the four equiparsimonious trees.
| 12S-16S | 18S | 28S | MLL (nuc.) | MLL (aa.) | Rag1 (nuc.) | Rag1 (aa.) | Rhodopsin (nuc.) | Rhodopsin (aa.) | |
| Otocephalans | – | + | + | – | + | – | – | + | – |
| 7 | 4 | 4 | 25 | ||||||
| 1122–1136 | 1060–1069 | 1154–1174 | 483 | 448–459 | |||||
| 0.0339–0.113 | 0.25–0.3556 | 0.0055 | present in 1 over 4 MPT | 0.0045–0.0389 | |||||
| Esocoids + Salmoniforms | Not available | Not available | + | + | + | + | – | + | + |
| 4 | |||||||||
| 483 | |||||||||
| present in 3 over 4 MPT | |||||||||
| Esocoids + Salmoniforms + Osmeroids | Not available | Not available | + | – | – | + | – | + | + |
| 4 | 4 | 4 | |||||||
| 1060–1108 | 845–884 | 483 | |||||||
| <0.0001 | <0.0001 | present in 3 over 4 MPT |
3.1 12-16S
This dataset exhibits a lack of support for almost every group except elopiforms, clupeomorphs, otophysans and salmonids. The monophyly of osteoglossomorphs and of ostariophsans could not be retrieved. All the other groupings have a low bootstrap value and Bremer support. This data set and the cytochrome b data (see below) show that mitochondrial genes are unsuited to solve the relationships of groups so distantly related as the clupeocaphalan components. The use of these sequences should be restricted to studies dealing with the interrelationships of quite closer species.
The absence of sequences of 16S from esocoids in sequences banks has prevented us from testing paracanthopterygian relationships with this data set.
3.2 18S
Otocephalans appear monophyletic with a very strong support: Bremer index of 22 and bootstrap proportion of 100. Unfortunately, no esocoid sequence was available to test the monophyly of protacanthopterygians.
3.3 28S
Some of the 28S sequences presented here are original (Esox, Umbra, Engraulis, Hepsetus), allowing one of the best-represented samples of otocephalans and protacanthopterygians, with six and four species, respectively. Both groups are retrieved, even though they show a somewhat weak support.
3.4 MLL
Nucleotide and amino acid sequences were available for this gene; so, analyses were performed using both kinds of sequences that show quite different results. Based on nucleotide sequences, the strict consensus of the four most parsimonious trees does not show the monophylies of the Otocephala as well as groups that are consensually accepted, e.g. osteoglossomorphs or clupeocephalans (the ingroup of the present study). However, from amino acid sequence analysis, the monophylies of these groups are retrieved. From nucleotide sequence data, constraining monophyletic otocephalans yields a tree length that is not significantly different than the original tree length (P between 0.25 and 0.36 according to each of the four MP trees). Both MLL nucleotide and amino acid sequence data support the sister-group relationship between esocoids and salmoniforms with high bootstrap proportions; however, protacanthopterygians fail to appear monophyletic, because Plecoglossus is nested within acanthomorph fishes and Galaxias is not grouped with the core protacanthopterygians (salminiforms and esocoids). From both MLL nucleotide and amino acid sequence data, constraining Plecoglossus and Galaxias to be the sister-group of the two other protacanthopterygians yields a significantly different tree length (P < 0.0001).
3.5 Rag1
The tree found with nucleotidic sequences shows the sister-group relationship between salmonids and esocoids and fails to recover that of clupeomorphs and ostariophysans, while the tree based on amino acid sequences is almost completely unresolved. These amino acid data are the only dataset not showing the monophyly of the esocoid + salmoniforms, even though it does not show any other alternative hypothesis. It is nevertheless interesting to notice that monophyletic protacanthopterygians are present in three of the four MP trees of 483 steps, and monophyletic otocephalans are found in one of these four trees.
3.6 Rhodopsin
This dataset is partly based on new sequences. It shows the best sample of otocephalans species, with four ostariophysans (one anotophysan and three otophysans) and two clupeomorphs. The monophyly of the Otocephala is found with the nucleotidic sequences, but not with the amino acid sequences. From amino acid sequence data, constraining monophyletic otocephalans yields a significantly different tree length. These results are not caused by a saturation of the sequences. As shown in Fig. 2, the sequences are not strongly saturated, even if the correlation index between the number of changes inferred and the number of changes observed is almost the lowest of all the datasets (Table 3). Both nucleotidic and amino acid sequences exhibit monophyletic protacanthopterygians. It is very interesting to notice that the sister-group relationships shown by this dataset between galaxiids (represented by Nesogalaxias neocaledonicus) and the clade (esocoids + salmoniforms) reconstruct a more complete sample of the Protacanthopterygii, even if it is relatively weakly supported by bootstrap values (it is better supported by Bremer index values). This contradicts the weird position of galaxiids found from the MLL sequences (Galaxias sp.).
3.7 Cytochrome b
Although we performed a phylogenetic analysis of cytochrome b sequences, they produced results that were clearly due to a high level of saturation, rather than a phylogenetic signal. We noticed that, even for a taxonomic sample limited to acanthomorphs, the cytochrome b sequences are highly saturated with superimposed mutations, even at the amino acid level (absolute saturation calculated as explained above, data not shown). It seems not surprising that the results obtained contradicted all the molecular and morphological hypothesis that had been previously proposed, unless one sample groups of taxa very distantly related between them and very closely related within each, and rooting on chondrichtyans and tetrapods, as did Lydeard and Roe 〚58〛. We conclude that cytochrome b sequences are not able to retrieve a phylogenetic signal at the level of the main teleostean lineages.
3.8 Repeatability across trees
Table 4 summarises the number of occurrences of the two clades we focus on. The clade grouping salmoniforms, esocoids and osmeroids is recovered four times over seven. Moreover, in one analysis (amino acid RAG 1 sequences), this grouping is among the MP trees, showing absence of signal against that clade. In two cases (MLL data sets), using a 5% threshold, the Wilcoxon signed-rank test 〚57〛 rejected the null hypothesis, according to which the length of the optimal molecular tree is not significantly different from the length of the constrained tree showing monophyletic protacanthopterygians. This case is due to the position of osmeriform representatives, not due to the sister-group relationship of esocoids and salmoniforms. If the protacanthopterygians are considered as the minimal core grouping esocoids and salmonids, that clade occurs six times over seven analyses. Again, in the seventh analysis (RAG1 amino acids), the clade grouping salmoniforms and esocoids is among the most parsimonious trees.
The Otocephala occur four times over nine analyses. Among the five analyses that do not recover that clade in the strict consensus tree, in one case the clade is among the MP trees (amino acid RAG1 sequences), showing the absence of significant contradiction. In the remaining four cases, the monophyly of the Otocephala was constrained and the strength of the conflict was measured using the Wilcoxon signed-rank test 〚57〛. Using a 5% threshold, this test did not reject the null hypothesis that the length of the optimal molecular tree is not significantly different than the length of the constrained tree (Table 3) in two cases (nucleotide MLL sequences, and 12S-16S sequences). In the two other cases, lengths of constrained trees were found to be significantly different (nucleotide sequences of RAG1, amino-acid sequences of rhodopsin).
4 Discussion
4.1 Molecular data
The present study (Table 4) supports a sister-group relationship between salmonids and esocoids, as well as between ostariophysans and clupeomorphs. We are able to provide answers to the questions we addressed because (i) multiple datasets are available and (ii) taxonomic congruence was used without consensus, providing power to assess the degree of confidence of a particular hypothesis that none of the data sets can give alone.
Concerning the otocephalans, two datasets over nine failed to recover their monophyly, for which alternative tree showing monophyletic otocephalans was shown to be significantly longer. Such a contradiction between datasets, even sometimes between nucleotide and amino acid sequences of the same gene (Rhodopsin), suggest that random homoplasy has the power to positively affect the outcome of the Wilcoxon signed-rank test when used to compare tree lengths. In the case of 12S-16S data, a single tree among the seven most parsimonious trees, when constrained to show monophyletic otocephalans, led to the rejection of the null hypothesis (P = 0.0339), while other equiparsimonious trees did not. This is the reason why the range of P values goes below the 5% threshold.
Concerning the clade salmonids + esocoids, the probability of finding the same group from six different datasets corresponding to four different genes by chance alone is extremely low. The result therefore strongly suggests an underlying phylogenetic signal. As a consequence of our results, the protacanthopterygians sensu Johnson & Patterson 〚1〛 must be redefined to include esocoids. The inclusion of galaxiids remains controversial and cannot be answered by the present work. Indeed, the position of Galaxias in trees from MLL sequences contradicts monophyletic protacanthopterygians, while the position of Nesogalaxias in trees from rhodopsin sequences corroborates their monophyly. From the MLL sequence data, constraining Galaxias to be the sister-group of the clade Salmonidae + Esocoidei led the Wilcoxon signed-rank test to show that tree lengths are significantly different (P < 0.0001 for both MLL amino acid and nucleotide sequences). This could suggest that the MLL DNA sequence of Galaxias used here might have been misidentified. In the same way, Plecoglossus is nested within acanthomorphs, while RAG1 sequences show that genus as a protacanthopterygian, suggesting errors from the MLL sequence data themselves.
4.2 Morphological data
Even if the relationships of teleosts have been and still are thoroughly studied, little researches have been conducted in order to test the interrelationships of the groups that are consensually considered monophyletic and conventionally given a nomenclatural rank of superorders. This situation has driven most authors to accept the results of Patterson and Rosen 〚5〛 as the accepted framework to discuss in. The only work that has attempted to test this framework using morphological data and Recent and fossil taxa, and including both ostariophysans and clupeomorphs is the analysis performed by Arratia 〚3, 4, 12〛. Her taxonomic sampling did not include neoteleosts, because the goal of Arratia was the discussion of what she called basal teleostean interrelationships; thus, the sister-group relationships of esocoids and salmonids are not relevant without the test of other euteleosteans. Johnson and Patterson 〚1〛 discussed relationships of basal euteleotean groups, but the limited taxonomic sampling of molecular data of these groups makes any comparison of both results too superficial.
4.2.1 Arratia’s data
In the first analysis performed by Arratia with all the taxa, fossil and recent that she sampled 〚12〛, a single topology was found, showing the Otocephala. One of the two synapomorphies supporting the group was a character-state labelled ‘another condition’ for a feature concerning hypurals (her character 112 〚59〛); the other synapomorphy was an early ossification of the autopalatine. Thus, one of the two synapomorphies for the Otocephala was non-homologous, as it was, actually, a non-feature.
Arratia 〚3〛 slightly modified her taxonomic sampling and the characters used. She found two equally parsimonious topologies, one of them showing the Otocephala. The characters supporting this clade are the same as in Arratia 〚12〛. The consensus she presented did not show a resolution of the clupeomorph–ostariophysan relationships.
Arratia 〚4〛 analysed again the interrelationships of non-neoteleost teleosteans. She presented a series of seven cladograms. The first five analyses concerned fossil and extant taxa, but the outgroup was changed for every analysis to compare the impact of polarisation. The two last analyses involved a reduced taxonomic sample of extant taxa. Using the fossil Watsonulus (a parasemionotid), some halecomorphs, lepisosteids and pycnodonts or a hypothetical ancestor as outgroup, she found the Otocephala, supported by the presence of an ankylosis or fusion between the mesial extrascapular (= supratemporal) and the parietal bone or the parietal and the supraoccipital. This character deserves a detailed explanation. Patterson and Rosen 〚5〛, Grande 〚60〛 and Lecointre and Nelson 〚10〛, among others, have used the supratemporal commissural canal primitively enclosed in parietals or in parietals and supraoccipital as a character to support the monophyly of the Clupeomorpha 〚5, 60〛 or of the Otocephala 〚10〛. Patterson 〚61〛 considered that the presence of the supratemporal commissure enclosed in the parietals or the parietals and supraoccipital resulted from a fusion of the mesial and/or the lateral extrascapular and these bones. Grande 〚13〛 considered that the fusion was between the lateral extrascapular and the parietals, an obvious slip, because a lateral extrascapular is present in clupeomorphs. Arratia 〚3, 12〛 coded this character absent in Chanos, because she disagreed with the hypothesis of the fusion between the mesial or the lateral extrascapular and the parietals, even if the supratemporal commissural canal does pass through the parietals in this taxon 〚62〛.
Arratia 〚4〛 splitted this character. The first one was as coded by Patterson and Rosen 〚5〛, Grande and Lecointre and Nelson 〚10〛, but the second one was defined as an “ankylosis or fusion between the medial extrascapular and the parietals alone or the parietals and the supraoccipital”. We think that these two characters are just two ways of defining the same feature, i.e. the supratemporal commissural canal passing through the parietals or through the parietals and the supraoccipital (if this bone separates the parietals, i.e. in teleosts having a latero-parietal skull), at least according to our present knowledge of the ontogenies of that feature. Arratia considered both definitions as different, as illustrated by the fact that Chanos was coded absent for the first character and present for the second one. Arratia’s arguments for distinguishing both were the ontogeny of these features. She observed the fusion or ankylosis in Chanos ontogeny 〚63〛 and many ostariophysans, but never saw the fusion in clupeomorphs, even in very young specimens. Nevertheless, she coded present for the fusion or ankylosis of the medial extrascapular in Recent clupeomorphs and in the Early Cretaceous Santaclupea 〚64〛 but ‘?’ in Diplomystus. The redundancy of the two features shows that she contradicts herself. She did not give arguments to distinguish the fusion from the presence of the supratemporal commissural canal passing through the parietals. This kind of redundancies is found throughout Arratia’s work and has probably an impact in her results.
Her sixth and seventh cladistic analyses consisted of a reduced taxonomic sample of only Recent taxa. Using the fossil basal teleosteans Leptolepis coryphaenoides and Pholidophorus bachei as outgroups, the relationships of clupeocephalan groups were unresolved. Using the extant Amia and Lepisosteus she found the Otocephala as a monophyletic group supported by five characters:
- • (i) the ankylosis of the mesial extrascapular and the parietals or the parietals and supraoccipital;
- • (ii) the early ossification of the autopalatine discussed before;
- • (iii) the neural arches of most abdominal vertebra with fused halves of the neural arch forming a medial neural spine, and not with separate halves.
The latter character state is present in most basal clupeomorphs, e.g. in Armigatus brevissimus. This character is indeed present in most non-clupeocephalans and is a plesiomorphy for basal teleosts.
- • (i) Anteriormost uroneural present as one long uroneural. This putative synapomorphy is a consequence of one of the samplings made by Arratia, composed only of extant taxa. Basal fossil clupeomorphs and anotophysans show two or three long uroneurals.
- • (ii) Last, bases of hypurals 1 and 2 not joined by cartilage at any growth stage. Again, the question of the knowledge of the ontogeny of fossil taxa is raised. Moreover, cartilage is rarely preserved in fossil taxa, so no assertion can be made about basal clupeomorphs and anotophysans. Nevertheless, in this work Arratia did not use the ‘other condition’ character-state she had used before for this character.
We must conclude that the phylogenies of basal teleosts of Arratia, and the characters proposed by her to group otocephalans are biased by taxonomic sampling of fossil clupeomorphs and ostariophysans and, above all, by the use of ‘non-applicable’ and ‘other condition’ as character states. These biases are strong enough to make us think that Arratia’s work does not provide substantial evidence of morphological characters supporting the Otocephala.
4.2.2 Lecointre and Nelson’s interpretation
Lecointre and Nelson 〚10〛 proposed several possible synapomorphies that could provide evidence for a grouping of clupeomorphs and ostariophysans. These characters were the following ones.
- • (i) The presence of a pleurostyle. The pleurostyle is absent in all basal (non-clupeiform) clupeomorphs and gonorynchiforms, and has to be considered a convergence, given the context of generally accepted phylogenetic hypothesis.
- • (ii) Fusion of hypural two and ureal centrum one. The fusion is absent in some fossil anotophysans and also in some fossil clupeomorphs (e.g. Sorbinichthys elusivo, 〚65〛).
- • (iii) Fusion of extrascapulars and parietals. As discussed above, this is one of the possible putative synapomorphies of the Otocephala. One must notice that this canal is present within parietals in most osteoglossomorphs 〚67, 68〛. Osteoglossum, Scleropages, Heterotis, Arapaima show this feature but it is absent in Pantodon or Hiodon. In Lecointre and Nelson’s scheme, this character should therefore appear twice in teleosts. In most of Arratia’s results, elopomorphs are seen as the sister group of osteoglossocephalans, comprising osteoglossomorphs plus clupeocephalans. In Arratia’s scheme, then this character is a synapomorphy of osteoglossocephalans, with a loss in euteleosteans. In both schemes, the character costs two steps. Ornategulum is considered as a clupeomorph by Forey (〚66〛 and pers. comm., 2001), even if it lacks some of the clupeomorph synapomorphies proposed by Grande 〚13〛 also presents a canal that passes through the supraoccipital, but not through the parietals 〚66〛. Patterson and Rosen 〚5〛 noted the presence of a commissural supratemporal canal in Ornategulum.
- • (iv) Fusion of haemal spines and centra anterior to pleural centrum two. This feature is present in all the clupeomorphs and ostariophysans, in Ornategulum, but also in most Jurassic basal teleosts (Ascalabos, Pachythrissops, Anaethalion, ‘Elops-like’, Leptolepides and Lycoptera 〚3, 4, 12〛 and in some osteoglossomorphs (Pantodon, Osteoglossum, Arapaima but not in Hiodon or Scleropages 〚67–69〛). The distribution of this character should be tested in the framework of a parsimony analysis, taking these taxa into account before any assessment of its relevance.
The ‘doubtful synapomorphies’, as pointed out by Lecointre and Nelson, need also to be further sampled and tested in order to become putative synapomorphies of the Ototcephala. There are some other character states grouping the otocephalans together in Johnson and Patterson’s (〚1〛, fig. 23:313) tree; however, the level of homoplasy associated with these features make them of too poor value to define the group.
5 Conclusion
We have provided molecular evidence favouring the Otocephala, a clade comprising Clupeomorpha and Ostariophysi. The datasets that do not show this clade do not support any alternative hypothesis. Much more work is needed in morphology to test molecular results. New fossil discoveries show that some basal clupeomorphs do not present any of the cranial (Forey, pers. comm. 2001) or some of the caudal skeleton (pers. obs.) synapomorphies proposed by Grande 〚13, 60〛 for this group. Despite methodological problems of some previous works 〚3, 4〛 that grouped clupeomorphs and ostariophysans within the Otocephala (the Ostarioclupeomorpha of Arratia), one must retain from the overall analyses the supratemporal canal passing through the parietals as the most reliable otocephalan synapomorphy.
We have also provided very strong molecular evidence favouring a clade grouping esocoids and salmonoids. If this clade can be considered as central protacanthopterygians, the limits of that concept cannot be assessed here, because of the lack of sequences of several putative components like stomiatoids or argentinoids. The osmeroid samples available, a galaxiid and a plecoglossid (according to the classification of Nelson 〚6〛 as well as Johnson and Patterson 〚1〛 p. 307) are not sufficient to answer this question. We can tentatively accept the Protacanthopterygii sensu Johnson and Patterson 〚1〛 modified to include esocoids. Our estimates of higher clupeocaphalan relationships, based mostly in Johnson and Patterson 〚1〛 can be summarised as follows:
Clupeocephala
Otocephala
Clupeomorpha
Ostariophysi
Euteleostei
Protacanthopterygii
Argentiniformes
Salmoniformes
Esociformes
Neognathi (= Neoteleostei)
New genes must be proposed that will be able to retrieve the maximum quantity of information at this taxonomic level. Our work suggests that mitochondrial genes are not appropriate at all for such a large phylogenetic problem, but nuclear, coding sequences seem to be the correct way to go on.
Acknowledgements
We thank Jean-Jacques Albaret, Wei-Jen Chen, Michel Hignette, François Meunier, Pietr Rab, Bernard Séret, and Mélanie Stiassny for having provided samples. We also thank Hervé Lelièvre and Simon Tillier for discussions and support.