

1 Introduction
Biological conservation of wildlife populations may be basically influenced by their social organisation [1]. Although most social behaviour, and especially cooperative behaviour, is recognised to improve the fitness of the group, numerous species living either in packs, herds or colonies are structured into breeding units such that the gene flow is affected by what one could call a family effect. Local populations often consist of family groups that prevent random mating thus emphasising the breeding unit level as a decisive sub-level in population genetics [2,3]. Because populations with small effective size give rise to genetic depletion [4,5], group-living species are suspected to be affected by inbreeding. Thus, reducing the effective number of breeders (Ne), the social organisation may result in a loss of genetic diversity. Furthermore, such a genetic loss could considerably increase in polygynous groups whenever reproduction is under full control of a single dominant male [6]. By contrast, solitary species are supposed to preserve high genetic diversity by facilitating an equal share of breeding among animals. Because of their solitary habits, individuals are expected to mate almost randomly within populations.
Only a few mammals however are really solitary. Species that display solitary habits are chiefly predators such as most of Felidae and a number of Ursidae and Mustelidae [7]. In these species, the pattern of social organisation usually depends upon resource availability or competitive interactions, or both. In mustelids, there is evidence that the solitary lifestyle is an adaptive response to the exploitation of a patchy environment until resource depletion [8]. Numerous mustelids are regarded as declining species, such as polecats, martens or otters while others are especially endangered and in need of urgent recovery plans, like the European mink or the Black-footed ferret [9–11]. The nocturnal and secretive habits of most mustelids have led to a lack of knowledge on their social organisation but they are usually portrayed as solitary and polygynous species [12]. It may therefore be predicted that they mate randomly and that such a solitary life should prevent mustelids from inbreeding.
Nevertheless, because such continuously distributed population included very scattered individuals, the solitary habits of mustelids could affect the neighbourhood area size. The neighbourhood area represents the area where animals could mate randomly and determines the effective size of a population [13]. Because inbreeding and population survival are affected by effective population size [5,14], the assessment of genetic neighbourhood area is needed as a basic step procedure [15,16].
This paper aims to apply a social organisation approach to a mammal living an uncharacteristic lifestyle, the European polecat Mustela putorius. We investigate genetic variance and neighbourhood in the polecat related to its solitary habits and spacing pattern in order to explore how this atypical social structure affects the ability to retain genetic diversity in a biological conservation perspective.
2 Materials and methods
2.1 Social system
Because of their territorial habits, the social organisation of mustelids was inferred from their spacing pattern. Pooled data, obtained from 1984 to 2002, from 42 radiotracked adult polecats (22 males and 20 females) in western France, were used. Animals were located by triangulation with at least one location per hour. Data were transferred to a square grid of 50 m a side to take into account the imprecision of the technique. The activity area was evaluated by the convex polygon method (see [8,17]). The number of simultaneous localisations referred to polecats simultaneously on the same square. Breeding displacements were measured between the first location out of the breeding period (when individuals were live-trapped) and the most distant location recorded during the breeding period.
2.2 Genetic neighbourhood
Capture–mark–recapture programs were conducted near the Tenu river (Loire-Atlantique) between 1996–2002, an area where polecat is recognised as being abundant. Monthly trapping sessions were conducted using 70 box-traps distributed every 75–100 m in lines within an area of 280 km2 (40 km×7 km) (DPN authorisation). Considering sexual differences in external characteristics, capture data for mature animals were divided into a breeding period (males: from February to May; females: from February to August) and a non-breeding period (males: from June to January; females: from September to January). The abundance of polecats N was estimated using the Program Mark [18] according to open population models [19]. The genetic neighbourhood area is determined as with S2 the variance of breeding displacement and T the adult life-time period over which an animal can breed [13]. Estimates of adult life-time were based on 4, 6 and 8 years, because mature male wild polecats averaged 4–5 years old and reached a maximum of 7 years [20]. Although extensive zones were unoccupied by polecats, the population size within the neighbourhood area was assessed from polecat abundance. Based on the respective number of males and females, the effective population size Ne was estimated as Ne=(4·Nm·Nf)/(Nm+Nf) [13].
2.3 Allozyme variations
Samples from road-killed polecats were collected between 1996 and 2001 from five areas of Western France from populations considered abundant (Brière, Vendée), normal (Anjou, Sologne) or declining (Brittany) (DPN authorisation). Crude extracts from tissue were centrifuged at 10 000g and a starch gel electrophoresis (Sigma) was performed using three buffer systems, TC6, TC8 and TEB (see [21,22]). Slices were stained for 24 enzymes encoded by 38 gene structure loci following Pasteur et al. [23] and Rothe [24] procedures. Loci successfully resolved were AAT-1 and AAT-2 (2.6.1.1), ACO-1 and ACO-2 (4.2.1.3), ADA (3.5.4.4), AK (2.7.4.3), CK-1 and CK-2 (2.7.3.2), DDH-1 and DDH-2 (1.8.1.4), EST-1 and EST-2 (3.1.1.1), FUMH (4.2.1.2), GLY2DH (1.1.1.29), G6PDH (1.1.1.49), GPI (5.3.1.9), HK-1, HK-2 and HK-3 (2.7.1.1), IDH-1 and IDH-2 (1.1.1.42), LDH-1 and LDH-2 (1.1.1.27), MDH-1 and MDH-2 (1.1.1.37), ME-1 and ME-2 (1.1.1.40), MPI (5.3.1.8), PEP-1 and PEP-2 (3.4.11.1), PGDH (1.1.1.44), PGM-2 (2.7.5.1), PNP (2.4.2.1), SDH (1.1.1.14), SOD (1.15.1.1), TPI (5.3.1.1), and two non specific proteins. F-statistics were assessed using GENETIX with 100 permutations [25].
3 Results
3.1 Spacing pattern
The activity area of male polecats averaged 1.2 km2 (SD=0.39) in marshes and woodlands while the females used a significantly smaller area reaching only 0.4 km2 (SD=0.15). Polecats could also use linear home range along 4.8 km of river banks for males while females exhibit more restricted movements along 2.8 km of stream. A partial overlap ranging from 8% to 33% was found between adult male and female ranges. The overlap index reached a maximum during the breeding period. At this period, female movements were more restricted than male movements. Most male polecats displayed straight tracks whereas females tended to occupy the same area. Moreover, some males went rushing across the home-range of other males in straight distances exceeding 16 km.
Nevertheless, animals were rarely located simultaneously in the same zone. The proportion of simultaneous locations between two adult females in the same zone only averaged 5.3% (SD=3.4%) and 8% between males and females whereas no direct tolerance was observed in adult males (Fig. 1A). Moreover, the duration of the common use of an area averaging 1.2 days (SD=1.24) did not exceed four days during the breeding period (Fig. 1B).
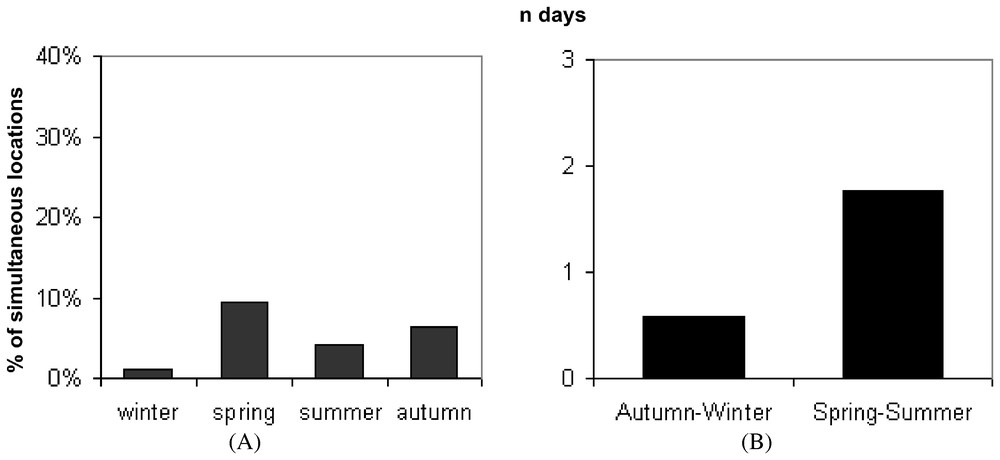
(A) Proportion of simultaneous locations between two adult polecats. (B) Mean duration of the common use of an area by two adult polecats.
3.2 Allozymic variations
Inferred from allozymic variation in 38 scored loci, the observed heterozygosity averaged Ho=0.051 (SD=0.115) for the 5 populations (Table 1). Despite a high level of allozymic polymorphism at p<0.01 reaching up to 24%, every polecat population exhibited a deficit of heterozygotes, the expected non-biased heterozygosity (mean HNB=0.081; SD=0.162) always showing higher values than the observed heterozygosity. As a result, the FIS index inferred from 100 permutations reached FIS=0.367 over populations. This heterozygote deficiency emphasizes a strong inbreeding. Unsurprisingly, polecats from Brittany, where polecats were considered as declining, showed the lowest genetic diversity.
| Polymorphism | H o | H NB | F IS | |
| Anjou | 23.7 | 0.065 | 0.077 | 0.165 |
| SD | 0.159 | 0.160 | ||
| Vendée | 23.7 | 0.053 | 0.072 | 0.269 |
| SD | 0.114 | 0.144 | ||
| Brière | 18.4 | 0.058 | 0.068 | 0.149 |
| SD | 0.136 | 0.153 | ||
| Brittany | 21.0 | 0.029 | 0.059 | 0.508 |
| SD | 0.065 | 0.128 | ||
| Sologne | 18.4 | 0.047 | 0.076 | 0.385 |
| SD | 0.131 | 0.155 | ||
| Total | 23.7 | 0.051 | 0.081 | 0.367 |
| SD | 0.115 | 0.162 |
3.3 Genetic neighbourhood
A total of 29 adult polecats was live-trapped in the study area. Thus the abundance could be estimated to n=35 individuals (SD=11.1) for 280 km2. Adult females predominated in the populations with 58.6% while adult males represented 41.4%.
Breeding displacement significantly differed (between males and females) (twelch=4.56; df=25; p=0.0001) averaging 2.1 km (SD=1.3) for females and 6.1 km (SD=3.9) for males (Table 2). Based on mean variance, the genetic neighbourhood was evaluated to an area of A=318 km2 but could greatly vary regarding different adult life times (Fig. 2). The estimate of population size within the neighbourhood area therefore ranged from n=26.5 to n=53.1 (Fig. 3A). Taking into account the sex ratio gave slightly lower values ranging from Ne=25.7 to Ne=51.5 (Fig. 3B).
Breeding displacement
| Males | Females | Average | |
| Mean distance | 6.14 | 2.09 | 4.21 |
| SD | 3.93 | 1.29 | 3.58 |
| Variance | 15.43 | 1.67 | 12.85 |
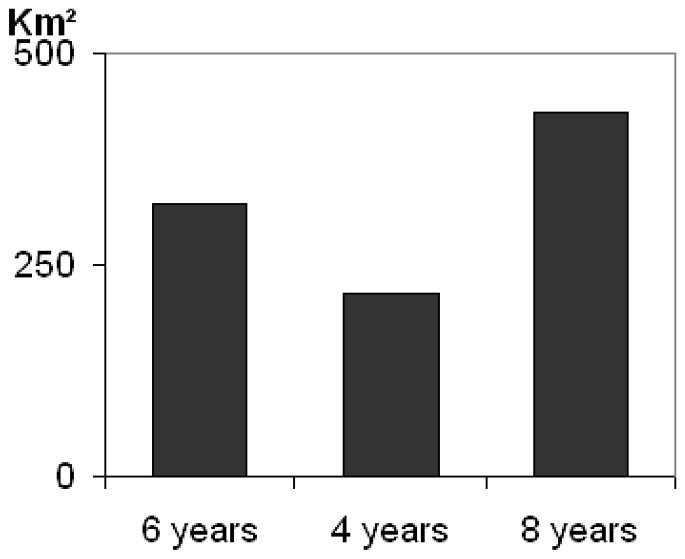
Assessment of genetic neighbourhood area in polecat regarding different adult life times.
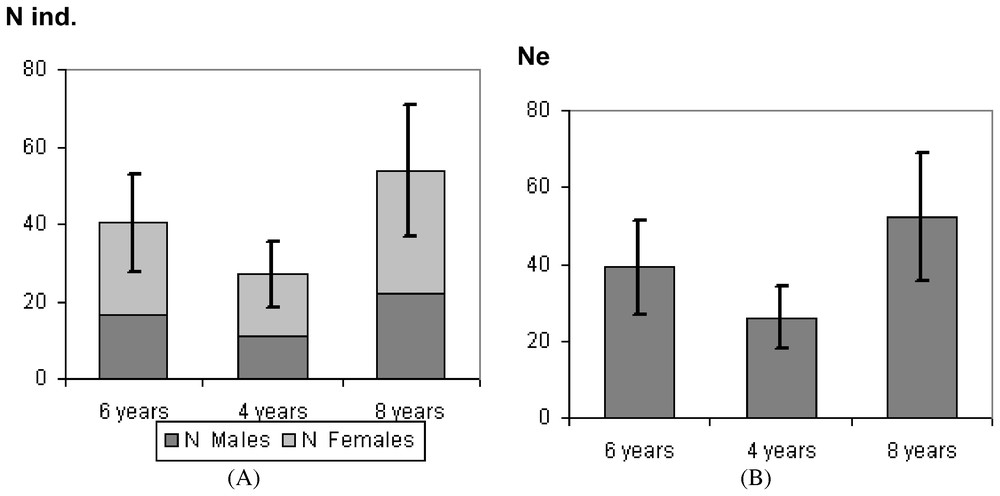
(A) Estimate of population size within the neighbourhood area. (B) Estimate of effective population size Ne within the neighbourhood area.
4 Discussion
Polecats were shown as typical mustelids living a solitary life based on spatio-temporal segregation of space use. The activity area of males could overlap the home-ranges of several females but they did not simultaneously exploit the same zone. Such a segregation was also evidenced between males and females. Only during the breeding season could the females exhibit a higher tolerance resulting in successive polygynous breeding units. By contrast, a high number of males avoided intruding an area already occupied by another male and achieved long-distance movements, probably searching for mate opportunities. Such a segregation of space use between resident and transient individuals was found in numerous solitary mustelids [17,26] and probably constitutes their basic social organisation. In strict biological terms, the word “solitary” should refer to the absence of social interactions whereas these species indirectly exhibit numerous social interactions, using scent marks, although they generally avoid direct contacts. We proposed to name individualistic these species with such a jealous use of space because they show indirect social interactions based on scent marking [27] and because these species are structured in diffuse breeding groups. Therefore, such species quite show individualistic habits primarily based on variations of the conspecific tolerance leading to a continuously distributed population.
Polecats were not only evenly scattered because of their spacing pattern but also showed large sex differences in breeding dispersal. Long distance dispersal events in males are often associated with polygyny [28,29]. Such sex-biased dispersal may decisively reduce inbreeding in populations by favouring gene flow [30] and sex-biased dispersal is proven to favour inbreeding avoidance in social mammals [31]. Nevertheless, all polecat populations in western France exhibited a strong inbreeding. Indeed, numerous species of mustelids exhibited low level of heterozygosity (see Table 3) [21,32,33]. Two reasons could be evoked for understanding such a discrepancy. First, despite their intolerant way of life, mustelids did not randomly disperse for breeding, mating being favoured in contiguous home-ranges [22]. The polygynous resident male jealously kept a watch over females, evicting the other males. Secondly, the genetic neighbourhood occurred in a very large area but the estimate of polecat abundance provided a very low value, emphasising the fact that individualistic habits result in a scattered and small-size population.
That mustelids, like numerous other predators, exhibit populations with small effective size is not surprising. Nevertheless, for these species, the advantage of using an exclusive area providing the nutritional requirements alone may be insufficient to compensate for the genetic cost incurred from an individualistic lifestyle. Furthermore, the level of scattering of animals is higher than their home-range size let suppose, supporting the argument that their intolerance and their individualistic habits decisively contribute to dispersion and small population size. Such a scattering did not only result from resource dispersion since it is exceeded the home range size. When resources are scarce, mustelids enlarge their home ranges [34,35]. Therefore, and despite the jealous defence of their trophic resources and of their sexual prerogatives, the individualistic lifestyle of mustelids is proven to be little efficient to prevent populations from inbreeding. While dispersal has been shown to enhance the survival of small populations through a “rescue effect”, the intolerance of individualistic mustelids may affect their dispersal.
5 Conservation implications
Documenting genetic diversity is a basic prerequisite for biological conservation and management strategies for the recovery of endangered species [36]. The individualistic habits could worsen the high vulnerability of very endangered species showing a population bottleneck such as the European mink, Mustela lutreola [33]. Based both on theoretical and empirical considerations, the effective population size required for a population to avoid inbreeding depletion and retain evolutionary potential is assessed to Ne=500–1000 individuals [13,37–39] and even upwards to 1000 individuals [40,41]. From the estimate of genetic neighbourhood area, polecats showed a very low effective population size below 55 individuals although the assessment of genetic neighbourhood and of polecat abundance was carried out in a studied area where polecat populations were regarded as especially abundant. Several demographic parameters should be included to enhance these preliminary estimates. However, such data should amend the usual assertion about the expected mustelid abundance and emphasise the vulnerability of endangered mustelids.
Our results suggest that mustelids exhibited small scattered populations restricting the search for mate opportunity. Most mustelids exploited their home-range through an area restricted search and the distribution of animals was directly affected by resource dispersion [8,35]. The first measure for conservation should be to preclude the obstacles jeopardising the breeding dispersal. The second proposal would be to reinforce populations within the neighbourhood area especially because individualistic mustelids were not uniformly distributed over extensive areas and deserted large portions. Nevertheless, and although the applications of conservation measures firstly depend upon the habitat quality, any mustelid reintroduction process should require an understanding of the factors which occurred in the variations of the conspecific tolerance.