

1 Introduction
The advent of high-throughput DNA sequencing for comparative genomic analysis and for expression studies requires an integrated approach to the storage, manipulation and analysis of data. For instance, through the use of genetic microarray chip technology, the complex interplay of thousands of genes is revealed by simultaneously monitoring thousands of individual gene expression levels. DNA chips consist of many short oligonucleotide, gene or EST fragments that are complements to target sequences attached or “spotted” onto a glass or silicone substrate [1,2].
Analysis of such a large amount of expression data has many difficulties. For instance, file sizes for an Affymetrix GeneChip image are roughly 50 Mbytes and the resulting analysis files (as tab delimited spreadsheets) are between 5 and 10 Mbytes in size for each analysis pass. This requires reasonably powerful computational resources and scalable software packages in order to conduct comparative analysis effectively and efficiently. In addition, it is important to ensure robust and rigorous statistical analyses are up-to-date with the latest developments in the technology. This involves continual reanalysis that is difficult to track and record. Of special interest for this paper is the ability to examine the bioinformatics analyses used to determine which sequences have been chosen to be spotted onto the DNA chips. Typically, this information is usually not available, or only limited details are provided. Thus, insufficient tracking and auditing of these processes will ultimately lead to difficulties in data analysis, potential misinterpretation of results as well as potentially missing errors resulting from incorrect data manipulation. Bioinformatics analysis tracking or what we refer to as Bioinformatics Analysis Audit Trails (BAATs) are essential for the purpose of retracing steps at any stage and is therefore critical to the interpretation of complex information contained within expression data. There is an urgent need to develop bioinformatics software that incorporates BAATs into all bioinformatics analysis. We now describe a typical microarray analysis before we describe a complementary system for comparative genomic analysis, called YABI, which implements BAATs.
As intimated above, microarray analysis has numerous processing steps with important choices that must be made at each point. To the biologist, this typically refers to the analysis of gene expression levels from one or a number of microarray experiments. However, the critical preliminary bioinformatics analyses required to determine which biological samples to spot onto the chips in the first place is equally important, if not more so. The issues that need to be addressed include: which genomic databases and their versions were searched to arrive at the sequences to spot (e.g., to create a unigene set [3]); and what is the comprehensive bioinformatics pipeline process implemented, including the specific bioinformatics tools, their versions, and parameters used. However, typically this type of information is not available or has not been tracked at a sufficiently detailed level to be referred to at the actual time of a given subsequent microarray experiment.
As a simple illustration of the steps involved, a typical microarray experiment can usually be characterised as a number of linear steps: (i) obtain material (libraries of genes/oligos/ESTs, etc.), (ii) design and produce slides, (iii) hybridise control and sample materials, (iv) scan array (image), (v) process image data, (vi) analyse data, (vii) data mining. Each of the steps above has a multitude of sub-steps. It is important to note that, while a microarray experiment is typically described as a linear process, in practice there are usually many instances where an iterative process is necessary to optimise the process, often requiring backtracking to earlier stages and re-running the steps with different parameters and/or procedures.
The above details are normally recorded in a number of places, such as the equipment user's notebook, the final image, related computer files and equipment log files. This information is the minimum required that would enable the experiment to be duplicated and/or checked. Some of this information can be kept on a computer system running as a “Laboratory Information and Management System” (LIMS). The amount and quality of this information is up to the individuals undertaking the various tasks.
A LIMS is able to store an instant snapshot of an experiment from start to finish (the amount and quality of the information depends on its design and capabilities), enabling easy examination of the process as well as facilitating changes where necessary as a project develops. There are numerous commercial and public software packages to do this including ArrayInformatics from Perkin Elmer and BASE [4,5]. They typically use a database management system as the underlying storage mechanism for the myriad of details of a group of microarray experiments. However, whilst these types of systems are excellent at displaying and manipulating the current ‘status’ and configuration of the project, a number of shortcomings are apparent. Firstly, the history of an experiment is not usually kept. For example, if part the way through analysing an experiment, the operator changes normalisation parameters, no record of the previous setting are usually kept. Secondly, there is typically no tracking when multiple users analyse the same data except perhaps in very coarse detail such as a laboratory notebook. Thirdly, details of the batch numbers of reagents or serial numbers of equipment are usually not kept except peripherally (although some software packages have this functionality). Fourthly, there are no details of the analysis process other than the final results. That is, BAATs are not implemented to record details such as software package names, versions, systems installed on and dates used. More importantly, these packages do not typically extend to the data mining stage that requires thorough bioinformatics comparative genomic analysis on completion of a microarray experiment(s). Whilst subsequent versions of LIMS systems such as BASE might address many of these issues raised, comparative genomic analysis and data mining are not well integrated. Thus, there is a need to establish LIMS-equivalent systems that can conduct rigorous data mining to complement microarray analysis LIMS.
In this paper we describe the prototype system YABI, which implements BAATs for comparative genomic analysis. We propose to not only simplify the analytical process for many of the routine bioinformatics tasks, but also to provide a highly sophisticated and automated software package that will enable researchers to organise and manage their species-specific experimental data for analysis with their research aims in mind. In addition, the package will enable researchers to compare their results with all publicly available genomic data (and in-house data if available) and to incorporate a range of external software into their analysis pipelines.
2 Material and methods
The YABI system was implemented in the Java programming language with JavaServer Pages (JSP: http://java.sun.com/products/jsp/) used for the client interface. A relational database is used to store available tools, tool parameters and job attributes. Various databases, such as PostgreSQL (http://www.postgresql.org/) or ORACLE (http://www.oracle.com/), can be used via Java Database Connectivity (JDBC: http://java.sun.com/products/jdbc/). User data and job results are stored on the server file system in a hierarchy that mimics the structure presented to the user. Simple Object Access Protocol (SOAP) (http://www.w3.org/TR/SOAP/) is used to communicate with a YABI subsystem called Grendel (http://cbbc.murdoch.edu.au) which provides the resource management for YABI and other applications within CBBC.
Transparently to client applications, Grendel schedules and distributes jobs across a heterogeneous server farm. Grendel is accessible as a SOAP web service written in Java. The job scheduling and distributed resource management within Grendel is provided by the Sun Grid Engine (SGE) (http://gridengine.sunsource.net/). The tools available to Grendel and the state of jobs are maintained in a relational database. Perl scripts make SOAP calls to update Grendel with the status of jobs within the Sun Grid Engine. At the CBBC, YABI is installed using Tomcat (http://jakarta.apache.org/tomcat/) and Apache (http://www.apache.org/) on the Linux operating system. Grendel is installed using Tomcat on the Solaris operating system. Both systems currently use PostgreSQL as a database backend.
Bioinformatics tools currently implemented in YABI are tools for similarity searching, alignment, EST clustering, and various visualisation tools. These include: BLAST, FormatDB [6], FASTA [7], ClustalW [8], and EMBOSS [9]. To demonstrate the flexibility of this systems, tools for analysing microarray data taken from the R Package: Statistics for Microarray Analysis (http://stat-www.berkeley.edu/users/terry/zarray/Software/smacode.html) were also implemented.
3 Results and discussion
YABI is a customisable, Internet-based interface to a suite of bioinformatics tools. It provides an intuitive user interface that automatically records all tasks performed (of the incorporated bioinformatics tools) and their attributes, such as parameters, versions, dates of analyses etc. Recording tasks in this way allows tasks to be resubmitted at a later date when databases are updated or compared to other analyses. In this way the system records an audit trail of any bioinformatics pipeline process created within the YABI environment. Behind the scenes resource management for YABI is provided by the Grendel subsystem – a Web service that provides a single access point to all bioinformatics tasks submitted through YABI – also developed at the CBBC. The jobs are then transparently queued and load balanced across a heterogeneous server farm. Fig. 1 shows the high-level architecture of YABI.

The high-level architecture indicating the primary components of YABI.
Fig. 2 shows a screen shot of the main client interface of YABI. The left-hand side displays the tools available to the user while the right shows the user's data stored in a tree view. The tree hierarchy displays the user's data, the bioinformatics tools and the results stored in a structured manner. A complete path in this tree would be referred as a bioinformatics pipeline. Fig. 3 shows a saved bioinformatics task and its attributes. This task can be resubmitted at any subsequent time. Fig. 4 shows a BLAST output after it has been processed through an HTML output filter. Filters can be customised to a user's specific requirements.
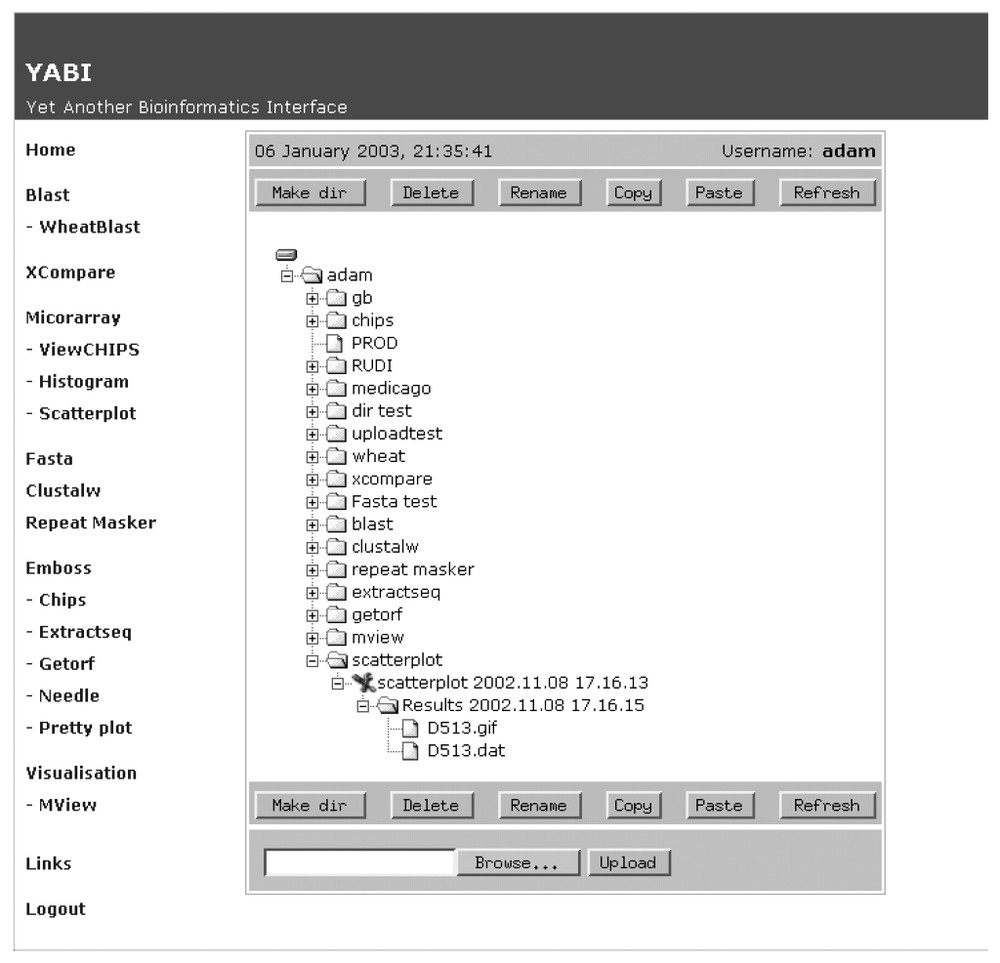
The YABI main screen showing currently available bioinformatics tools and user's data, tasks and results stored in tree hierarchy.
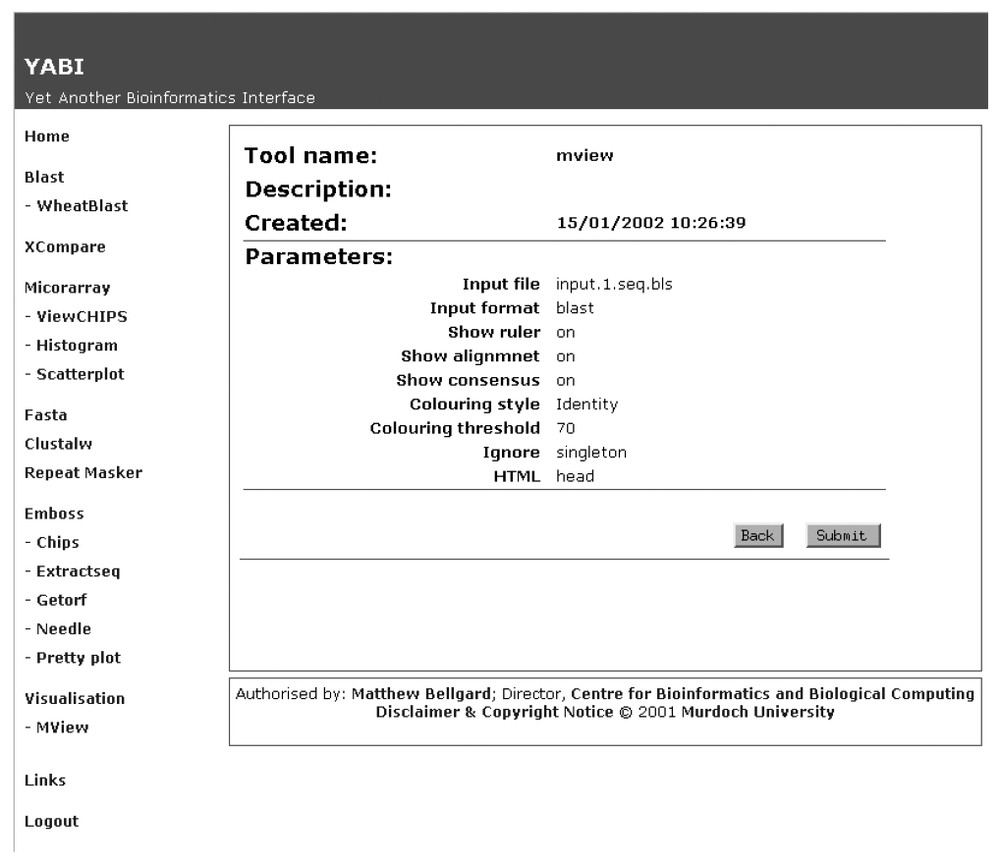
Attributes of a bioinformatics task as recorded and displayed by the YABI system.
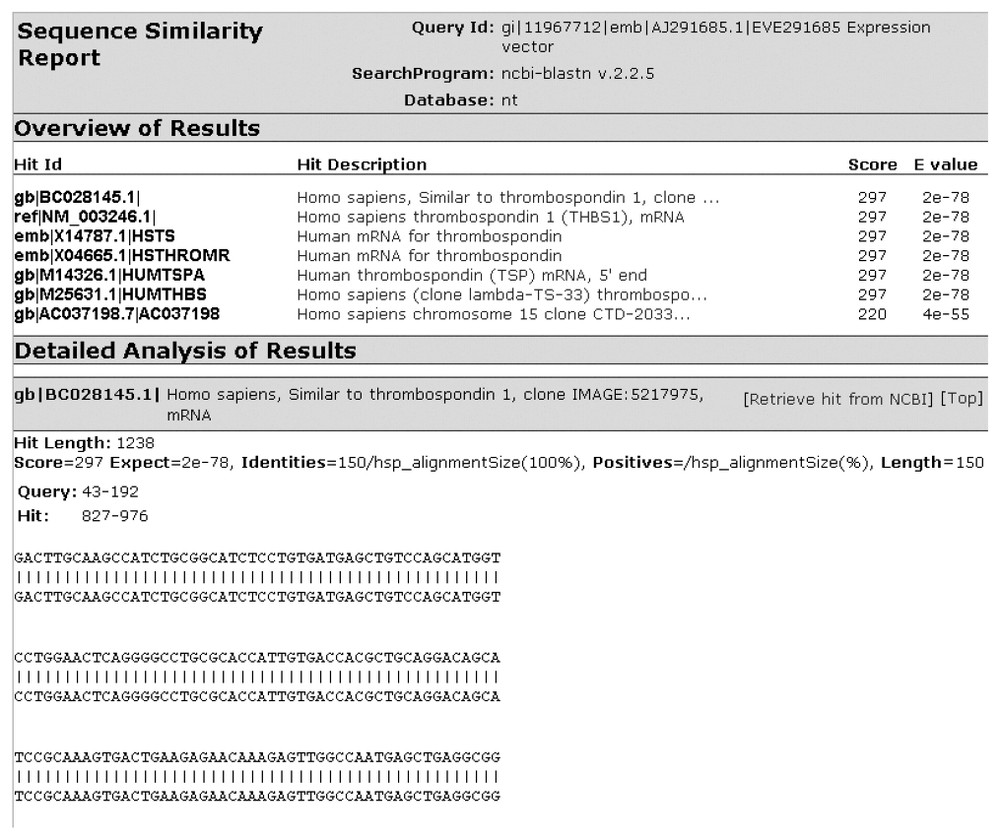
Blast output after processing by an HTML output filter.
The implemented YABI system has been designed to facilitate hypothesis-driven bioinformatics analysis. It is possible to incorporate most third party bioinformatics tools as well as ones developed in-house. While it was originally developed for manipulation and analysis of molecular data, it is flexible enough to manipulate and analyse microarray data. This means that it is possible to conduct integrated bioinformatics analyses for both genomics and functional genomics within the same environment. It has the ability to record all attributes of any given analysis and to construct a complete bioinformatics pipeline. These created pipelines can ultimately be re-used on other data, thereby standardising analyses and providing a quality audit of analyses conducted.