

1 Introduction
Functional genomics is investigating the functions of novel proteins and their coding genes in the Post-Genomic Era. Proteins encoded by novel human cDNA clones cause morphological changes and/or protein localization at the cellular level which result in various cellular forms. It has not been possible until now to classify cellular forms in order to further the study of functional genomics. Our system for image classification for genomic function analysis in cells (I-GENFACE) permits classification of microscopic images of morphological change and protein localization in order to analyze the genomic function in cells.
Visual expression cloning methods have been proposed for large-scale analysis of protein expression and function [1,2]. These studies have led to a novel cDNA cloning technology for identifying subcellular localization of proteins tagged with a fluorescent protein [3]. Moreover, a systematic classification of the subcellular localization of human proteins has been developed for visual screening using full-length cDNA as a functional pointer. A major advantage of this approach is that it does not require the physical separation of subcellular components nor assumptions about the types of interaction that reflect the relationship between proteins and structures [4].
On the other hand, approaches for distinguishing the subcellular locations of proteins have been proposed using pattern classification [5,6]. These approaches classified forms of protein localization using known protein-localization forms of microscopic images of cells stained with monoclonal antibodies against specific proteins. Boland et al. found protein-localization forms by themselves under the microscope with the focus adjusted as appropriate. These researchers correctly classified forms using their procedure based on the neural network at a rate of 83±4.6% (mean ±95% confidence interval). These researchers' latest work noted the classification of types of forms essentially correctly. If their procedure must be applied to the analysis of a considerable body of data in functional genomics, it is desirable to automatize image acquisition and form identification.
A cellular screening system has been developed which employs laser-based imaging and a wide range of techniques of image analysis in a high-throughput manner [7]. This system is designed for continuous operation, from generating cellular images to analyzing them. So that this approach can be applied to functional genomics, we are developing our I-GENFACE system to more efficiently handle transfection, incubation, the acquisition of microscopic images of cells transfected with novel human cDNA clones, and the automatic classification of these images by the visual forms of the proteins encoded by these clones. I-GENFACE is described here from the viewpoint of an algorithm for protein-localization image classification.
2 System design
2.1 Requirements
I-GENFACE is required to automatically classify the cellular forms of proteins encoded by novel human cDNA clones. However, it has been reported that approximately 20% of the analyzed proteins had a diffuse cellular distribution, and it should be noted that proteins of the secretory pathway or localizing to multiple organelles are difficult to classify [4]. I-GENFACE is therefore designed to be switchable from fully automatic to semi-automatic, depending on the experimental situation.
2.2 Overview
Fig. 1 shows the basic organization of I-GENFACE. As the image-acquisition sub-system is provided as an alternative to the semi-automatic system, it is not connected to the robot. Researchers bring specimens to the image-acquisition system from either the robot or elsewhere.
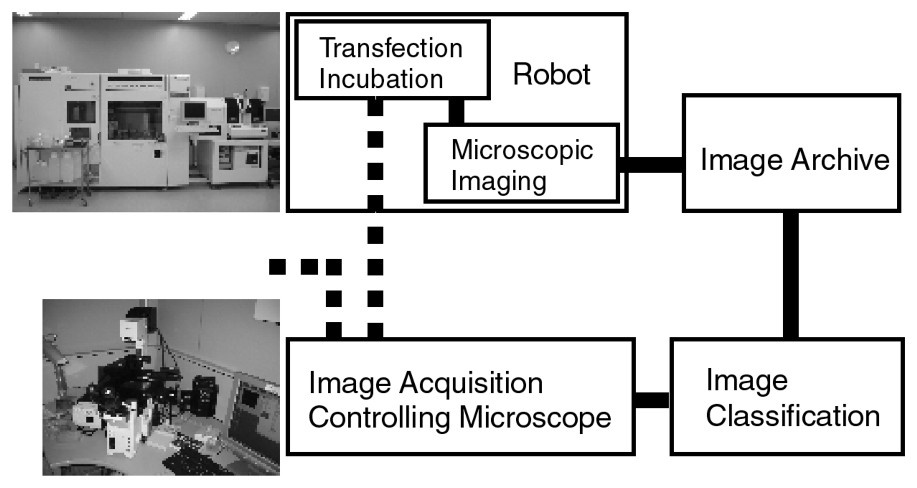
System organization of I-GENFACE. It consists of a robot which assists in transfection, incubation and microscopic imaging (HTS-50, Panasonic Factory Solutions Co., Ltd., Tokyo, Japan), an image archive PC server, an image classification PC, and an image acquisition PC system controlling the focus and stage of two fluorescent microscopes (IX 71 and IX 81, Olympus Optical Co., Ltd., Tokyo, Japan).
Cells are usually transfected with EYFP-tagged cDNAs in plates with 96 wells by the robot and incubated inside the robot for 24 hours. Our two imaging facilities enable us to acquire images in every well through CCD cameras. Fig. 2 shows an example of protein-localization images acquired under the microscope. I-GENFACE automatically classifies images into subcellular compartments. That is, first to search for protein-localization forms in the image, to automatically classify them into subcellular compartments using the features extracted from the forms, then to automatically integrate these compartments (called “classes” after classification) to classify the image. All protein-localization forms and these classes are made available in a reference table for checking the classification.

Microscopic images of protein localization at endoplasmic reticulum in HeLa cells. The size of this image is 696×520 pixels with 65 536 gray levels.
3 The algorithm used in I-GENFACE
In general, pattern classification is a procedure used to classify patterns into classes using extracted features as parameters after learning the degree of dispersion of the parameters obtained from known patterns in every class. Fig. 3 shows various protein-localization forms for standard subcellular compartments of HeLa cells. Some forms are not clear and there are a variety of shapes, sizes, and intensities even when there is localization of a protein. Classification of these very delicate forms is more accurate than ordinary computer-based classification applications such as hand-written character recognition and visual inspection in industry. In each of the input image in our classification, such as that shown in Fig. 2, there appears to be 10–30 protein-localization forms in and out of focus, and in a variety of stages of producing the protein. Our classification is composed of two steps to deal with this complexity. One is machine learning based on the subspace method [8], a form of statistical pattern classification [9]. The other is image classification by considering classes of forms in an image. As shown in Fig. 4, our algorithm consists of four processes: form search, feature extraction, form classification, and image classification.
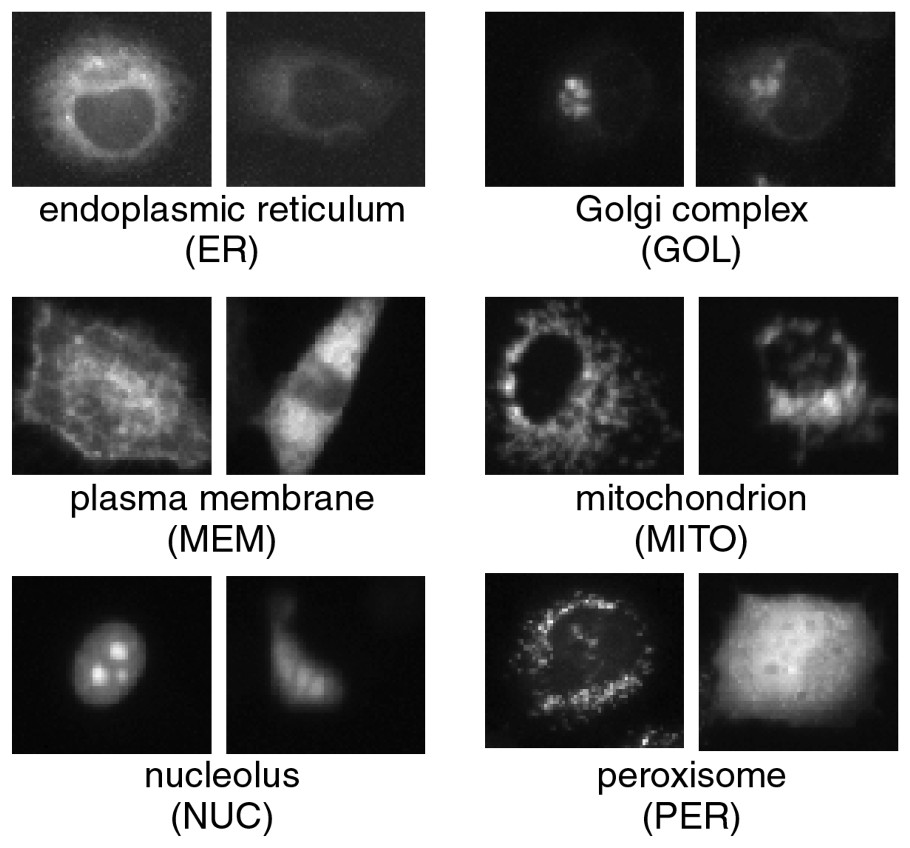
A variety of protein-localization forms corresponding to standard subcellular compartments in HeLa cells. On the left of each set of forms is a typical form and on the right an atypical form.
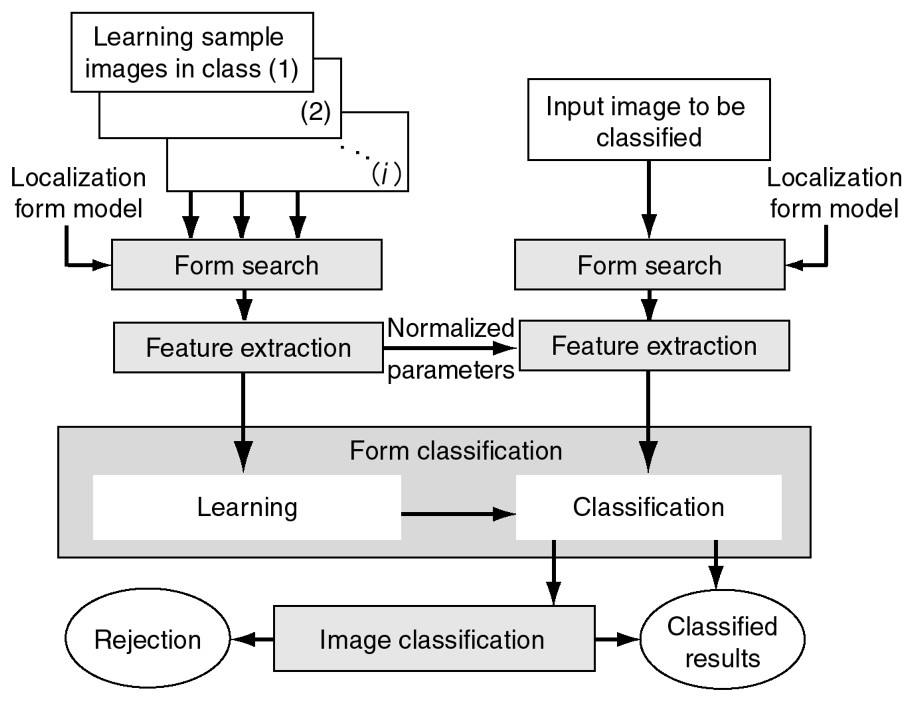
Configuration of the algorithm. It consists of four processes – form search, feature extraction, form classification, and image classification. The form search uses the localization form model designed for common localization forms. The left side shows the flow for learning, the right for classification. Form search and feature extraction are done on both sides. Features extracted in the classification flow are normalized using the same parameters used to be normalized in the learning flow. The image classification function assigns a class for the image by considering the classes of all the forms in the image.
3.1 Search using a form model
The form search identifies protein-localization forms in images using a localization-form model. This model is designed for use with common localization forms with sample images in an advanced model-design process. Fig. 5 shows the configuration of the form search accompanied by the model design. The form search requires the average distance between cells to search for forms in images. Human operators measure the average distance in sample images and crop interactively sub-images into the average-distance square for both the localization region and the background in the model-design process. The first-order component of the results of principal component analysis of the sub-images is used as the model.
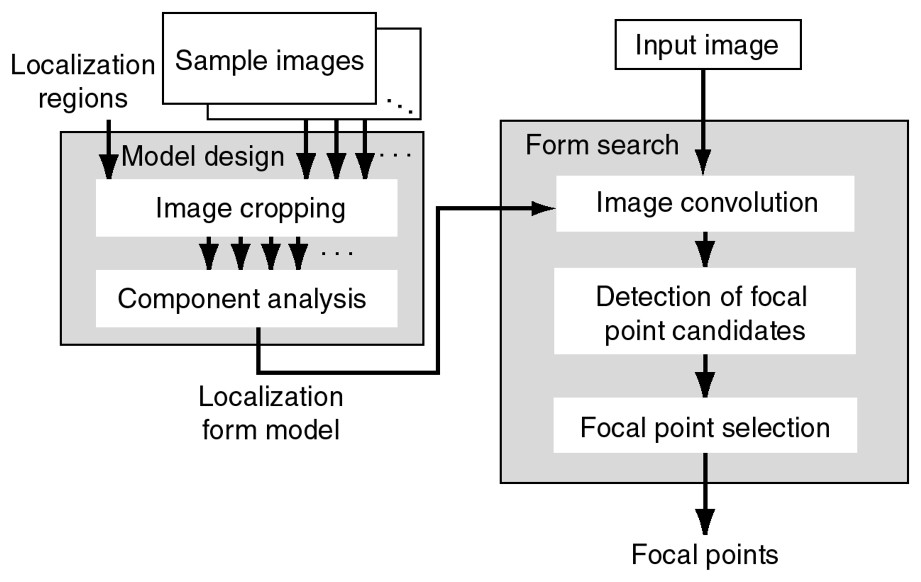
The form-search process accompanied by the model design process.
The form search consists of three processes: the convolution of the image and the model is calculated, and local maxima in the convolution image are detected as candidates for focal points. The focal points are selected from these candidates, after comparing the distances between the local maxima with the average distance. Focal points are the local maxima separated by the average distance.
3.2 Feature extraction
In I-GENFACE, our operators measure the average cell-size in advance. A form-image is defined as the average cell-size square centered at the focal point. A set of features extracted from the form-image is required as parameters in machine learning to comprehensively characterize the form for accurate classification. A set of features constructs a feature vector for the form-image. Feature extraction should minimize calculation time by reducing the number of dimensions, from the number of pixels in the form-image to that of the parameters in the feature vector. The visual appearance of protein localization suggests that the form-images are generally formed on each organelle with various pixel intensities. (See Fig. 3.) The forms are not clear enough to approximate geometric primitives such as vertices, lines, and polygons. In order to characterize the forms precisely, not only geometrical features but also statistical features are extracted as much as possible, using conventional image processing. Pratt shows that an image feature is a distinguishing primitive characteristic of the attribute of an image [10]. Some features are natural in the sense that they are defined by the visual appearance of an image, while other so-called artificial features result from the manipulation of the measurements of an image. Natural features include the brightness of a region of pixels, the edge outline of objects, and gray-scale textural regions, which might be calculated using artificial features. Features of gray-level images are generally defined as the artificial features such as amplitude features, histogram features, edge features, spot and line features, and texture features [10].
Histogram features are histogram statistics derived from gray-level values and edge elements detected by the Laplacian operator defined as
A spot is a relatively small region whose gray-level value differs significantly from its surroundings. Texture is the term used to characterize the surface of a given object in natural features and is used to describe variations in intensity in two-dimensional arrays as artificial features. Texture is often calculated using the co-occurrence matrix defined as
Features used in our algorithm
| Category | Features | Num. of features |
| gray-level value | histogram statistics of gray-level value in the whole image and the region except background | 7 |
| edge element | histogram statistics of the Laplacian image and differential image from the smoothed image | 12 |
| geometry | area, circumference, roundness, and complexity of the spots | 8 |
| texture using co-occurrence matrix | mean, power, contrast, covariance, variance, and correlation coefficient of the co-occurrence matrix | 9 |
| run-length | the bright and dark run-length and ratio between them | 3 |
3.3 Machine learning and classification
Machine learning has been performed using models based on statistics, logic, mathematics, neural structures, information theory, and other heuristic search algorithms [12]. However, our algorithm adopts the subspace method based on principal component analysis because it had a solid statistical foundation [9]. The subspace method has been applied to robust image analysis such as hand-written character recognition [13].
Each feature is normalized by centering and scaling to have mean 0 and variance 1 among sample images. The subspace method provides subspaces, which differentiate between classes, as the result of principal component analysis of the feature vectors of sample images. This allows us to construct a subspace of few dimensions based on the eigenvectors of a matrix constructed from the feature vectors. In the classification process, form search, feature extraction, and normalizing using the parameters obtained from the sample images are performed on the input images as well as the sample images. The distance between every form and every subspace is calculated. The form is classified into the subspace with the shortest among these distances. Finally, the image is classified into the subspace with the shortest distance between their forms and subspaces in total.
3.4 Reference table of protein-localization forms
For error checking, form-images and these classes are made available in a reference table. This table is produced as a worksheet using Microsoft® Excel. For an image, a form-image is pasted over into a cell on the worksheet and its class is given to the next cells in the line.
4 Feasibility study
In order to confirm our algorithm, biological experiments were performed using vectors to label subcellular compartments with fluorescent proteins. It was confirmed that subcellular compartments were labeled properly in the obtained images. Half of these images were used for learning and half for classification.
4.1 Testing the algorithm
Organelles were selected as seven subcellular compartments such as endoplasmic reticulum (ER), Golgi complex (GOL), plasma membrane (MEM), mitochondrion (MITO), nucleolus (NUC), peroxisome (PER), and cytoplasm (CYTO). Human HeLa cells were transfected with pEYFP-ER, pEYFP-Golgi, pEYFP-Mem, pEYFP-Mito, pEYFP-Nuc, and pEYFP-Peroxi (Clontech, Palo Alto, CA), which encoded a fusion protein consisting of enhanced yellow fluorescent protein (EYFP) and each compartment-targeting sequence for ER, GOL, MEM, MITO, NUC, and PER, respectively. A vector for CYTO was made to encode a fusion protein consisting of EYFP and one of the mitogen-activated protein kinase signaling cascade genes, MEK3, and transfected into human HeLa cells. After incubation, the cells were captured by the CCD camera under an IX71 fluorescent microscope at objective magnification 20× and digitized into 696×520 pixels with 65 536 gray levels. The obtained microscopic images were 1120 images with 160 images for each compartment. Half of them, 560 images with 80 images for each compartment, were sample images for learning, and half input images for classification.
Classification experiments were performed on a PC system (CPU: Intel® Pentium® 4, Clock: 1.7 GHz, RAM: 512 MB). Input images were enhanced with a minimum-maximum contrast stretch, which took the lowest and highest existing gray-level values in an image and reallocated them to the lowest and highest possible gray-level values. All of the intermediate values were then recalculated linearly based on the reallocation of the minimum and maximum values. The subspaces were defined as seven classes corresponding to ER, GOL, MEM, MITO, NUC, PER, and CYTO.
4.2 Form search
In order to design a model, our operators interactively cropped square sub-images of 96×96 pixels with the average distance between cells, which consisted of a total of 140 regions, with 20 localization regions for each class and 140 regions as background. Each sub-image with 96×96 pixels was compressed to an 1152-dimensional feature vector, dividing the sub-image into areas of 4×4 pixels and substituting the local minimum and maximum for the area. Fig. 6 shows some results of each operation in the form search.
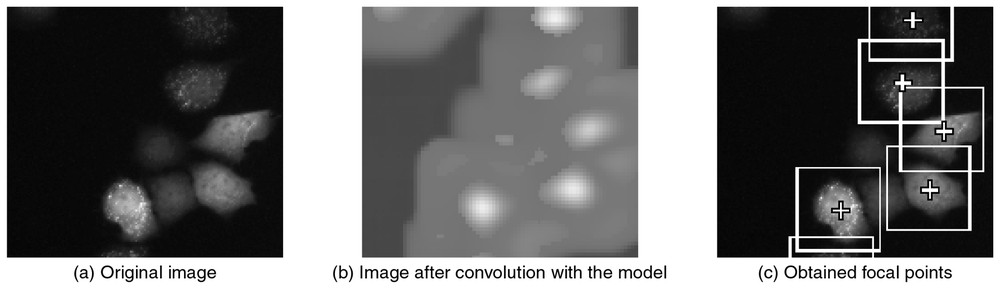
Some results on form-search process. (b) A convolution image after matching with the model that was the first-order component of the results of principal component analysis of sub-images cropped into the average-distance square. The white color represents regions with high correlation coefficency. (c) The local maximum positions were detected in the convolution image, and focal points were determined eliminating the local maximum positions which were closer than the average distance to each other.
4.3 Form classification and image classification
A form-image with the average cell-size of 90×90 pixels centered at a focal point was cropped from an image. Subsequently, the form-image was enhanced by the minimum-maximum contrast stretch. The total of 39 features shown in Table 1 was extracted from the enhanced form-image to construct a feature vector. Learning for seven compartments was performed with a total of 560 sample images and every subspace was defined by 80 sample images. The dimensions of the subspace were determined when the feature vectors of the sample images were most correctly re-classified by themselves, increasing the dimensions until 39. The resultant dimensions were 20. Our classification was tested with 80 input images for each subspace with identical dimensions. In form classification, feature vectors were scattered over each subspace. The input image was classified into a subspace with a minimum of mean square errors of the distances between all feature vectors and each subspace.
4.4 Results and discussion
Table 2 shows the results of our classification of input images. The identified ratio is greater than the classified ratio in MITO and NUC. Some forms of GOL and PER were similar to forms which should be classified into NUC and MITO after learning, respectively. The identified ratio is almost equal to the classified ratio in ER and MEM. The identified ratio is less than the classified ratio in GOL, PER, and CYTO. Therefore, classification of a part of the forms of GOL, PER, and CYTO succeeded roughly because they were similar to the forms used in learning. However, some of these forms may not have been sufficiently learned to classify them correctly. There appears to be a wide variety of forms of GOL, PER, and CYTO. The resultant correct-classification ratio satisfies our initial target ratio of 90%. In image classification without CYTO [14], the ratio was 94.2% under the same conditions except for adding sample images and input images of CYTO. Note that the forms of CYTO are hard to distinguish from forms that should be classified into classes such as MEM, NUC, and PER. Also, some forms of PER were similar to the forms that should be classified into classes of MITO and CYTO. Therefore, there appears to be a wide variety of forms that belong to a class and there is considerable similarity between classes.
Results of protein-localization image classification. The identified ratio and the classified ratio for each class were calculated in order to evaluate the accuracy of our classifications. The identified ratio is the ratio of correct classification of images of which we know the class. The classified ratio is the ratio of correct classification of all the images classified into a class. The classified ratio might be expected to more accurately reflect the ability of our system than the identified ratio. The correct-classification ratio is defined as the mean of the identified ratio and the classified ratio
| Real class | Classified class (num. of images) | Identified | ||||||
| (num. of images) | ratio (%) | |||||||
| ER | GOL | MEM | MITO | NUC | PER | CYTO | ||
| ER | 78 | 1 | 0 | 0 | 0 | 0 | 1 | 97.5 |
| GOL | 0 | 67 | 0 | 1 | 12 | 0 | 0 | 83.8 |
| MEM | 2 | 0 | 71 | 3 | 1 | 3 | 0 | 88.8 |
| MITO | 0 | 0 | 3 | 76 | 0 | 1 | 0 | 95.0 |
| NUC | 0 | 0 | 1 | 0 | 78 | 0 | 1 | 97.5 |
| PER | 0 | 1 | 1 | 9 | 0 | 65 | 4 | 81.3 |
| CYTO | 0 | 0 | 4 | 0 | 3 | 5 | 68 | 85.0 |
| Classified | ||||||||
| ratio (%) | 98.0 | 97.0 | 89.0 | 85.0 | 83.0 | 88.0 | 92.0 | 90.0 |
Fig. 7 shows a positive control example of the reference table in classification for ER, GOL, MEM, MITO, NUC, PER, and CYTO. For every protein-localization form that was found by the form search in an input image, the form-image was optimized for observation in the reference table to be enhanced by the minimum–maximum contrast stretch. A darker protein-localization form than other forms is observed more distinctly in the table than in the input image. However, the protein-localization forms in Fig. 7 are out of focus and the quality of the image should be improved for accurate image classification. Improvement of image acquisition by adjusting the focus of the microscope is underway in I-GENFACE. This improvement will permit application to proteins encoded by novel human cDNA clones, which is required to make a distinction between peroxisomes and, for example, lysosomes.
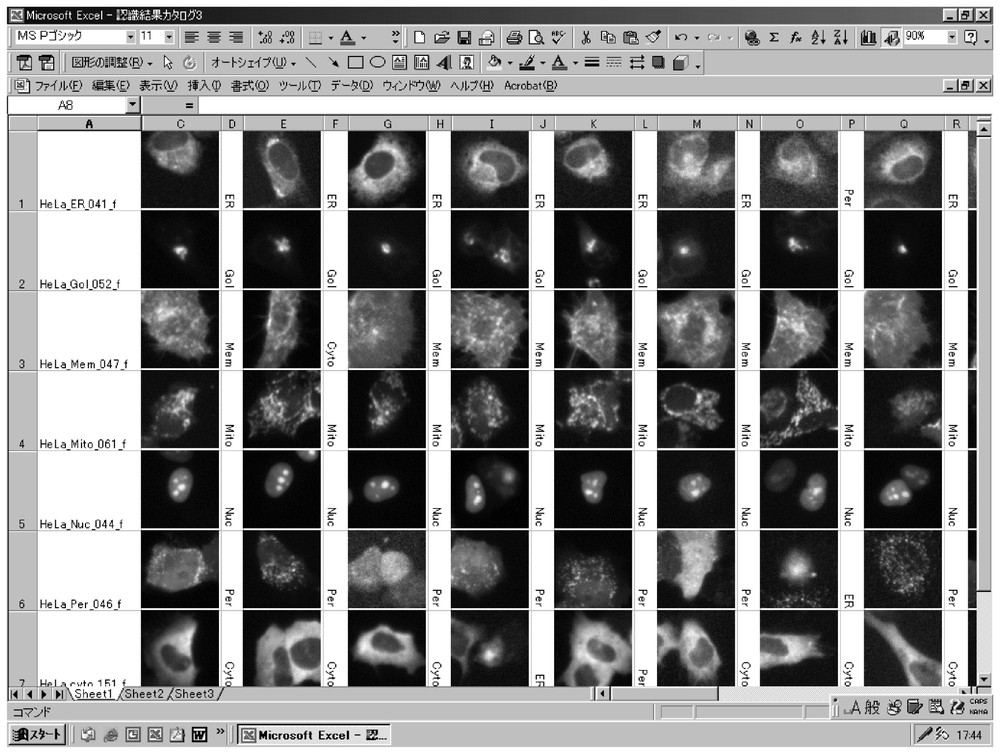
An example of reference tables of protein-localization forms.
Although the quality of the image should be improved, the effectiveness of the algorithm of image classification has been confirmed in the feasibility study. That is, the correct-classification ratio satisfies our initial target ratio of 90%. It can be said that the subspace method, a form of statistical pattern classification, is useful in the classification of images that show a diversity of protein-localization forms.
However, the highest ratio achieved was 96.1% in the image classification without CYTO, which is about 2% higher than our past work [14], an improvement made possible by improved focal-point selection in the form search. Adding sample images and input images of CYTO caused a decline in the ratio. It must be established that the total of 39 features in Table 1 is enough to represent a form accurately.
5 Conclusion
A powerful approach to investigating functional genomics is to classify in a high-throughput manner visible cellular forms of proteins encoded by novel human cDNA clones. Our short-range research goal is to develop the I-GENFACE system as a cellular screening system for this visual classification using image processing and pattern recognition. We have proposed an algorithm based on the subspace method for automated form search and the classification of protein-localization images, and have tested the algorithm with images of known localization. The resultant correct-classification ratio satisfies our target ratio of 90%. Our results suggest that the subspace method is a practical technique for analyzing images acquired under a fluorescent microscope. However, image acquisition, feature extraction, and the recognition method must be improved for application to images of unknown localization of proteins encoded by novel human cDNA clones.
We are now working on automatic transfection with novel human cDNA clones using the robot. Multiple organelles and other/unknown localizations occupied about one-third in total [15]. Our work in the future will be directed to improving our classification algorithm so as to classify these multiple organelles and other/unknown localization forms with increased accuracy. This may be achieved by developing more flexible error-checking methods. Furthermore, we have a plan to classify morphological changes using visible cellular forms by exploiting our algorithm.
Acknowledgements
We wish to thank Saila Systems, Inc., for developing image acquisition controlling microscopes. Partial support by NEDO (the New Energy and Industrial Technology Development Organization) in Japan is also greatly appreciated.