

1 Introduction
Muscle differentiation has been widely used as a model system for both embryonic development, and post-natal regeneration of tissues. Both processes require the expression of myogenic regulatory factors (MRFs), transcription factors that control the staged induction of genes important for interpretation of positional cues, proliferation, and differentiation of myogenic cells. To date, most MRFs are transcriptional factors of the basic helix-loop-helix family, with MyoD being the prototypical member, and the most extensively studied. All MRFs recognize a downstream target promoter motif, called the ‘E-box’, that share the consensus sequence of CANNTG. Most basic helix-loop-helix transcription factors function as heterodimers, and transcription regulation by MyoD has been extensively studied with regards to its binding partners (E-proteins, MEF2, Id proteins, Twist), binding sites (E-boxes), protein modulation (acetylation, phosphorylation), and upstream signaling molecules during embryonic myogenesis [1–12]. Although MyoD is important in embyonic myogenesis and postnatal muscle regeneration, there are very few known downstream gene targets of MyoD.
Experimental in vitro systems using inducible transcription factor or signaling molecule constructs in cultured cells are a mainstay of molecular biology. The emergence of expression profiling with microarrays has led to a powerful experimental design where expression profiling is done immediately after induction of the transcription factor to identify potential downstream targets across much of the genome [13–15]. The candidate targets derived from expression profiling can be compared to existing knowledge of previously characterized downstream targets (positive control), with follow up studies using gel shifts, chromatin immunoprecipitation assays, and promoter construct assays to confirm the novel downstream targets.
It is clear that in vitro experimental systems have been critical to our knowledge of transcriptional cascades, and to our knowledge of biology in general. However, the relative simplicity and tightly controlled nature of in vitro experimental systems comes with the liability of unknown relevance to the in vivo state. Particularly worrying is the fact that the majority of in vitro systems utilize over-expression constructs, leading to non-physiological levels of specific proteins in the cultured cell under study. Many transcription factors function as heterodimers, as does MyoD, and non-physiological levels of the transcription factor is likely to alter affinity and binding to specific promoters. Thus, it is expected that supra-physiological levels of MyoD would activate transcription of target genes that are not similarly regulated by MyoD in the in vivo state (e.g., promiscuous, non-physiologically-relevant binding targets). There is data in yeast, however, that suggests that overexpression may not induce as much pathway artifact as one might expect [16].
A recent study identified a large series of putative downstream targets of MyoD using embryonic fibroblast cultures transfected with an inducible MyoD expressing construct [13]. The study was very nicely designed, using cell cultures knocked-out for endogenous MyoD and Myf5 expression, and also used cycloheximide to block translation to limit the expression changes to those genes directly downstream of MyoD. Both spotted cDNA arrays (5103 elements), and Affymetrix murine mu6800 arrays (4144 probe sets) were used, and 83 genes found induced by MyoD, and 28 genes apparently repressed by MyoD (number was counted based on Ref. [13] and its supplemental material). Confirmation of induced expression by northern blot was done for a few of the 111 genes identified (M-cadherin, Rb1, Myogenin, Prdc, and Fstl). As with any such study, it becomes important to determine which of the potential downstream targets have relevance to either embryonic myogenesis, or post-natal muscle regeneration. Indeed, the authors found nearly as many genes down-regulated by MyoD as they did up-regulated genes. This is surprising given that MyoD is considered a transcriptional activator, and not a repressor, and suggests that there are likely confounding variables in in vitro experimental systems that are not currently understood, or able to be controlled.
We have previously reported an in vivo model for identification of downstream targets of MyoD by induction of staged muscle regeneration using cardiotoxin (CTX) injection [14]. We conducted a 6 time point expression profiling series, and found in vivo induction of MyoD expression at 12 hrs and 3 days after CTX injection. The 12 hr peak of MyoD expression was coordinately expressed with key repressor binding partners (Id), while the 3 day peak of MyoD expression correlated with expression of known downstream gene targets of MyoD binding and transcriptional activation (acetylcholine receptor, desmin, Myogenin). We studied coordinately expressed genes at the 3-day-time point as candidates for downstream gene targets of MyoD, found potential E box binding sites in a subset of the temporal gene cluster, and showed that both calpain 6 and Slug had E boxes in their promoters that gel shifted consistent with MyoD binding. We then went on to prove that Slug was a novel downstream target of MyoD by chromatin immunoprecipitation assays, and in vitro assays of Slug promoter constructs [14]. There were two major drawbacks to using our 6 time point series to systematically uncover large numbers of downstream targets of MyoD. First, the temporal resolution of our 6 time point series was relatively crude, and was unable to temporally distinguish induction of MyoD vs. induction of its downstream gene targets. Second, the in vivo experimental system is fundamentally ‘noisy’. Specifically, MyoD is known to carry out its function in myogenic cell lineages, however there are multitudes of other, additional cell types in regenerating muscle (vasculature and vascular remodeling, inflammatory cells, connective tissue remodeling, etc.). Thus, any temporal cluster of transcripts could derive from many different types of cells, other than the desired myoblasts.
Here, we overcame these two drawbacks using a novel experimental design. First, we increased the temporal resolution of our regeneration series to include 27 time points following CTX injection. This enabled temporal clustering with much higher resolution. To our knowledge, this is the most dense time series in any expression profiling study to date. Second, we took advantage of a recently published in vitro study, where an inducible MyoD construct was used to identify potential MyoD binding gene targets [13]. This nicely designed study included the use of MyoD/Myf5 knockout cell lines, inhibition of translation using cyclohexamide, and used both cDNA and Affymetrix arrays to identify up- and down-regulated genes. We filtered the in vitro candidate gene list against our 27 time point series in vivo temporal series to identify those genes that were likely bona fide, biologically relevant downstream targets of MyoD.
2 Materials and methods
2.1 Induction of staged muscle degeneration/regeneration
Staged skeletal muscle degeneration/regeneration was induced by injection of cardiotoxin (CTX) as previously described [14]. Two mice were injected in gastrocnemius muscles of both sides, and then sacrificed at each of the following time points: 0, 12h, 1d, 2d, 3d, 3.5d, 4d, 4.5d, 5d, 5.5d, 6d, 6.5d, 7d, 7.5d, 8d, 8.5d, 9d, 9.5d, 10d, 11d, 12d, 13d, 14d, 16d, 20d, 30d, and 40d.
At each time point, two of the four muscles showing the most extensive and consistent histological changes were used for expression profiling on individual GeneChips.
2.2 Expression profiling
Expression profiling using Affymetrix U74Av2 (12,488 probe sets) was done as previously described [14]. Quality control measures included >4-fold cRNA amplification (from total RNA/cDNA), scaling factors <2 to reach a whole-chip normalization of 800, and visual observation of hybridization patterns for chip defects (see http://microarray.cnmcresearch.org for further descriptions).
Gene lists at each time point are available on our web site (http://microarray.cnmcresearch.org, Programs in Genomic Applications). More detailed descriptions of methods for generating gene lists are also on the website (http://microarray.cnmcresearch.org, Programs in Genomic Application). All image files (.dat) and absolute analysis files (.chip) corresponding to each expression profile are also available on our database.
2.3 Data analysis
Probe set analysis and intra-chip normalization to a shared target intensity were derived from Microarray Suite version 5.0. For temporal clustering, the signal intensity values (absolute analyses) of the probe sets for all 54 profiles were loaded into GeneSpring, and each probe set was normalized to the median of its expression levels in all 54 profiles. Further hierarchical clustering analysis was limited to probe sets with at least ten present calls (18.5%) in all 54 profiles and p-value <0.05 for Kruskal–Wallis test, corrected with Benjamini and Hochberg False Discovery Rate. This was to eliminate the signal values of probe sets with 80% of ‘absent calls’, inclusion of which leads to considerable artefactual noise in temporal clustering, with random fluctuations at or below background hybridization levels showing ‘statistically significant’ clustering with user- or candidate gene-defined patterns. A hierarchical clustering algorithm using Pearson correlation was used to temporally group those probe sets based on their expression pattern across the 27 time points.
Clustering analysis of the expression of MyoD downstream targets used Hierarchical Clustering Explorer (HCE) and VISual Statistical Data Analyzer (VISDA) [17,18]. HCE input dataset was in vitro MyoD downstream target genes identified by Bergstrom et al. [13] that were also present on Affymetrix U74Av2 Genechips. Each probe set was normalized to the median of its expression levels in all 54 profiles. Probe sets used for VISDA analysis were filtered by requiring more than 2 present calls in any of the 54 profiles. The expression levels of each probe set across all time points were normalized to zero mean and one standard deviation to eliminate scale effect in clustering. Replicates were averaged for both HCE and VISDA analysis.
3 Results
3.1 Expression profiling of muscle degeneration/regeneration
Gastrocnemii of 54 mice were injected with CTX using a custom 10-needle manifold covering 1 cm2 [14], with four separate gastrocnemii harvested at each of 27 time points from two CTX-injected mice (54 mice, 108 gastrocnemii). Two histologically-matched muscles from each time point were expression profiled (Affymetrix U74Av2). We have previously shown that the use of inbred mice eliminates most inter-individual variability in expression profiles [14]. Thus, the replicates used for expression profiling were sometimes from the same mouse, and sometimes from different mice, but we have shown that this does not introduce a confounding variable in the temporal profiles [14].
We filtered data for probe sets performing well and with significantly sufficient hybridization patterns using filters. We required >18.5% ‘present calls’ for each gene (see Ref. [14]) (e.g. ⩾10 present calls in 54 U74Av2 profiles) and a statistically significant difference between any two time points (p value <0.05 using Kruskal–Wallis test, adjusted with Benjamini and Hochberg False Discovery Rate). About 37.5% of genes on the U74Av2 microarray survived the present call filter (4687 of 12488). Note that this filtering method reduces the sensitivity of the analysis for genes expressed at very low levels, but also increases the specificity of the analysis such that poorly performing probe sets with poor signal-to-noise ratios (SNRs) are not included in further analysis. Signal intensity probe set values for all 54 profiles for the 4687 genes surviving the present call filter were then subjected to temporal clustering using GeneSpring software package.
3.2 Temporal clustering of a 27-time-point muscle regeneration series
We first used unsupervised hierarchical clustering to determine if the time series variable was the major variable in the 4687 genes 54 profiles, as opposed to technical variables and sources of noise (inter-animal, inter-muscle, etc.) (Appendix A). This analysis showed good grouping of adjacent time points, indicating that the time variable was the major variable in the study. There was some mixing of profiles in the later time points of regeneration, however this was to be expected due to the fact that most regeneration is known to be complete by 2 wks post-CTX injection, and we therefore expected relatively little difference between the later profiles.
We then used supervised hierarchical clustering based on the time series to define temporal clusters (coordinately regulated groups) of transcripts (Appendix B). This data agreed with our previous 6 time point report [14], but showed a larger number of temporal clusters due to the greater temporal resolution. General groups of genes involved in inflammation, myogenesis, and myofiber maturation (contractile proteins) are shown (Appendix B). There were also novel clusters induced very late in regeneration that were correlated with either slow twitch myofiber maturation, and likely tendon remodeling.
All further analysis of this data set was focused on the early time points coinciding with the two peaks of endogenous MyoD induction at 12 hrs and 3 days (Fig. 1A).
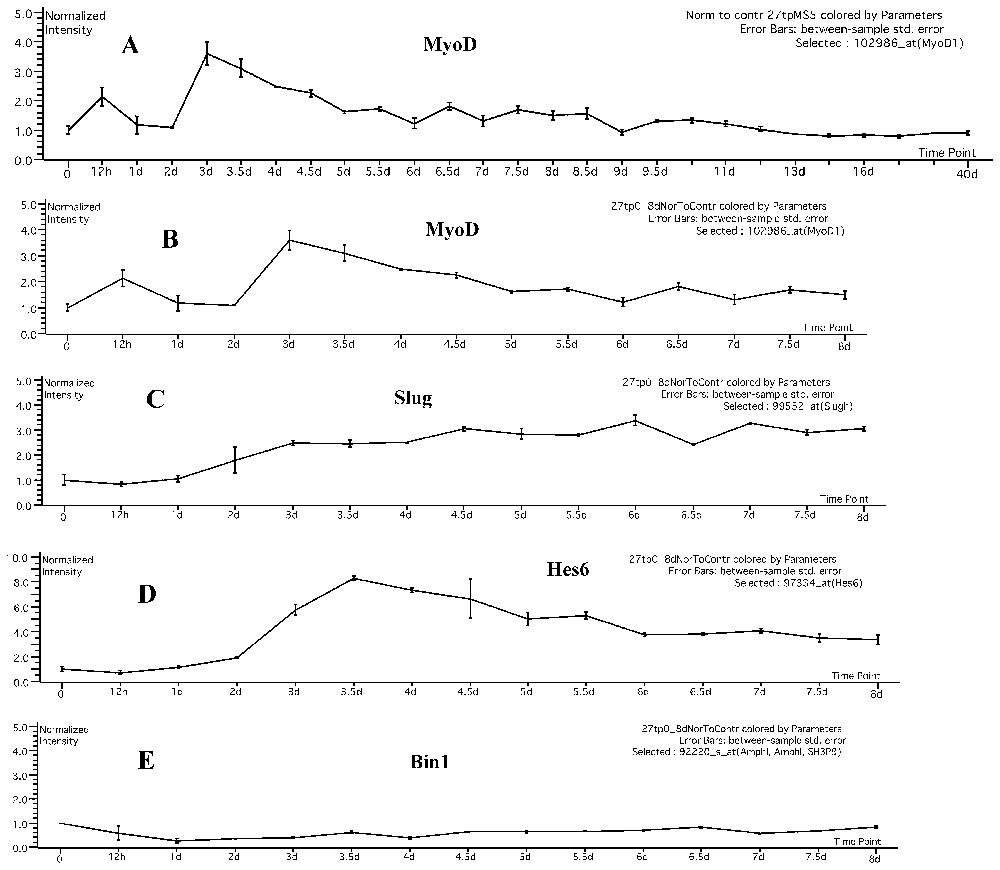
Temporal profile of MyoD, and known and potential downstream target genes. A. Shown is the temporal profile of MyoD over the entire 27 time point series. MyoD shows biphasic induction only at very early time points following induction of regeneration by CTX. Error bars are derived from independent replicates at each time point. B. Shown is an expansion of the 0–8 day time point data, showing more clearly the expression pattern of MyoD with error bars. C. Shown is a well-characterized downstream target of MyoD, Slug, as we have previously described [14]. The temporal pattern of Slug expression is consistent with being downstream of MyoD after the second phase (3 day) of MyoD expression. D. Shown is an example of one of the potential novel downstream targets of MyoD (Hes6) determined by an in vitro experimental system [13]. This potential candidate shows a pattern consistent with activation by MyoD at the second phase of induction (3 day time point). E. Shown is an example of a potential novel downstream target of MyoD (Bin1) identified by in vitro profiling [13] that does not fit with our in vivo temporal data. This gene was induced by MyoD in vitro, yet shows a pattern that is not consistent with activation by MyoD in vivo. This could be due to an embryonic-specific induction, or due to non-relevance to the in vivo state.
3.3 In vivo expression of in vitro MyoD downstream targets
Bergstrom et al. [13] studied direct downstream targets of MyoD in vitro by inducing exogenous MyoD expression while blocking new protein synthesis in MyoD-/-/Myf5-/- mouse embryo fibroblasts. By using cDNA arrays and Affymetrix Genechips, Bergstrom et al. identified 83 genes up-regulated by MyoD and 28 genes down-regulated by MyoD; each of these 111 was deemed a candidate for direct downstream targets of MyoD binding to each promoter.
We sought to define the subset of the 111 potential in vitro targets of MyoD that were biologically relevant for muscle regeneration. This was done by filtering the 111 putative targets against the 27-time-point in vivo muscle regeneration expression profile series. Three different approaches were used: (1) hierarchical clustering using correlation coefficients; (2) hierarchical clustering using the interactive HCE program to visualize temporal groupings of the 111 genes [17]; and (3). Bayes soft clustering using the VISDA program [18]. The latter is a statistically-principled approach of the entire 27-time-point data series, with subsequent fitting of the 111 genes into statistically-defined gene clusters.
Of the 83 up-regulated and 28 down-regulated genes, 73/83 and 25/28 were represented by probe sets on the U74Av2 chip, respectively. We then used hierarchical clustering algorithm (Pearson correlation) to cluster increased and decreased genes, respectively (Appendices C, D). We tested the up-regulated in vitro data set against the 27 time point series, and ran both the spotted cDNA and Affymetrix data of Bergstrom et al. separately (Appendix C). The data is seen to resolve into temporal clusters, two of which map well with the induction of MyoD during muscle regeneration (Fig. 1).
Specifically, both the spotted cDNA candidates, and the Affymetrix candidates show a temporal cluster of approximately 25% of genes at the 12 hr time point (corresponding to the 12 hr peak of MyoD expression in vivo), and another 25% map to a second temporal cluster at 3 days (corresponding to the 3 day peak of MyoD expression in vivo). The remaining 50% of genes show expression patterns that do not correlate with expression of MyoD during muscle regeneration in vivo. This analysis suggests that about 50% of the genes identified as potential downstream targets of MyoD in vitro are biologically relevant for muscle regeneration in vivo. In Fig. 1, we show expansion of the time point graph to the 0–8 day time frame for MyoD (Fig. 1B), and for examples of mRNAs showing biological relevance in regeneration (Slug, Fig. 1C; Hes6 Fig. 1D), and one mRNA not showing relevance (Bin1, Fig. 1E).
We conducted a similar analysis of genes that were found to be down-regulated in the Bergstrom et al. data set. Temporal clustering showed that very few of the down-regulated in vitro-defined MyoD targets corresponded to the temporal expression pattern of MyoD in vivo (Appendix D). There was no visually apparent down-regulated gene clusters at either the 12 hr or 3 day time point (Appendix D). This suggests that few, if any, of the genes down-regulated by MyoD in vitro are biologically relevant to muscle regeneration in vivo. This is perhaps expected, as MyoD has been shown to act as a transcriptional activator, and not a repressor. Thus, down-regulated genes may be an artifact of the in vitro assay system.
3.4 Increasing the confidence of temporal clustering: application of HCE to cluster discovery
There are many complementary methods emerging for cluster discovery in microarray data. One method to increase the resolution and sensitivity of temporal cluster discovery is through visual interaction with the program. In this manner, we can ‘supervise’ the clustering based on our expectation of clusters conforming to the two peaks of MyoD expression (12 h, 3 days; Fig. 1). The Hierarchical Clustering Explorer program (HCE) permits rapid user manipulation of data analysis, so that different computational algorithms and stringencies of analysis can be employed in an interactive manner, optimizing the sought-after clusters using human visualization [17].
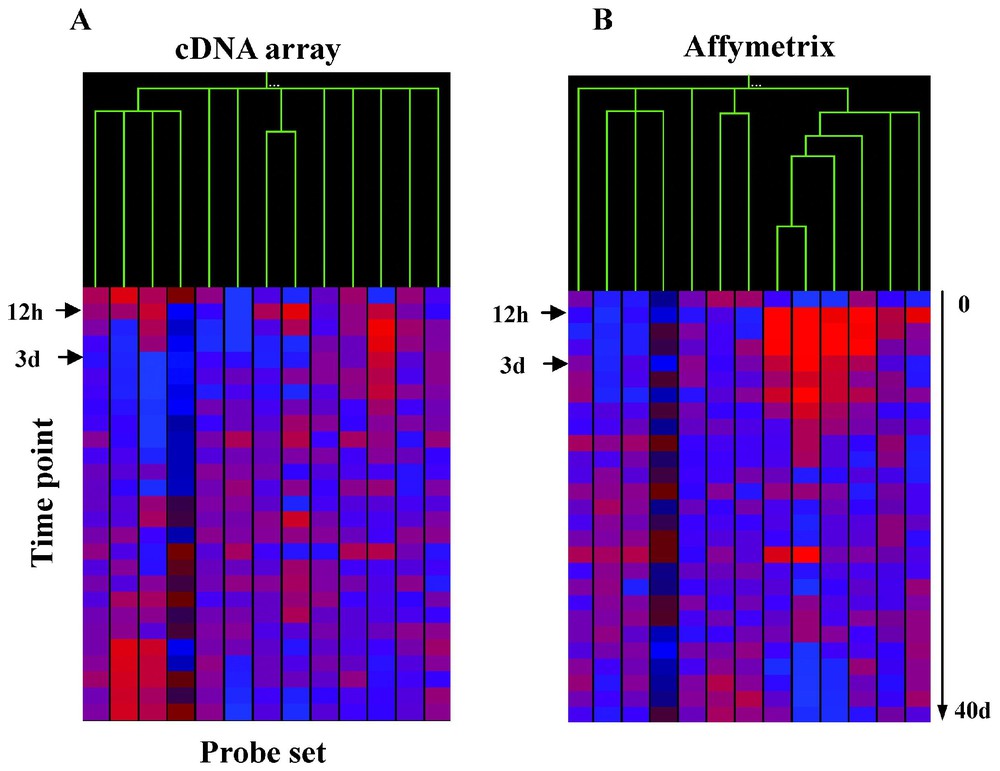
We applied HCE to the up-regulated and down-regulated in vitro targets, and searched for the most visually satisfying 12 h and 3 day clusters (Fig. 2A, Table 1, Appendix E). Complete linkage and average linkage methods were used to cluster up- and down- regulated genes respectively to achieve a better visualization of clusters. HCE was unable to identify visually satisfying clustering of the down-regulated cluster, as was the case with the GeneSpring analyses (Fig. 2B; Appendix F). However, HCE-filtered data showed the same 12-h and 3-day temporal clusters, with considerable membership in the clusters shared with the default GeneSpring analyses (Table 1, Appendix E).
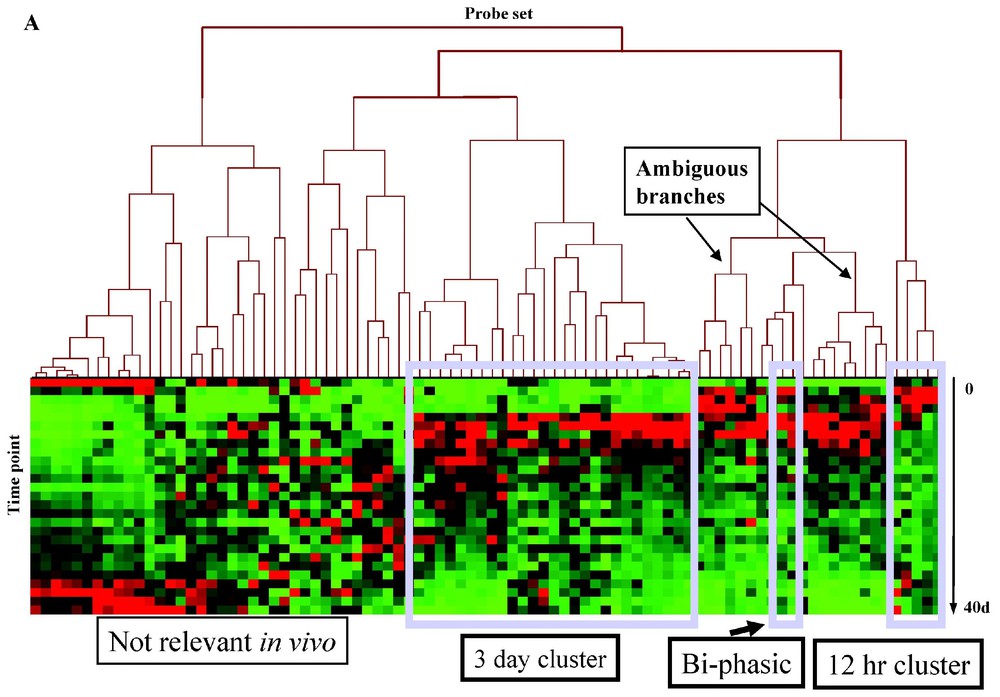

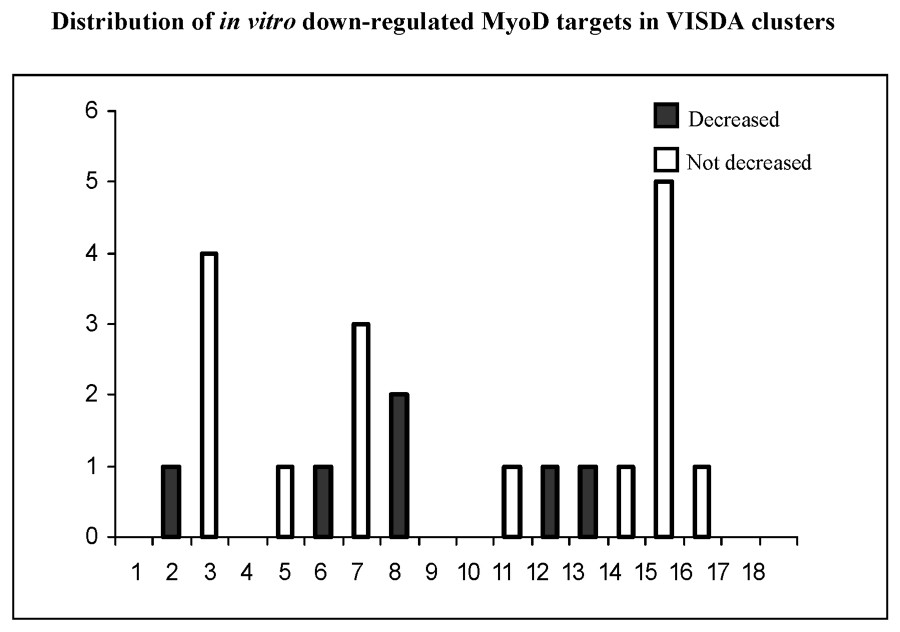
MyoD downstream targets in vitro have different expression patterns in muscle regeneration as shown by HCE. Shown is the hierarchical clustering of the mean of two replicates each for 27 time points, showing downstream targets of MyoD in vitro, based on their expression in muscle regeneration in vivo. For up-regulated genes in vitro (panel A, hierarchical clustering using the complete linkage), three major expression patterns were identified: up-regulation with a peak between 12 h and day 3, up-regulation with a peak at day 3, and no up-regulation. The first two patterns correspond to 12 h peak and day 3 peak of MyoD expression respectively. Ambiguous branches do not show a clear 12 h or 3d upregulation pattern. For down-regulated genes in vitro (panel B, hierarchical clustering using the average linkage), expression of eleven genes was found increased, six genes were found down-regulated, five genes were not differentially regulated.
Expression of in vitro upregulated MyoD targets in muscle regeneration and in HCE and VISDA cluster
| GenBank1 | UniGene | Symbol | Gene name | FC2 | TP3 | HCE4 | VISDA5 |
| cluster | cluster | ||||||
| Genes showing 3 day peak6 | |||||||
| AJ245402 | – | cdh15 | Cadherin 15 gene | +3.7 | 3d | 3d | 1 |
| X13945 | – | Lmyc-1 | L-myc gene | +5.4 | 3d | 3d | 1 |
| AW048812 | Mm.29549 | Hes6 | Hairy and enhancer of split 6 | +8.3 | 3.5d | 3d | 1 |
| X15784 | Mm.16528 | Myog | Myogenin | +14.4 | 3.5d | 3d | 1 |
| M17640 | Mm.4583 | Chrna1 | cholinergic receptor, nicotinic, alpha polypeptide 1 | +9.6 | 3.5d | 3d | 1 |
| AV248455 | Mm.2810 | Chrng | cholinergic receptor, nicotinic, gamma polypeptide | +45 | 3.5d | 3d | 1 |
| L23423 | Mm.179747 | Itga7 | integrin alpha 7 | +2.1 | 3.5d | 3d | 1 |
| U43900 | Mm.3965 | Stam | signal transducing adaptor molecule 1 | +2.8 | 3.5d | 3d | 1 |
| L47600 | Mm.632 | Tnnt2 | troponin T2, cardiac | +30 | 3.5d | 3d | 1 |
| M18779 | Mm.1526 | Myod1 | myogenic differentiation 1 | +3.6 | 3d | Bi-ph | 1 |
| M27266 | Mm.4848 | Fyn | Fyn proto-oncogene | +3 | 3.5d | Bi-ph | 2 |
| X15788 | Mm.1272 | Rapsn | receptor-associated protein of the synapse, 43 kDa | +1.3 | 3.5d | Other | 1 |
| AW061260 | Mm.23742 | Nes | Nestin | +5 | 3.5d | Other | 1 |
| U23921 | Mm.4150 | Osp94 | osmotic stress protein 94 kDa | +2.7 | 3.5d | Other | 1 |
| U51014 | Mm.69751 | Pep4 | peptidase 4 | +1.7 | 3d | 3d | 10 |
| U94423 | Mm.87279 | Mef2a | myocyte enhancer factor 2A | +2.1 | 3.5d | 3d | 10 |
| AI842874 | Mm.182692 | Sh3glb1 | SH3-domain GRB2-like B1 (endophilin) | +1.6 | 3.5d | 3d | 10 |
| M26391 | Mm.304 | Rb1 | retinoblastoma 1 | +1.8 | 3.5d | 3d | 10 |
| Genes showing 12h-2d peak | |||||||
| M18779 | Mm.1526 | Myod1 | myogenic differentiation 1 | +2.1 | 12h | Bi-ph | 1 |
| X54098 | Mm.7362 | Lmnb2 | lamin B2 | +2 | 12h | 12h/amb | 1 |
| U54803 | – | Lice | cysteine protease | +2.4 | 1d | 12h/amb | 1 |
| M27266 | Mm.4848 | Fyn | Fyn proto-oncogene | +2 | 12h | Bi-ph | 2 |
| M86183 | Mm.7417 | Ccnd3 | cyclin D3 | +2 | 1d | Other | 2 |
| D14883 | Mm.4261 | KAI1 | Kangai 1 | +2.5 | 12h | 12h/amb | 4 |
| AF096875 | Mm.21389 | Dio2 | deiodinase, iodothyronine, type II | +4.7 | 12h | 12h/amb | 5 |
| M15832 | Mm.738 | Col4a1 | procollagen, type IV, alpha 1 | +2.3 | 12h | Other | 9 |
| AB012611 | Mm.45048 | Stam2 | signal transducing adaptor molecule 2 | +2.4 | 12h | 12h/amb | 10 |
| M31690 | Mm.3217 | Ass1 | arginosuccinate synthetase 1 | +2 | 2d | 12h/amb | 14 |
| X98475 | – | VASP | vasodilator-stimulated phosphoprotein | +2.8 | 12h | Other | 15 |
| X14432 | Mm.24096 | Thbd | thrombomodulin | +12 | 12h | 12h/amb | 15 |
| AF077861 | – | Idb2 | inhibitor of DNA binding 2 | +6.4 | 12h | 12h/amb | 15 |
| X61940 | Mm.2404 | Dusp1 | Dual specificity phosphatase 1 | +2.2 | 12h | 12h/amb | 16 |
| Z19521 | Mm.3213 | Ldlr | low density lipoprotein receptor | +2.4 | 12h | 12h/amb | 16 |
| AJ250723 | Mm.38450 | Sept9 | Septin 9 | +2.6 | 12h | 12h/amb | 18 |
| X61172 | Mm.2433 | Man2a1 | Mannosidase 2, alpha 1 | +3 | 12h | 12h/amb | 18 |
| U03434 | Mm.14926 | Atp7a | ATPase, Cu++ transporting, alpha polypeptide | +2.7 | 2d | 12h/amb | 18 |
| D26532 | Mm.4081 | Runx1 | Runt related transcription factor 1 | +13.3 | 12h | 12h/amb | 18 |
| AA791012 | Mm.29766 | Gmfg | Glia maturation factor, gamma | +6.4 | 12h | 12h/amb | 18 |
| AW215736 | Mm.181860 | 2310057H16Rik | Ricken cDNA 2310057H16 gene | +7.3 | 12h | 12h/amb | 18 |
1 GeneBank accession number used by Affymetrix probe sets.
2 FC-fold change.
3 TP-time point.
4 HCE cluster is determined by visualization of HCE output (Fig. 6A). 3d – 3-day cluster; 12h – 12-h cluster; amb – ambiguous branches; Bi-ph – Bi-phasic.
5 VISDA clusters are as indicated in Fig. 7.
6 Genes are grouped by visual examination of the expression pattern in GeneSpring.
Taking both the GeneSpring and HCE output together, three major gene expression patterns were identified in muscle regeneration: up-regulation between 12 h and 3 day post-injection (20/73 genes, corresponding the 12 h peak of MyoD), up-regulation around 3 day post injection (17/73 genes, corresponding to the 3 day peak of MyoD), and no up-regulation (36/73 genes). Thus, a total 37 (50.7%) genes showed increased in vivo expression corresponding to upregulation of MyoD expression in vitro.
Of the 25 MyoD direct down-regulated targets in Bergstrom's study, only six of them showed decreased expression in the muscle regeneration temporal series. Five of the genes did not show differential expression. In contrast, eleven of the genes showed up-regulation at various time points (Appendix F). Three of the genes were called ‘absent’ in all profiles, and thus not informative.
3.5 Clustering analysis of in vitro MyoD downstream targets using VISDA
A major disadvantage of the hierarchical clustering methods described above is that there is little statistical support for the data output. Thus, identification of clusters by supervised temporal hierarchical clustering can be considered a relatively non-robust method of data analysis. We therefore applied an alternative, more robust statistical analysis of the data using a recently described program, VISDA [18]. VISDA interrogates large data sets by first reducing the dimensionality of the temporal series by discriminatory data project and subsequent cluster decomposition by soft data clustering. This method of fitting a statistical model to the data set allows the selection of the number of clusters and definition of clusters statistically (cluster discovery). The data is then partitioned into the supported number of clusters, and further partitioned if desired.
Application of VISDA to the 54 profiles (probe sets were filtered by requiring more than 2 present calls in any of the profiles) suggested support for a minimum of 18 temporal clusters (Fig. 3), with membership in each cluster ranging from 167 to 664 genes. VISDA detected the 3 day temporal cluster, and at 18 clusters split this into two clusters (clusters 1 and 10; Fig. 3). Mapping of the Bergstrom et al. upregulated genes to the 18 VISDA clusters showed many to map to clusters 1 and 10, and these same genes showed visual segregation to the 3 day time point peak of MyoD by hierarchical clustering (Table 1, Appendix G). The concordance of the GeneSpring, HCE, and VISDA analysis for 18 potential downstream targets at the 3 day peak of MyoD expression (VISDA clusters 1 and 10) provides strong support for these 18 genes representing biologically relevant downstream targets of MyoD involved in myoblast differentiation during muscle regeneration. These 18 genes were Cadherin 15 (cdh15), L-myc, Hairy and enhancer of split 6 (Hes6), Myogenin, cholinergic receptor α1 (Chrna1), cholinergic receptor gamma (Chrng), integrin α7 (Itga7), signal transducing adaptor molecule 1 (Stam), cardiac troponin T2 (Tnnt2), MyoD, Fyn, receptor-associated protein of the synapse (Rapsn), Nestin, osmotic stress protein 94 kDa (Osp94), peptidase 4 (Pep4), myocyte enhancer factor 2A (Mef2a), SH3-domain GRB2-like B1 (Sh3glb1), and retinoblastoma 1(Rb1). Only myogenin, MyoD, Chrna1, Chrng, and Itga 8 have been previously characterized.
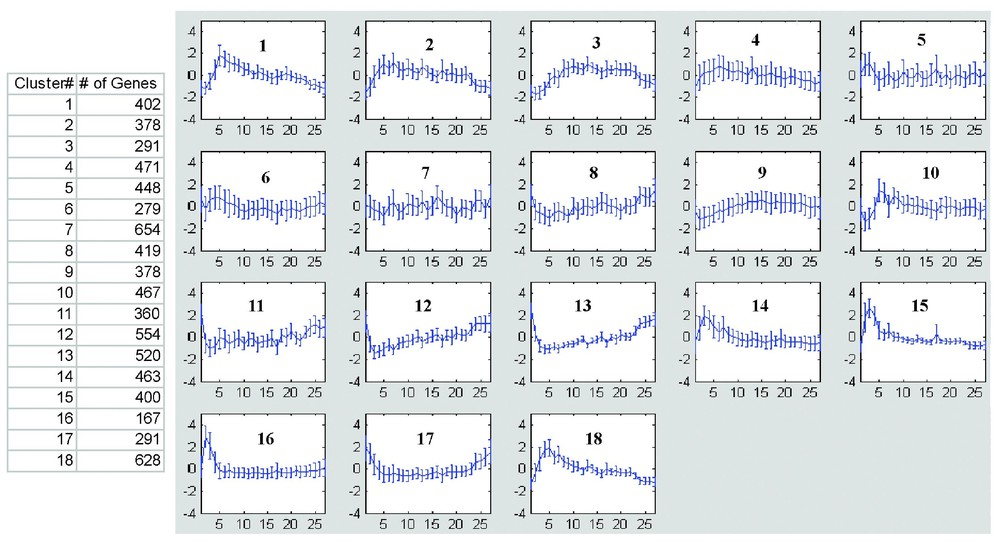
Clustering analysis using VISDA. Shown is the 18 temporal clusters derived from VISDA analysis. Number of genes in each cluster was listed in the table.
The down-regulated genes did not show good mapping to any specific VISDA cluster (Appendix F). Thus, VISDA was unable to provide any independent support for a down-regulated MyoD cluster corresponding to the peaks of MyoD expression. This data is consistent with the GeneSpring, and HCE data presented above, and also current knowledge of MyoD as a transcriptional activator, rather than a repressor.
4 Discussion
In vitro systems (e.g., cell culture) avoid many of the problems intrinsic to in vivo experimental systems. For example, cell culture systems used to dissect myogenic pathways typically employ pure cell populations, with synchronized response to the transcription factor under study (e.g., [13]). While the in vitro experimental systems can be elegantly controlled, there are many issues which question relevance to the in vivo embryonic development or muscle regeneration. For example, during embryogenesis, cells in the dermatomyotome become committed to the muscle lineage via positional cues provided by Wnt and Shh expression in neighboring cells. These positional cues are clearly lacking from the in vitro system. Likely, in muscle regeneration, myoblasts only proliferate and differentiate in the context of a pre-existing myofiber basal lamina. Indeed, the presence of a defective myofiber basal lamina precludes muscle regeneration, as evidenced by the failure of regeneration in both mice and humans lacking the basal lamina merosin protein (laminin alpha2) [19,20]. Thus, downstream targets of MyoD defined in vitro, may, or may not, have any relevance to muscle development or regeneration in vivo.
In this report, we combine the advantages of the in vitro experimental system, with an in vivo filter for biological relevance. Specifically, we used the excellent in vitro data set of potential MyoD downstream targets recently published [13], and filtered this against a 27-time-point muscle regeneration series described here. The identification of the subset of in vitro downstream targets of MyoD that were biologically relevant for muscle regeneration was done by a series of data visualization and statistical methods, including hierarchical clustering (both supervised and unsupervised), HCE, and VISDA Bayes soft clustering. Through these analyses, we provide support for approximately half of the candidates for transcriptional activation by MyoD reported by Bergstrom et al. (Fig. 2, Table 1, Appendices C–E). We provide the strongest support for 18 downstream candidates, that we show by all methods to map to the second peak of MyoD expression at 3 days after CTX injection. These 18 genes are: cdh15, L-myc, Hes, Myogenin, Chrna1, Chrng, Itga7, Stam, cardiac troponin T2, MyoD, Fyn, Rapsn, Nestin, Osp94, Pep4, Mef2a, Sh3glb1, and Rb1. Of these 18, Cdh15, L-myc, Hes6, Stam, Tnnt2, Fyn, Rapsn, Nestin, Osp94, Pep4, Mef2a, Sh3glb1 and Rb1 are ‘novel’ downstream targets of MyoD that have not been previously characterized outside of the expression profiling papers discussed here [13,14], this paper. It is out side the scope of this current manuscript to describe the potential functional roles of each of these novel downstream MyoD targets in muscle regeneration. This will also require further functional and molecular studies.
Importantly, we were unable to provide support for any of the potential down-regulated MyoD targets described by Bergstrom et al. [13]. MyoD is well characterized as a transcriptional activator, where binding to E box sequences in target promoters leads to transcriptional induction of the downstream target gene. Thus, it was unexpected that a series of down-regulated transcripts were identified after in vitro induction of MyoD expression [13]. As translation was blocked by cycloheximide, these down-regulated transcripts suggested that MyoD might also act as a transcriptional repressor, perhaps by binding of specific partner proteins in a heterodimer [13]. If the down-regulated transcripts were biologically relevant, then we would have seen these transcripts temporally cluster into groups that were down-regulated at one of the two peaks of MyoD expression in vivo (12 h, or 3 days). None of our methods (hierarchical clustering, HCE, VISDA) identified any such cluster.
This data suggests that the negatively regulated candidate genes defined by in vitro studies are likely experimental artifacts, and that MyoD does indeed function solely as a transcriptional activator. Alternatively, the downstream targets could be so selective that they do not cluster effectively. Also, downregulated genes at the 12-h time point correspond to most myofibrillar proteins, as myofibers are being actively destroyed by macrophages at this time point. Thus, these few potential down-regulated targets may be poorly resolved by our in vivo data.
In conclusion, we have presented a novel experimental approach that combines the advantages of both the in vivo and in vitro experimental systems of studying muscle transcriptional cascades and regeneration. We propose that a similar combined data filtering approach can be applied to any tissue or cell type where similar stimuli can be provided both in vitro and in vivo.
Acknowledgements
Supported by grants from NIH (3RO1 NS29525-09; UO1 HL66614-01; NO1-NS-1-2339) and the Muscular Dystrophy Association USA.
Appendix A
Shown in Fig. 4 is unsupervised hierarchical clustering of 54 profiles (GeneSpring). Expression profiles are clustered based on similarity. Four clusters can be distinguished, each of which correlates with different general stages of muscle regeneration. Cluster 1 corresponds to the stage of normal muscle and nearly completely regenerated muscle. Cluster 2 corresponds to the early stage with inflammation as the major event. Cluster 3 corresponds to the early muscle regenerating stage. Cluster 4 corresponds to the late muscle regenerating stage. While most profiles are clustered with appropriate periods of time, some discordance is seen between 5.5 d and 14 d. This may be due to non-synchronized satellite cell activation and differentiation, or more closely related profiles over this time period.

Unsupervised hierarchical clustering shows that the time series is the dominant variable relative to technical variables in the 27-time-point expression series.
Appendix B
Shown in Fig. 5 is the dendrogram derived from the temporal hierarchical clustering algorithm (GeneSpring). Each row represents a time point of the time series averaged over two replicates at each time point (54 U74A profiles). Each vertical colored bar (lower part of figure) represents a single probe set (gene) in the profile (4687 total). Vertical bars in red color indicate over-expression relative to the reference value, which is the median of the expression levels of the corresponding gene in all 54 profiles. Blue color represents under-expression relative to the median. The intensity of the color represents the confidence of the data, which generally correlates with the fold changes relative to the reference value. This algorithm clusters genes with similar expression patterns based on correlation coefficients. The distance between two genes on the dendrogram reflects the temporal expression profile similarity.
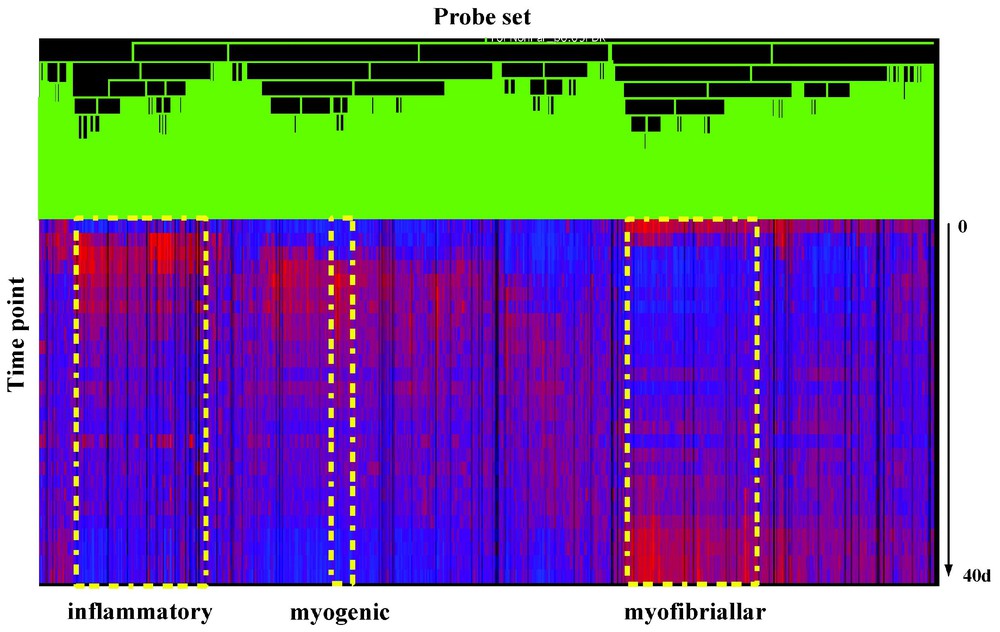
Supervised (time series) hierarchical clustering of genes over a 27-time-point temporal series of muscle degeneration/regeneration expression profiles.
Specific functional clusters are indicated (early inflammation cluster containing macrophage marker genes, myogenesis cluster, and myofibrillogenesis cluster).
Appendix C
Shown in Fig. 6 are potential downstream targets of MyoD defined by an in vitro cell-based assay system, defined by expression profiling with spotted cDNA arrays (Panel A), or Affymetrix arrays (Panel B), with expression of each gene studied as a function of muscle regeneration in vivo. Using Pearson's correlation coefficients for nearest neighbor analysis, the data from both the cDNA and Affymetrix gene sets resolves into at least three visually apparent temporal clusters. One cluster shows little expression at time 0, but with rapid increase in transcription at 12 hrs (12-h cluster). A second cluster shows induction of transcription at 3 days. These two clusters correspond to the two peaks of MyoD expression in vivo during muscle regeneration (see Fig. 3). This suggests that these two up-regulated gene clusters are likely biologically relevant to muscle regeneration, as their induction by MyoD in vitro correlates with temporally correct induction by MyoD in vivo. This also suggests that the majority of genes that are not contained in these two clusters are not biologically relevant to muscle regeneration.
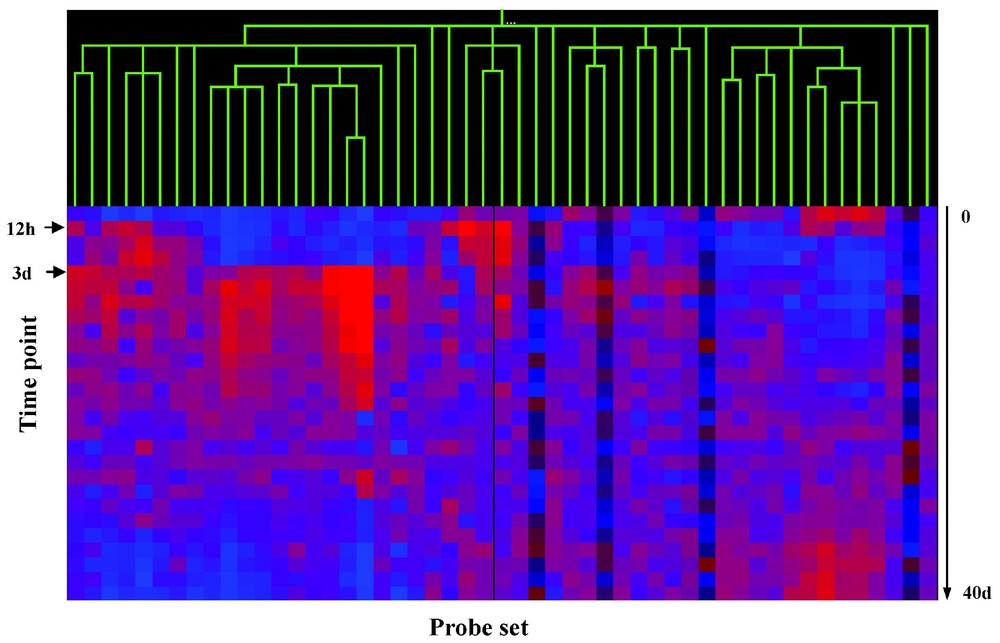
Filtering of genes up-regulated by MyoD in in vitro, against a 27-time-point in vivo regeneration series.
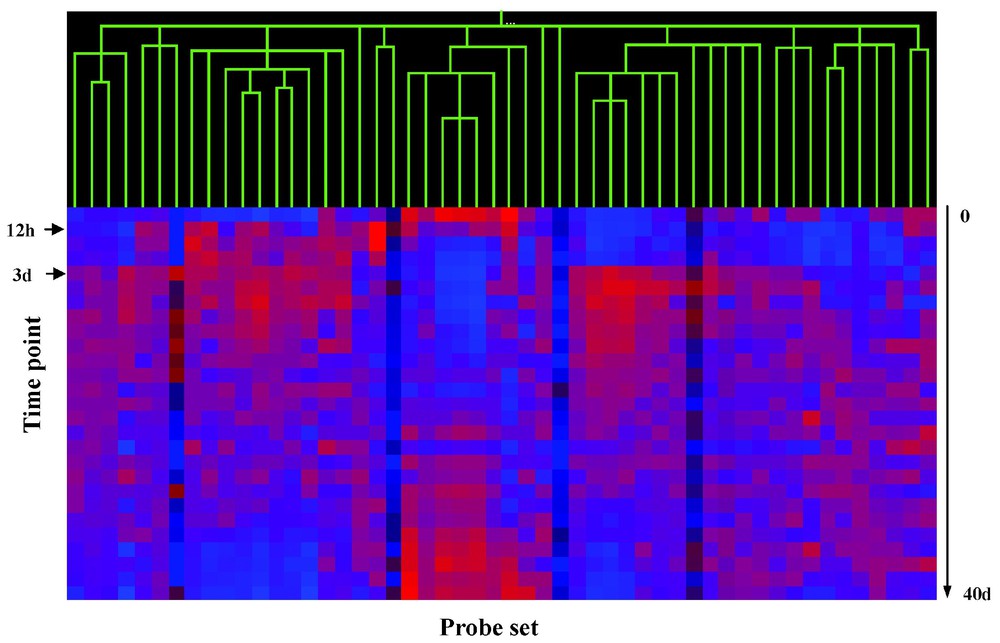
Appendix D
Shown in Fig. 7 is the visualization of genes showing downregulation by in vitro induction of MyoD, detected using both spotted cDNA arrays (Panel A), and Affymetrix arrays (Panel B) [13]. Temporal hierarchical clustering of these 22 genes/probe sets using Pearson's correlation coefficient shows poor resolution of the data into temporal clusters (compare to Fig. 4). Very few of the down-regulated genes show similar down-regulation at either the 12-h or 3-day peak of MyoD expression. This analysis suggests that few of the down-regulated gene targets for MyoD are biologically relevant to muscle regeneration in vivo.
Genes showing down-regulation by MyoD in vitro do not cluster well with in vivo data.
Appendix E
See Table 2.
Expression of in vitro upregulated MyoD targets in muscle regeneration and in HCE and VISDA cluster1
| GenBank | UniGene | Symbol | Gene name | FC | TP | HCE | VISDA |
| cluster | cluster | ||||||
| Genes not showing upregulation at 12h to 3d | |||||||
| D76432 | Mm.3929 | Zfx1ha | zinc finger homeobox 1a | – | – | Other | 3 |
| X04647 | Mm.181021 | Col4a2 | procollagen, type IV, alpha 2 | – | – | Other | 3 |
| AB026432 | Mm.29623 | Ddb1 | damage specific DNA binding protein 1 (127 kDa) | – | – | Other | 3 |
| X58196 | – | H19 | H19 | – | – | Other | 3 |
| U69176 | Mm.2399 | Lama4 | laminin, alpha 4 | – | – | 3 | |
| M14537 | Mm.86425 | Chrnb1 | cholinergic receptor, nicotinic, beta polypeptide 1 (muscle) | – | – | Other | 3 |
| Y17138 | Mm.686 | Actc1 | actin, alpha, cardiac | – | – | Other | 4 |
| X80903 | Mm.4875 | Dll1 | delta-like 1 homolog (Drosophila) | – | – | 12h/amb | 4 |
| M12347 | Mm.89137 | Acta1 | actin, alpha 1, skeletal muscle | – | – | 12h/amb | 5 |
| X59382 | Mm.2766 | Pva | parvalbumin | – | – | Other | 5 |
| L02526 | Mm.1059 | Map2k1 | mitogen activated protein kinase kinase 1 | – | – | 12h/amb | 6 |
| U07617 | Mm.6900 | Grb2 | growth factor receptor bound protein 2 | – | – | 12h/amb | 7 |
| AA023625 | Mm.9213 | Esr1 | estrogen receptor 1 (alpha) | – | – | 12h/amb | 7 |
| U62021 | Mm.5142 | Nptx1 | neuronal pentraxin 1 | – | – | Other | 7 |
| U68267 | Mm.125614 | Mybph | myosin binding protein H | Other | 9 | ||
| AA688834 | Mm.17307 | Rnpc2 | ESTs, Weakly similar to SIG41 [M.musculus] | – | – | 12h/amb | 10 |
| U64828 | Mm.2028 | Ncoa1 | nuclear receptor coactivator 1 | – | – | 10 | |
| D14340 | Mm.4342 | Tjp1 | tight junction protein 1 | – | – | Other | 10 |
| AI835917 | Mm.181309 | 2010003F24Rik | RIKEN cDNA 2010003F24 gene | – | – | Other | 11 |
| L12447 | Mm.578 | Igfbp5 | insulin-like growth factor binding protein 5 | – | – | Other | 12 |
| U13174 | Mm.4168 | Slc12a2 | solute carrier family 12, member 2 | – | – | Other | 12 |
| U43512 | Mm.7524 | Dag1 | dystroglycan 1 | – | – | Other | 12 |
| U60884 | Mm.4383 | Bin1 | myc box dependent interacting protein 1 | – | – | Other | 13 |
| AI852672 | Mm.26550 | Pfkm | phosphofructokinase, muscle | Other | 13 | ||
| AJ131021 | Mm.32033 | Rps6ka2 | ribosomal protein S6 kinase, 90kD, polypeptide 2 | – | – | 13 | |
| J04992 | Mm.39469 | Tnni2 | troponin I, skeletal, fast 2 | – | – | Other | 13 |
| U15541 | Mm.3841 | Cox8b | cytochrome c oxidase, subunit VIIIb | – | – | Other | 13 |
| M74570 | Mm.4514 | Aldh1a1 | alcohol dehydrogenase family 1, subfamily A1 | – | – | Other | 13 |
| D38216 | Mm.4519 | Ryr1 | ryanodine receptor 1, skeletal muscle | – | – | Other | 13 |
| L04966 | Mm.22660 | Rab18 | RAB18, member RAS oncogene family | – | – | Other | 13 |
| X99963 | Mm.687 | Arhb | aplysia ras-related homolog B (RhoB) | – | – | 12h/amb | 14 |
| AW122933 | Mm.28107 | Enpp2 | ectonucleotide pyrophosphatase/phosphodiesterase 2 | – | – | Other | 17 |
| D29016 | Mm.3204 | Fdft1 | farnesyl diphosphate farnesyl transferase 1 | – | – | Other | 17 |
| Z38015 | Mm.6529 | Dm15 | dystrophia myotonica kinase, B15 | – | – | Other | 17 |
| Genes absent | |||||||
| AF026799 | Mm.17911 | Lgals6 | lectin, galactose binding, soluble 6 | – | – | – | – |
| M17031 | Mm.22845 | Src | Rous sarcoma oncogene | – | – | – | – |
| Genes not on U74Av2 | |||||||
| AI430906 | Mm.179671 | Tns | tensin | – | – | – | – |
| AI326148 | Mm.725 | Rpl7a | ribosomal protein L7a | – | – | – | – |
| AI323868 | Mm.55 | Rfp | ret finger protein | – | – | – | – |
| AI413515 | Mm.14097 | Tapbp | TAP binding protein | – | – | – | – |
| AI451071 | Mm.25594 | Prkar2b | protein kinase, cAMP dependent regulatory, type II beta | – | – | – | – |
| AI448706 | Mm.105023 | Spnb2 | beta-spectrin 2, non-erythrocytic | – | – | – | – |
| W51433 | – | – | – | – | – | – | – |
| W97775 | Mm.39046 | 1110055E19Rik | RIKEN cDNA 1110055E19 gene | – | – | – | – |
| AA059763 | – | – | Similar to tubulin beta 2 | – | – | – | – |
| W12919 | Mm.141443 | Ldh1 | lactate dehydrogenase 1, A chain | – | – | – | – |
1 See Table 1 for interpretation of symbol and grouping.
Appendix F
See Table 3.
Expression of in vitro down-regulated MyoD targets in muscle regeneration and in HCE and VISDA cluster1
| GenBank | UniGene | Symbol | Gene name | FC | TP | VISDA |
| cluster | ||||||
| Genes showing downregulatation | ||||||
| U03419 | Mm.22621 | Col1a1 | procollagen, type I, alpha 1 | −2.7 | 1d | 2 |
| X98055 | Mm.2746 | Gstt1 | glutathione S-transferase, theta 1 | −5 | 12h | 6 |
| L47480 | – | BMP4 | bone morphogenic protein 4 | −2 | 3d | 8 |
| Y00516 | Mm.16763 | Aldo1 | aldolase 1, A isoform | −3 | 2d | 8 |
| AI852765 | Mm.24193 | Gpc1 | glypican 1 | −5 | 2d | 12 |
| D29639 | Mm.2491 | Hadhsc | L-3-hydroxyacyl-Coenzyme A dehydrogenase, short chain | −9 | 2d | 13 |
| Genes not showing downregulation | ||||||
| M92380 | Mm.22763 | Fstl | Follistatin-like | +3 | 3d | 3 |
| AA763466 | Mm.22621 | Col1a1 | procollagen, type I, alpha 1 | +2.5 | 5.5d | 3 |
| D13664 | Mm.10681 | Osf-2 | osteoblast specific factor 2 (fasciclin I-like) | +33 | 5.5d | 3 |
| AF053943 | Mm.4665 | Aebp1 | AE binding protein 1 | +2.8 | 6.5d | 3 |
| AI848798 | Mm.21549 | Cryac | crystallin, alpha C | +2.2 | 12h | 5 |
| AA638816 | Mm.368 | Psmb4 | proteasome (prosome, macropain) subunit, beta type 4 | NC | – | 7 |
| AB011030 | Mm.25760 | Prdc | protein related to DAN and cerberus | NC | – | 7 |
| U62021 | – | NPTX1 | neuronal pentraxin 1 | NC | – | 7 |
| U65636 | Mm.368 | Psmb4 | proteasome (prosome, macropain) subunit, beta type 4 | NC | – | 11 |
| X57024 | Mm.10600 | Glud | glutamate dehydrogenase | NC | – | 14 |
| L19932 | Mm.14455 | Tgfbi | transforming growth factor, beta induced, 68 kDa | +26 | 2d | 15 |
| X14678 | Mm.192224 | Zfp36 | zinc finger protein 36 | +4.7 | 12h | 15 |
| X83601 | Mm.4663 | Ptx3 | pentaxin related gene | +7.6 | 12h | 15 |
| U49513 | Mm.2271 | Ccl9 | chemokine (C-C motif) ligand 9 | +45 | 1d | 15 |
| U27267 | Mm.4660 | Cxcl5 | chemokine (C-X-C motif) ligand 5 | +200 | 12h | 15 |
| L15429 | Mm.856 | Tm4sf1 | transmembrane 4 superfamily member 1 | +2 | 12h | 16 |
| Genes absent | ||||||
| X51468 | Mm.2453 | Smst | somatostatin | – | – | – |
| AV145762 | Mm.29564 | Mmp2 | matrix metalloproteinase 2 | – | – | – |
| D30782 | Mm.4791 | Ereg | epiregulin | – | – | – |
| Genes not on U74Av2 | ||||||
| AI448727 | Mm.33892 | Copeb | core promoter element binding protein | – | – | – |
| AI429718 | Mm.9944 | Semcap3 | semaphorin cytoplasmic domain-associated protein 3A | – | – | – |
| Z25524 | – | – | integrin associated protein | – | – | – |
1 See Table 1 for interpretation of symbol and grouping.
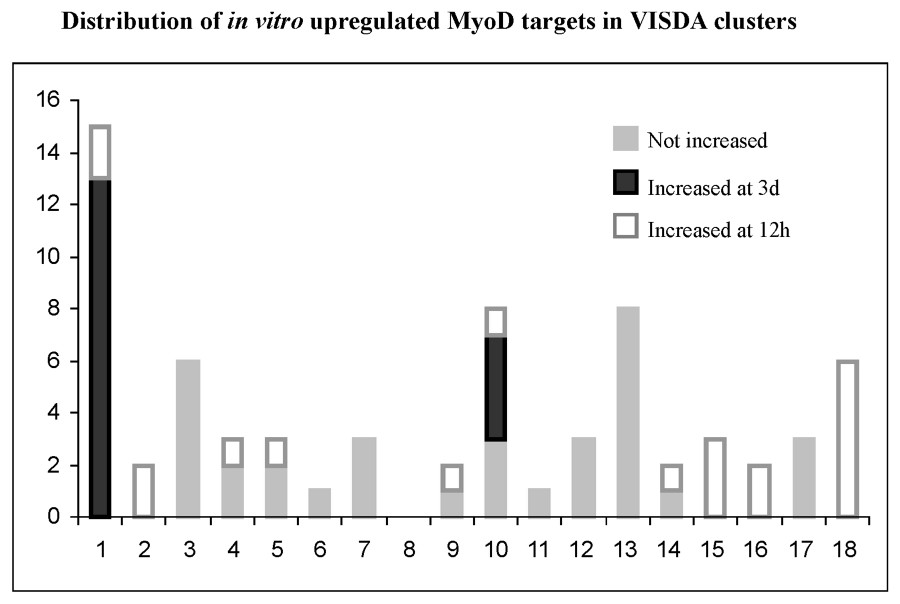
Appendix G
The 18 VISDA clusters are shown in Fig. 8, with the mapping of each of the in vitro MyoD candidate target genes to the clusters. Panel A shows the Bergstrom et al. up-regulated genes, and Panel B shows the down-regulated genes.
Mapping of potential in vitro down-stream targets of MyoD to VISDA clusters.
The clusters corresponding to the biphasic MyoD induction pattern in muscle regeneration at 12 h and 3 days are shown by color (see also Fig. 6). This shows that about 25% of the in vitro defined target candidates map to two clusters corresponding to induction at 3 days (see Table 1). This provides additional strong support for a 3-day cluster, and for these genes mapping to this cluster being likely bona fide downstream targets of MyoD at the 3-day time point. There was less support for genes showing temporal clustering to the 12-h time point. This cluster did not resolve as well in the entire data set, and is likely merged with inflammatory gene clusters.
There was no support for a gene cluster corresponding to down-regulation by MyoD at either the 12-h or 3-day-time points. This is expected given the small number of candidates in this group, and the action of MyoD as a transcriptional activator.