

1 Introduction
Clinical identification of cases of infectious diseases, whether human or non-human, is often the only way of tracking an epidemic. However, when the incubation period is long and variable, as in the acquired immunodeficiency syndrome (AIDS), variant Creutzfeldt–Jacob disease (vCJD) and bovine spongiform encephalopathy (BSE), the reported clinical incidence does not reflect trends in the spread of the infection. Brookmeyer and Gail [1,2] proposed a method known as back-calculation for estimating the incidence of human immunodeficiency virus (HIV) infection from AIDS incidence data and for obtaining short-term projections of the incidence of AIDS. This method relies on the principle that the known number of clinical cases results from an unknown past number of cases of infection and a known incubation period, defined as the time between infection and initial clinical onset. In order to obtain an unbiased estimate of the epidemic dynamics of an infection, the back-calculation method must be applied to accurate disease incidence data over time. Sometimes, however, the epidemiological characteristics of infectious disease and/or the characteristics of the study population result in biased disease incidence data.
In addition to a long and variable incubation period and age-dependent susceptibility/exposure, two other features have to be taken into account when studying the epidemic of BSE infection. First, one must consider under-reporting of BSE clinical cases and variations in the degree of under-reporting during the course of the epidemic. Up to June 2000, the surveillance of BSE was solely based on clinical surveillance through a mandatory reporting system (passive surveillance), in which veterinary practitioners and farmers were required to report animals with clinical signs of BSE. The difficult clinical diagnosis of BSE probably accounts for some under-reporting. In addition, between the description of the first clinical BSE case diagnosed in 1986 in the United Kingdom and the realization in 1996 that the most likely explanation for vCJD was exposure to the BSE agent [3–5], the BSE epidemic had no economic consequences for farmers and no known health consequences for humans. The reporting rate may thus have varied as awareness of the gravity of the disease grew. The second characteristic we must take into account is the particular demography of cattle. Indeed, as a result of human eating habits, many cattle are slaughtered young. Thus, the average survival time is shorter than the average BSE incubation period. This implies that some BSE-infected animals are selectively excluded from the passive surveillance system, as they die before the infection is diagnosed. Also, some animals die before being infected. Thus, both natural mortality and that resulting from slaughter must be taken into account. In our previous study [6], we adapted the back-calculation method by taking these epidemiological and demographic characteristics into account, and this allowed us to estimate longitudinal trends in the incidence of BSE infection in France on the basis of reported BSE clinical cases. We showed that estimates of the BSE infection epidemic in France were censored by cattle mortality and clinical under-reporting. We estimated that 51 300 cattle were infected by the BSE agent between July 1987 and June 1997, whereas only 103 clinical cases were detected by the passive surveillance system up to June 2000. Although we assumed that the French BSE epidemic started in 1980, in this analysis, we focused on estimates between July 1987 and June 1997, in order to avoid uncertainties as to what actually occurred in the 1980s. We asked: “How could 51 300 cattle infected by the BSE agent go unnoticed?” and “How was the French BSE epidemic underestimated?” Of course, not all cattle infected by the BSE agent had clinical signs of BSE, but what was the share of each form of censorship in the underestimation? And what was the risk for the French consumer?
Here, after studying the sensitivity of our previous results to variations in the model parameters, such as cattle mortality and the distribution of the incubation period, we estimated the parts played by cattle mortality and under-reporting of clinical cases in the underestimation of the French BSE epidemic. We estimated the number of infected cattle that developed clinical signs and the number of infected cattle that died before developing clinical signs. We also determined how many infectious cattle, in the clinical or preclinical stage of BSE, entered the human food chain.
2 The back-calculation method
2.1 The extended back-calculation method
We adapted the back-calculation method described by Becker and Marschner [7], taking the effect of age into account, in order to include the survival distribution of cattle and a time-dependent reporting rate of clinical BSE cases. The age covariate carries information about the incubation period of an individual when the infection rate depends on age, and permits the use of an incubation period distribution that is dependent on age at infection. In our adaptation of the back-calculation method, the age covariate was used to simultaneously estimate a time-dependent incidence of infection and a risk of infection for animals of different ages. The incubation period distribution was assumed to be independent of age at infection.
Let
In our model, survival is conditional on being alive at the time of infection. Indeed, only some cattle were exposed to the risk of contracting BSE agent, as others died or were slaughtered shortly after birth. It was therefore necessary to consider survival among animals that were alive at the time of infection. We assumed that the survival distribution was independent of time.
The unknown time- and age-specific number of infections was modelled by using the multiplicative model
| (1) |
To avoid an identifiability problem in model (1), we imposed the constraint
With this constraint,
2.2 Parameter estimation
Assuming that the age- and time-specific numbers of newly infected animals
| (2) |
Instead of assuming a parametric family of curves for α and λ, we used a non-parametric form and obtained maximum-likelihood estimates of age at infection and of the time-dependent risk of infection by using the EM algorithm [8]. However, when a large number of parameters are involved, the resulting EM estimates will tend to fluctuate implausibly. One simple remedy is to add a smoothing
Of course, when a smoothing step is added, the procedure no longer maximizes the likelihood; instead, the process is related to maximization of a penalized likelihood [7]. There is thus no compelling reason to use a convergence criterion based on the value of the likelihood. It is logical to use a convergence criterion based on the values of the parameters of interest. We chose small positive values for
2.3 Model-selection criterion
When estimating the age- and time-specific numbers of newly infected animals with the back-calculation method, all other model epidemiological parameters need to be known. This means that sufficient data must be available from other sources for accurate estimation. If such data sources are not available, flexible functions should be attributed to these parameters; sensitivity analyses should then be performed and a selection criterion should be defined to choose the best model. Here, as we lacked independent data from which to estimate the time-dependent clinical BSE case reporting function and the incubation period distribution, we assumed flexible functions for these parameters, performed sensitivity analyses, and chose the best model on the basis of Akaike's information criterion (AIC) [10], as follows:
The parameters regarding the demography of French cattle (
2.4 Confidence intervals
The usual asymptotic properties of maximum-likelihood estimates do not apply in the present context, because of the large number of parameters. Following the method of Becker and Marschner [7], we used bootstrap estimates of precision. In this procedure we first use the EM algorithm to obtain the maximum-likelihood estimates of
3 Application
3.1 The French BSE history and the high-risk period for French consumers
In France, BSE became a notifiable disease in June 1990. In December 1990, a mandatory passive surveillance system was set up, in which veterinary practitioners and farmers were required to report animals with clinical signs. The first case of BSE identified by this surveillance system was detected in 1991. A total of 103 cases were identified by passive surveillance between 1991 and June 2000. From mid-2000 to July 2001, the surveillance system underwent several changes. From mid-2000, in addition to the mandatory reporting system, a pilot study of rapid testing was implemented on cattle at risk (dead-on-farm, emergency-slaughtered and euthanatized cattle). Then, from January 2001, systematic screening was extended to all cattle over 30 months of age entering the food chain, and this age was reduced to 24 months in July 2001. Implementation of active surveillance revealed the inefficiency of passive surveillance, both in France and elsewhere. In France, comparison of the results of the passive and active surveillance systems between July 2001 and June 2002 showed that only 20% of BSE cases were identified by passive surveillance. This implied considerable BSE case under-reporting throughout the epidemic.
Only animals slaughtered for consumption late in the incubation period and, above all, animals in the clinical stage, are likely to be infectious. Consequently, regarding the exposure of the French human population to the BSE agent via the French BSE epidemic, the period at risk was situated before the implementation of rapid tests. In addition, only the period before July 1996 was at high risk, i.e. the period before the French ban on high-risk bovine tissues (‘specified offal’) from all cattle entering the human food chain.
3.2 Data
For the above reasons and because of the above-mentioned changes in the French BSE monitoring system, our analysis was restricted to clinical cases detected before July 2000, i.e. the 103 cases identified by passive surveillance between 1991 and June 2000 [6]. All the animals were cows aged between 4 and 9.5 years at clinical onset; the median age was 5.5 years and the interquartile range was
The assumption of independence regarding the number of new clinical cases is reasonable (Section 2.2), as only 3 of the 103 clinical cases of BSE detected up to June 2000 were secondary cases.
3.3 BSE epidemiological characteristics and cattle demographics
Epidemiological data on clinical onset by age, assuming a long incubation period, suggest that most infections occur shortly after birth. This means that the infection rate depends on age. We therefore took the effect of age into account by estimating an age-dependent susceptibility and/or exposure to infection, as available data did not allow us to discriminate between the two. As the data did not allow estimating a susceptibility/exposure per year of age, we estimated susceptibility/exposure per age class. We considered six susceptibility/exposure groups (in years): ]0–0.5], ]0.5–1], ]1–2], ]2–3], ]3–5], ]5–30]. The smoothing step was not appropriate for age-dependent susceptibility/exposure to infection, because of the small number of groups.
We explored two incubation period distributions – a gamma distribution and a distribution derived from a mechanistic model.
When assuming the gamma distribution, the probability density function of the incubation period
Another assumed incubation period distribution arises from a mechanistic model of disease pathogenesis [12]. The underlying model assumes that the prion density grows exponentially, at rate
The sharp increase in the incidence of BSE noted when the first systematic screening program was instigated revealed the inefficiency of passive surveillance. Thus, a time-dependent BSE case reporting function had to be introduced. A logistic shape was assumed for the time-dependent reporting function, starting in June 1990, with zero reporting before this date (no monitoring system existed):
The logistic function depended on two parameters, namely β the shape parameter and θ the parameter determining the reporting probability in June 2000. Let
By varying β, we explored a wide range of reporting shapes, from constant reporting throughout the epidemic
Data on cattle demography were obtained from the French reference database for bovine identification (‘Base de données nationale d'identification’, BDNI). Launched in 2000, this system is administered by the DGAL, a department of the Ministry for Agriculture, Food and Fisheries. It allows cattle to be followed from birth to death. We obtained data on the age-specific numbers of cattle alive on 1 January 2002 and on 1 January 2003, and on the age-specific numbers of cattle sent to the abattoir and rendered in 2002 and 2003. The comparison of estimates between 2002 and 2003 showed no change, and allowed us to assume that these demographic parameters were stationary. We used the demographic data for 2002 to estimate the survival distribution (Fig. 1, ▴), the age-specific risk of death, and the age-specific proportion of cattle mortality resulting from slaughter. The median survival was 2.3 years and the interquartile range was
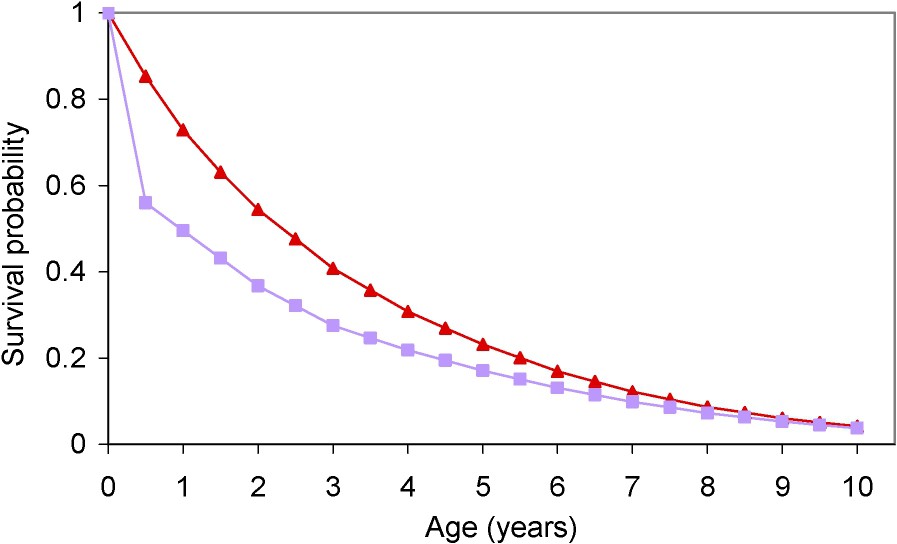
Estimated survival distributions of French cattle in our previous study (■) [6] and in the present study (▴).
3.4 Estimates of BSE infections, preclinical and clinical cases, and predictions
The time-dependent intensity of infection
From the estimated number of cattle infected by the BSE agent, we ascertained by simulation the fate of each infected animal in order to determine the number of cattle that developed clinical signs of BSE (clinical BSE cases), the number that died or were slaughtered before clinical onset (preclinical BSE cases), and the number of ‘infectious’ animals that entered the human food chain (infectious preclinical BSE cases). We defined as ‘infectious’ an animal infected by the BSE agent that was slaughtered at the abattoir within the year before clinical onset. For each infected animal, we randomly assigned an age at infection, an incubation period, and a lifetime, given that the animal was alive at the age of infection. We thus obtained the number of infected cattle between times s and
The number of new BSE clinical cases at time t was predicted by:
3.5 Results
Table 1 shows estimates that minimized the AIC according the reporting probability in June 2000 and the distribution of the incubation period. The gamma distribution always fitted the data slightly better, based on the AIC, than the distribution derived from the mechanistic model (Table 1). We therefore assumed a gamma distribution in subsequent calculations. Except for a reporting probability of 99% in June 2000, whatever the reporting probability in June 2000, the best models suggested that the average BSE incubation period was about 5.6 yr, that the variance was about 2.6 yr2, that 99% of infections occurred between 0.5 and 1 year of age, and that the value of the shape parameter of the reporting function, β, was −0.5. The model assuming a reporting probability of 99% fitted the data less well than the other models. Similar AICs were obtained for all other assumed reporting probabilities in June 2000, so the Burnham and Anderson empiric rule did not allow us to select one value rather than another. To establish the reporting probability in June 2000, as in our first study we compared estimated annual numbers of clinical BSE cases with observed clinical cases for the periods July 2000 to June 2001 and July 2001 to June 2002. Passive surveillance detected 134 clinical BSE cases between July 2000 and June 2001 and 60 clinical BSE cases between July 2001 and June 2002; in addition, respectively 75 and 161 BSE cases were detected among cattle at risk. We also reported the number of BSE cases detected among cattle at risk, because a retrospective clinical investigation [13] suggested that the vast majority of BSE cases detected among cattle at risk should have been included in the mandatory reporting system (passive surveillance), as the animals concerned had clinical signs of BSE. This implied that the numbers of clinical BSE cases estimated by the model should be at least equal to the number detected by passive surveillance, in order to be consistent with reality, i.e. 134 clinical BSE cases between July 2000 and June 2001 and 60 between July 2001 and June 2002. Using a reporting probability of 5% in June 2000, we estimated that roughly 154 and 94 clinical cases would have been detected by the passive surveillance system for the periods from July 2000 to June 2001 and July 2001 to June 2002, respectively, compared to 76 and 47 clinical cases if the reporting probability was 10%. Thus, the assumed reporting probability of 10% or more in June 2000 underestimated the true situation. When using a reporting probability above 6%, estimated numbers of clinical BSE cases were lower than observed numbers. In addition, when using a reporting probability under 4%, estimated numbers of clinical BSE cases were higher than the sum of observed numbers of BSE cases detected by passive surveillance and among at risk cattle. It was not possible to select a value between 4% and 6% for the reporting probability, for example with the mean square criterion, as we did not know how many cattle would have been detected by passive surveillance. Nevertheless, in subsequent calculations we assumed that the reporting probability in June 2000 was 5%.
Estimates obtained according to the reporting probability in June 2000 and the distribution of the incubation period
| Reporting probability in June 2000: |
|||||
| 0.05 | 0.10 | 0.15 | 0.20 | 0.99 | |
| Gamma incubation period distribution | |||||
| AIC | 326.2 | 326.2 | 326.1 | 326.1 | 331.8 |
| Shape parameter of the reporting curve (β) | −0.5 | −0.5 | −0.5 | −0.5 | −0.7 |
| Mean of the incubation period (years) | 5.6 | 5.6 | 5.6 | 5.7 | 6 |
| Variance of the incubation period (years2) | 2.6 | 2.6 | 2.6 | 2.7 | 2.7 |
| Distribution of age of infection (years) | |||||
| ]0–0.5] | ≈0 | ≈0 | ≈0 | ≈0 | ≈0 |
| ]0.5–1] | 0.99 | 0.99 | 0.99 | 0.99 | 0.95 |
| ]1–2] | ≈0 | ≈0 | ≈0 | ≈0 | 0 |
| ]2–3] | 0 | 0 | 0 | 0 | 0 |
| ]3–5] | 0 | 0 | 0 | 0 | 0.04 |
| ]5–30] | 0 | 0 | 0 | 0 | 0 |
| Mechanistic incubation period distribution | |||||
| AIC | 328.3 | 328.3 | 328.2 | 328.2 | 334.0 |
| Shape parameter of the reporting curve (β) | −0.5 | −0.5 | −0.5 | −0.5 | −0.9 |
| Mean of the incubation period (yr) | 5.5 | 5.5 | 5.5 | 5.5 | 5.8 |
| Variance of the incubation period (yr2) | 2.9 | 2.9 | 2.9 | 2.9 | 2.8 |
| Distribution of age of infection (yr) | |||||
| ]0–0.5] | 0 | 0 | 0 | 0 | ≈0 |
| ]0.5–1] | 0.99 | 0.99 | 0.99 | 0.99 | ≈0.95 |
| ]1–2] | ≈0 | ≈0 | ≈0 | ≈0 | 0 |
| ]2–3] | ≈0 | ≈0 | ≈0 | ≈0 | 0 |
| ]3–5] | ≈0 | ≈0 | ≈0 | ≈0 | ≈0.05 |
| ]5–30] | 0 | 0 | 0 | 0 | 0 |
Under the assumptions of the best model, we estimated that 44 800 cattle (95% confidence interval
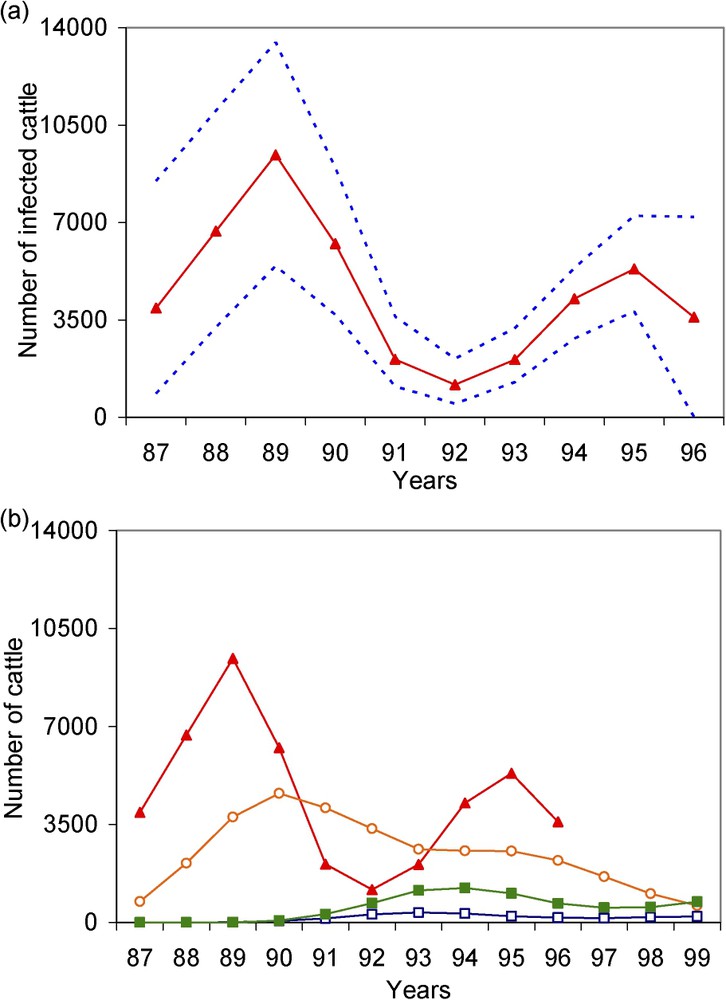
(a) Estimated (▴) annual incidence of BSE infection with 95% bootstrap confidence intervals (- - - -); (b) Incidence of clinical BSE cases (■), preclinical BSE cases (○) and ‘infectious’ preclinical BSE cases (□) obtained by simulation from the estimated incidence of BSE infection. We defined clinical BSE cases as infected cattle that had clinical signs of BSE, preclinical cases as infected cattle that died or were slaughtered before clinical onset, and ‘infectious’ preclinical BSE cases as infected cattle slaughtered at the abattoir within the year before clinical onset. Estimates and simulations were obtained by assuming a reporting probability of 5% in June 2000 and parameter β of the reporting curve =−0.5. Masquer
(a) Estimated (▴) annual incidence of BSE infection with 95% bootstrap confidence intervals (- - - -); (b) Incidence of clinical BSE cases (■), preclinical BSE cases (○) and ‘infectious’ preclinical BSE cases (□) obtained by simulation from the estimated incidence of BSE ... Lire la suite
In our previous study [6], in which we used a different cattle survival distribution (Fig. 1, ■), the best model suggested that the average BSE incubation period was 5 yr, the variance was 1.8 yr2, that 86% of infections occurred between 0.5 and 1 yr of age and 8% between 1 and 2 years of age, that the value of the shape parameter of the reporting function, β, was −0.6 and that the reporting probability in June 2000 was 5%. We estimated that 51 300 cattle
The values retained in this study for the shape parameter of the reporting curve and for the parameters of the incubation period distribution were slightly higher than in our previous study. The number of BSE infections estimated in the present study was slightly lower than in our previous study. However, the confidence intervals of the estimate of the number of BSE infections were compatible in the two studies. Fig. 3 shows the dynamics of the BSE infection epidemic obtained in our two studies, under the assumptions of the best model. Up to the beginning of the 1990s, the curve estimated in the present study is above the curve estimated in the previous study, and then it is the other way round.
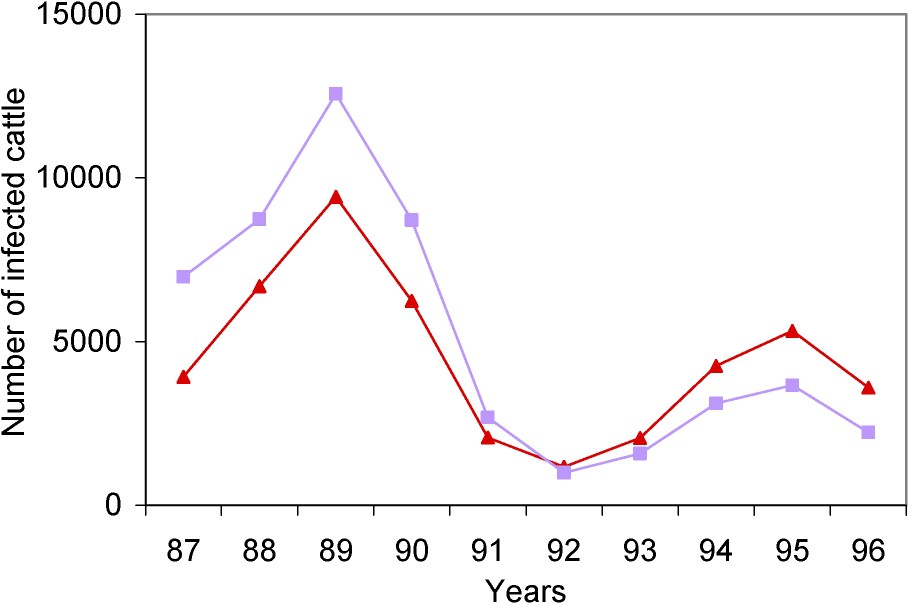
Estimated annual incidence rates of BSE infection obtained in the present study (▴) and in our previous study (■) [6], under the assumptions of the best model.
We also simulated the fate of cattle estimated to have been infected by the BSE agent in France in the present study. Fig. 2b illustrates the dynamics of the BSE infection epidemic between July 1987 and June 1997 obtained in the present study, and the numbers of the preclinical, ‘infectious’ preclinical and clinical BSE cases resulting from this epidemic. To assess the proportion of cattle estimated to be infected by the BSE agent that should have been detected by the passive surveillance system, we focused on what happened before July 2000, the date of implementation of rapid tests. To assess the risk for the consumer, we focused on cattle that entered the human food chain before July 1996, when high-risk bovine tissues (‘specified offal’) were banned from human consumption.
Based on the estimated 44 800 cattle
Until June 1996, we estimated that 4600 cattle
4 Discussion
Some cattle, infected by the BSE agent, were not reported in France, either because of death from competing causes before disease onset or because the disease went undiagnosed. In this study, after having examined the sensitivity of our estimates to cattle mortality and to the incubation period distribution, we assessed the part played by each form of censorship in the under-estimation of the French BSE epidemic, and the risk for the consumer.
In contrast to our previous study [6], here we used an updated survival distribution. Indeed, newly available data from a single accurate source allowed us to estimate the survival distribution, whereas in our previous study we pooled data from three sources. The survival probabilities estimated in the present study were higher than in our previous study. Nevertheless, as explained in Section 2.1, both models considered conditional survival. The conditional survival probabilities markedly were less different than the unconditional survival probabilities.
In the two studies, we obtained the same reporting probability of BSE clinical cases in June 2000 (5%), and a similar distribution of age at infection. In this study, we estimated that 99% of infections occurred between 6 and 12 months of age, compared to 87% in our previous study. Slight shifts occurred in the values retained for the shape parameter of the reporting function (−0.5 in this study versus −0.6 in the previous study), and in the mean and variance of the incubation period (5.6 yr and 2.6 yr2 versus 5 yr and 1.8 yr2). When comparing the dynamics of the BSE infection epidemic in our two studies, we observed that the curve obtained in the present study was above the curve obtained in our previous study, and that the situation then reversed. The value of the shape parameter of the reporting function only influences the dynamics of the curve in the 1980s (results not shown). The fact that the curve obtained in the present study is above the curve obtained in our previous study from 1992 (Fig. 3) results from the lengthening of the mean incubation period in the present study. Indeed, the longer the incubation period, the smaller the number of infections early in the epidemic and the larger the number of infections in the recent past. In the present study, the mean estimate of the number of infected cattle for the period July 1987 to June 1997 is slightly lower than in the previous study (44 800 versus 51 300). Nevertheless, the ranges of these estimates were similar: 22 700 to 70 700 cattle in the present study and 24 300 to 84 700 in the previous study. Finally, the use of a higher survival distribution results in slightly different estimates of certain parameters (such as the mean incubation period and the reporting rate of clinical cases of BSE) and in a lower estimate of the number of infected cattle. It is not possible to determine whether the age of slaughter varied following changes in consumer habits, or whether the data used for our previous study were inadequate to accurately reconstruct the survival distribution. The longer the survival time, the smaller the number of infections required to observe the reported number of clinical cases of BSE.
In both studies the best-fit model suggested that almost all BSE infections occurred between 6 and 12 months of age. Our results confirm those of Anderson et al. [14] and Ferguson et al. [12] regarding the British BSE epidemic, but differ from those of Arnold and Wilesmith [15], who concluded that the risk of infection was highest during the first 6 months of life. The best model in the present study suggested that the mean incubation period was 5.6 yr, compared to 5 yr in our previous study. These values are compatible with the estimates of 5 yr, 4.75–5.00 yr and 5.5 yr obtained respectively by Anderson et al. [14], Ferguson et al. [12], and Arnold and Wilesmith [15]. Contrary to Ferguson et al. [12], we found that the gamma distribution fitted the data slightly better than the distribution derived from the mechanistic model.
Overall, it can be considered that BSE infection in cattle occurs during the first year of life, and that the incubation period lasts between 4.75 and 5.6 yr.
We estimated that 44 800 cattle
Regarding the risk for the French consumer represented by French bovine products, only the period before the exclusion of high-risk bovine tissues (‘specified offal’) from human consumption in June 1996 was at high risk. Therefore, we focused on the number of ‘infectious’ preclinical and clinical BSE cases entering the human food chain before this date. Up to June 1996, we estimated that 1400 infected cattle
To simplify the following discussion, we defined late-stage cattle as cattle slaughtered within 12 months of clinical onset, thus including clinical BSE cases and ‘infectious’ preclinical cases. In the best-case scenario, i.e. if only 15% of cattle with clinical BSE that were not detected by passive surveillance were sent to the abattoir, 2087
Another source of exposure of the French human population to the BSE agent was imported British bovine products. We focused on the period before November 1989, when the British specified-offal ban was implemented. In 1997, Ferguson et al. [12] estimated that 954 000 British cattle had been infected by the BSE agent. Of these, only 8000 late-stage cattle entered the British human food chain before November 1989. In 2003, in an updated study, Ferguson and Donnelly [16] estimated that 4 000 000 British cattle had been infected by BSE, but did not report the number of late-stage animals slaughtered for human consumption. In order to obtain a rough idea of this number, we used the same ‘late-stage/infected’ ratio as in the first study by Ferguson et al. [12]. We thus estimated that 27 673 late-stage cattle entered the British human food chain before November 1989. Exposure of the French human population via imported British bovine products was estimated to represent between 5% and 10% of the exposure level of the British population [17]. Based on the last study by Ferguson and Donnelly [16], between 1384 and 2767 late-stage cattle entered the French human food chain before November 1989, while based on the first study by Ferguson et al. [12] between 400 and 800 late-stage cattle did so. Consequently, exposure of the French human population to the BSE agent via French bovine products was not negligible. In addition, exposure of the French human population to the BSE agent via French bovine products occurred later than exposure via imports of British bovine products. Consequently, keeping in mind that the incubation period of vCJD is 15 years [18], exposure of the French human population to the BSE agent via French bovine products from 1990 could lead to an increase of the number of French cases of vCJD from 2005. This is supported by the observed number of the definite or probable cases of vCJD in France: 1 in 1996, 1 in 2000, 1 in 2001, 3 in 2002, 2 in 2004 and 5 in 2005.
This study shows how the French BSE epidemic was underestimated and that the risk for the French consumer from French bovine products was not negligible compared to the risk from imported British products. Not only was clinical surveillance inefficient, but the BSE epidemic also went unnoticed because of the particular demography of French cattle. Therefore, when estimating the size and kinetics of an epidemic, it is important to consider not only the epidemiological characteristics of the disease but also the characteristics of the study population. This applies not only to the BSE epidemic but also to other infectious diseases such as AIDS and hepatitis C: as effective treatments artificially lengthen the ‘incubation period’, deaths due to competing causes can no longer be ignored.
Acknowledgements
This work was funded by a grant from GIS ‘Infection à Prions’. We are grateful to DGAL (‘Direction générale de l'alimentation’) for providing demographic data on cattle.