

1 Introduction
The pattern of resource use by the animal species is one of the central topics in the study of biological communities. Some studies have confirmed a close relationship between resource availability and bird-foraging ecology [1,2]. The spatio-temporal variation in food distribution can affect the abundance and the foraging behaviour of birds [3–5], particularly the food resources for insectivorous birds, which change drastically with the season [6]. In addition, the behaviour of birds is also known to vary seasonally: birds adjust important biological activities (breeding, moulting) according to seasonal fluctuations of local conditions.
Tropical habitats can fluctuate seasonally, particularly rainfall, affecting the food availability for bird species [7,8]. Patterns of leaf growth and loss determine also the associated production. The massive leaf production during the wet season supports an increased density of arthropods upon which many birds feed [9]. In a tropical dry forest, prey can vary in quantity and quality, especially the litter arthropods [10,11] or the insects linked to new leaves availability [12].
Such changes may influence foraging tactics: food availability constrains the type of foraging techniques that can be used efficiently by a bird. However, the bird does not modify its foraging techniques as easily as other foraging characteristics, e.g., substrate choice [13]. Rosenberg [14] suggested that the foraging tactics used by birds considerably affects the accessibility of prey on different substrates. In addition, Hejl and Verner [4] indicated that some species of birds living in the same habitat undergo similar changes in foraging behaviour and diet as temporal changes affect resources abundance and distribution.
Most studies on seasonal foraging ecology have been done in northern temperate zones, but the effects of seasonality in tropical forests, especially in Madagascar, have been little studied. I present here the results of a two-year study aimed at investigating the seasonal variability of two terrestrial coua species in a western dry forest in Madagascar. I hypothesized that, tracking food availability, the two species will seasonally change their foraging strategies. In addition, in two forest plots differing by their proximity to water, I evaluated whether vegetation structure influences their foraging behaviour.
2 Material and methods
2.1 Study site
The study site was in the 10 000-ha forestry concession of the ‘Centre de formation professionnelle forestière’ de Morondava (CFPF), in the Kirindy forest, near the western coast of Madagascar. The concession was 60 km northeast of Morondava (44°39′E, 20°03′S) in the deciduous forest, in the region called Menabe [15]. Rainfall varied widely from year to year, and ranged from 300 to 1400 mm per year (80% falling in January–February) with an annual average of 800 mm [16]. Temperature variability may be very large: mean daily maximum are around 36 °C and the minimum around 19 °C [17]. Foraging data were recorded during the rainy season (December to February) and the beginning of the dry season (March to June) in 1997 and 1998.
The Kirindy River crosses the forest from east to west (Fig. 1). Proximity of the water is important to the distribution and structure of the vegetation [18,19].
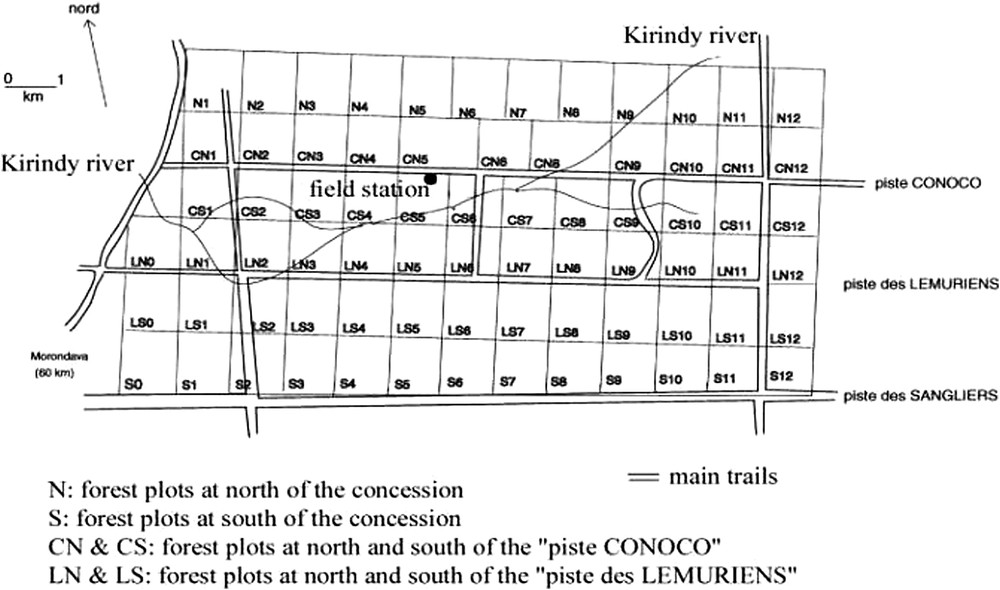
Map of the Kirindy forest (CFPF forest concession). The letters and numbers indicated the different forest plots. The field station was located near the ‘piste Conoco’. Field studies were performed in the plots CS-6 (gallery forest) and N-5 (‘dry forest’).
The study took place in plot CS-6, logged in 1980 [20] and plot N-5, logged in 1990 [21]. In this study, plot CS-6, near the Kirindy River, will be referred to as gallery forest and plot N-5, 3 km from the river, will be referred to as dry forest. Both forests will be referred to as habitat. The study area lay on around 100 ha in each one of the two plots (Fig. 1).
Seven hundred and sixty-one trees (dbh > 40 cm) were logged in CS-6 for a yield of 1.3 m3 of timber/ha [20]. 1289 trees were logged in N-5 for a yield of 1.07 m3 of timber/ha [21]. The fact the two plots were logged eliminated a possible interaction of the degradation due to logging on the habitat structure. The fact that ten years separated the two logging operations between the two plots was probably not important on the modification of the habitat structure, because the tropical dry forest is known to have a long regeneration time [22]. A possible modification of the vegetation structure between the two plots could be only due to the seasonal variation.
2.2 Vegetation structure
I measured vegetation structure on 50 points randomly chosen into each plot. These points were along several transects made in the two plots and during the two seasons (see [23] for more details about the methodology used). I estimated the following variables: canopy height; canopy cover (estimated at the nearest 10%); estimated mean distance visible at 1.5-m height, measured in two different directions randomly chosen and number of lianas and stems (dead and live) in 4 m2 around the point into the understorey vegetation. Canopy height, number of lianas and number of stems were only used to compare the two plots (CS-6 and N-5) but not used to compare the seasonal variation, because these variables were supposed not to change between seasons. Visibility was used as an index of the understorey vegetation density: vegetation density = 1/visibility.
2.3 Study species
Two terrestrial couas were encountered in Kirindy: Coquerel's coua (Coua coquereli) and the Giant Coua (Coua gigas). This last species is around 50% bigger than the first one (Chouteau, unpublished data). There was no morphological variation associated with sex. Some previous works analysed some biological aspects of these species (see [24], for a review of the ecology of these species).
Densities of Coquerel's Coua and Giant Coua in each habitat were previously measured during the rainy season [23]: Coquerel's Coua was more abundant in the logged gallery forest (24.2 individuals/km2) than in the logged dry forest (17.3 individuals/km2).
Giant Coua was slightly more abundant in the logged gallery forest (3.7 individuals/km2) than in the logged dry forest (2.4 individuals/km2).
2.4 Data collection
Observations of foraging events were opportunistic, but I attempted to observe at various times of day, although couas were difficult to locate. I obtained several foraging sequences during at least 1 min, but no more than 5 min, and I let a period of 30 min between two successive observations. Although some investigators recommend taking only the first foraging event for analysis, I retained all of them to insure recording inconspicuous foraging events and to reduce biases towards most common foraging techniques and substrates used.
I ringed five Coquerel's Coua and four Giant Coua in plot CS-6, 11 Coquerel's Coua and two Giant Coua in plot N-5 [25]. In addition, data were also obtained in both plots on some unringed birds. Furthermore, I made several observations, separated in time and space, most probably concerning different individuals. However, the same individuals were potentially recorded during the two seasons in a same plot.
In the logged forest, I obtained 54 sequences during the rainy season and 52 sequences during the dry season for Coquerel's Coua (respectively 66 and 42 for Giant Coua).
In the dry forest, I obtained 56 sequences during the dry season and 52 sequences during the rainy season for Coquerel's Coua (respectively 40 and 46 for Giant Coua).
During these observations, I tried to identify the prey captured. Because couas were particularly difficult to handle and were easily stressed, I did not use emetic administration to obtain samples.
2.5 Foraging behaviour
Five foraging variables were considered: mean height reached by climbing in the vegetation above the ground when the birds foraged, foraging techniques used, substrates used, prey size, and capture rate.
Terrestrial couas foraged mainly on or near the ground (in the first 30-cm level above the ground). However, some preys were captured higher in the vegetation. To capture these prey, the birds had to leave the ground and climb in the vegetation. I was interested to know if the two species differed in their ability to climb and to capture prey high in the vegetation and what was the proportion of prey captured by this way. In this case, although I considered that couas were typically terrestrial birds, which foraged on or near the ground, I hypothesized that, if there were a possibility to climb and search for prey in understorey vegetation, they did it efficiently. The heights of the places where the birds foraged were recorded at the nearest 10 cm, by comparison with the height of the observer. Giant Coua can climb until 10 m high from the ground (personal observation).
I recorded the kind of capture techniques the birds used as follows, modified from Remsen and Robinson [26]. ‘Glean’: prey captured on the substrate, without extension of the legs or the neck, and without a manipulation of the substrates. Preys captured by gleaning were usually spotted nearby (<0.3 m) and the attack did not involve a flight component. ‘Lunge’: prey captured by running, on the litter (running prey) or in the air (flying prey). ‘Leap’: prey captured by a jump (without using the wings), above the ground. ‘Sally’: prey captured by a powerful jump, with use of the wings. Prey captured by sallying was always higher than prey captured by leaping. ‘Probe’: prey captured after a manipulation of the substrate (i.e. by using the bill to gap the dead leaves on the litter or to chase the prey into the dead curled-leaves or behind a part of bark). ‘Other’ included prey captured by other techniques, as with extension of the neck and/or the legs. For the statistical analysis, sally and leap were pooled together.
Substrates used were defined as: ‘ground’ (on and into leave litter), ‘leaves’, ‘trunk’, ‘stem’, ‘other’ (including dead trunk and air for flying prey). I assumed that these substrates would harbour different prey types, and some differences in their use could help to segregate the foraging strategies used by these two couas. However, because of the difficulty to distinguish easily between a stem or a dead leaf during the dry season, ‘leaves’ and ‘stems’ were pooled together in this analysis as ‘foliage’.
Prey size was estimated from bill length. Three prey size classes were defined as: small (<0.5 cm); medium (0.5–1.5 cm) and long (>1.5 cm). The biggest animal prey was easily recognized. Seeds were identified because they were usually grouped on the ground under a particular tree. I was able to identify the remaining seeds after the bird ate them. But because all seeds were not identified, particularly the smallest ones, I presumed that the number of eaten seeds was underestimated.
It was impossible to estimate the prey size if the bird swallowed the prey quickly, or if the individual was not well visible. The proportion of prey size not measured was 22.7% for Coquerel's Coua and 19.1% for Giant Coua for both plots and during the two seasons.
The attack rate was used as an indirect measure of the prey availability. I usually could not always determine whether an attack was successful, so this measure referred only to the rate at which prey was attacked, not captured. To calculate it, I retained more than 20 periods for each species and into each habitat. These periods were at least equal to 20 min to reduce the bias introduced by inactive behaviour (preening, basking, singing, and resting). These periods were chosen spatially and temporally separated on different individuals to assure the independence of the data. To assess the attack rate, I used the total number of events of capture, divided by the total duration for each period. I used each period as an independent data point to compare the attack rate.
2.6 Data analysis
For techniques and substrates variables, expressed as proportions, I used a multivariate analyse of Variance (MANOVA) to compare the interseasonal variation (the two seasons compared into each habitat) and to compare the intraseasonal variation (one season compared between the two habitats), with season or habitat used as independent variable and techniques or substrates used as dependant variables. I did not include the ‘other’ categories in the MANOVA to avoid non-independence of proportions [27]. Statistical analyses have been done with Statistica [28].
The proportion of climbing was analysed by chi-square tests (procedure FREQ, [29]). Height reached by climbing and rate of capture were calculated by a Man–Whitney test (procedure NPAR1WAY, [29]).
3 Results
3.1 Vegetation structure
In the gallery forest (plot CS-6), no variation was recorded for the canopy cover and for the density of understorey vegetation (Table 1). However, litter was deeper during the dry season, but litter cover was greater during the rainy season (Table 1).
Variations of the habitat structure, according to the plots and the seasons
| Habitat variables | Gallery forest (plot CS-6) | Dry forest (plot N-5) | N-5 vs. CS-6 | |||||
| Rainy season | Dry season | Result | Rainy season | Dry season | Result | Rainy season | Dry season | |
| Canopy height (m) | 14.10±2.42 | 14.25±3.04 | – | 10.85±3.55 | 10.63±2.21 | – | t=5.40⁎⁎⁎ | – |
| Canopy cover (%) | 70.60±14.6 | 73.17±22.49 | t=0.70 ns | 74.50±13.07 | 59.49±20.16 | t=5.62⁎⁎⁎ | t=1.54 ns | t=4.20⁎⁎⁎ |
| Visibility at 1.5 m (m) | 6.39±2.70 | 7.50±2.20 | t=1.87 ns | 5.03±2.66 | 6.22±1.80 | t=4.66⁎⁎⁎ | t=3.96⁎⁎⁎ | t=0.57 ns |
| Number of lianas (/4 m2) | 1.38±1.18 | – | – | 1.88±1.55 | – | – | t=1.87 ns | – |
| Number of stems (/4 m2) | 0.58±0.76 | – | – | 2.53±2.55 | – | – | t=5.16⁎⁎⁎ | – |
| Litter depth (mm) | 14.90±5.39 | 32.50±9.89 | t=10.31⁎⁎⁎ | 18.59±5.71 | 19.21±8.27 | t=0.37 ns | t=2.96⁎⁎ | t=6.49⁎⁎⁎ |
| Litter cover (%) | 92.60±12.26 | 55.83±24.38 | t=6.15⁎⁎⁎ | 72.36±38.74 | 22.95±11.61 | t=5.81⁎⁎⁎ | t=3.46⁎⁎⁎ | t=4.78⁎⁎⁎ |
⁎⁎
⁎⁎⁎
In the dry forest (plot N-5), I recorded a significant difference in the canopy cover and in the density of understorey vegetation (greater during the rainy season). I recorded no difference in the litter depth, but litter cover was greater during the rainy season (Table 1).
Between the two plots, I recorded a significant difference for the canopy height (greater in the gallery forest). During the rainy season, no difference was recorded for the canopy cover, but this characteristic habitat was modified during the dry season, with a greater canopy cover in the gallery forest (Table 1). Density of the understorey vegetation was more important in the gallery forest than in the dry forest during the rainy season, but no difference was recorded during the dry season (Table 1). I did not record any difference for the number of lianas between the two pots, but there were more stems in the gallery forest. Litter structure (depth and cover) differed between the two plots and during the two seasons (Table 1).
3.2 Seasonal foraging ecology of Coquerel's Coua
In the gallery forest (plot CS-6), no difference was recorded in the percent of prey captured by climbing and in the height reached by climbing. In addition, the proportion of prey size and the attack rate did not vary between seasons (Table 2 and Fig. 2).
Seasonal effects on the foraging strategies used by Coquerel's Coua in the two plots
| Foraging variables | CS-6 | N-5 | ||||
| Rainy season | Dry season | Result | Rainy season | Dry season | Result | |
| % of climbing | 8.6 | 12.3 |
|
9.13 | 7.55 |
|
| Height of capture | 1.82±1.43 | 2.25±1.70 | U=89 ns | 2.08±1.41 | 2.22±1.77 | U=136.5 ns |
| Prey size | See Fig. 2 | See Fig. 2 |
|
See Fig. 2 | See Fig. 2 |
|
| Rate of capture | 0.228±0.074 | 0.271±0.131 | U=165 ns | 0.205±0.097 | 0.250±0.099 | U=154⁎⁎ |
| Techniques | ||||||
| Glean | 0.794±0.205 | 0.883±0.110 | F=32.33⁎⁎⁎ | 0.883±0.133 | 0.803±0.117 | F=11.11⁎⁎ |
| Leap + Sally | 0.089±0.060 | 0.019±0.026 | F=59.05⁎⁎⁎ | 0.081±0.096 | 0.082±0.079 | F=0.001 ns |
| Lunge | 0.087±0.208 | 0.042±0.050 | F=2.36 ns | 0.011±0.025 | 0.020±0.037 | F=2.05 ns |
| Probe | 0.031±0.059 | 0.020±0.031 | F=1.27 ns | 0.025±0.056 | 0.090±0.071 | F=27.6⁎⁎⁎ |
| Other | 0 | 0.036±0.089 | not calculated | 0 | 0.005±0.018 | not calculated |
| Substrates | ||||||
| Ground | 0.632±0.171 | 0.735±0.153 | F=10.59⁎ | 0.617±0.184 | 0.643±0.159 | F=0.615 ns |
| Foliage | 0.280±0.105 | 0.178±0.155 | F=13.31⁎⁎⁎ | 0.321±0.102 | 0.328±0.097 | F=2.27 ns |
| Trunk | 0.062±0.077 | 0.083±0.090 | F=1.70 ns | 0.061±0.138 | 0.026±0.037 | F=3.48 ns |
| Other | 0.027±0.053 | 0.004±0.014 | not calculated | 0 | 0.003±0.012 | not calculated |
⁎
⁎⁎
⁎⁎⁎
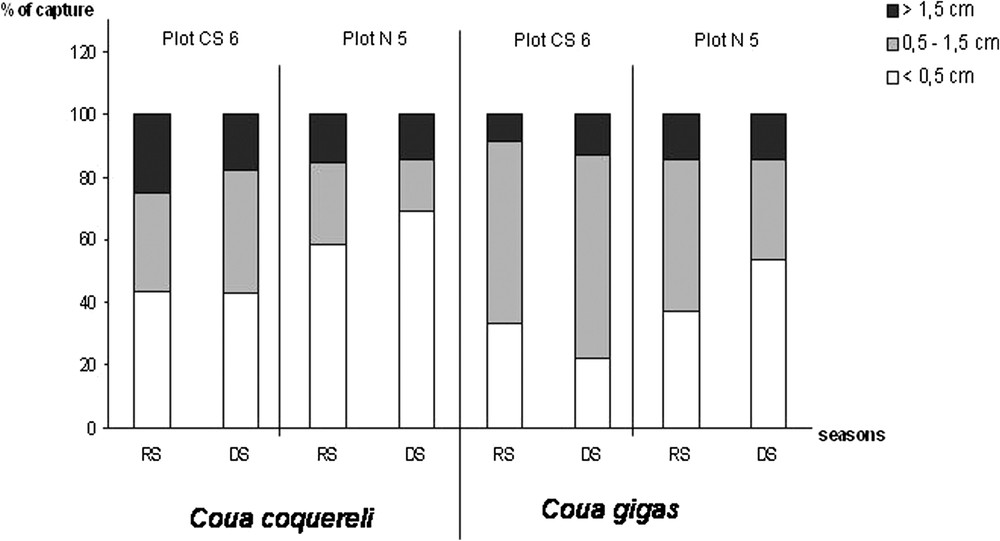
Size of the prey captured by each coua species, in the two forest plots during the rainy season (noted RS) and during the dry season (noted DS).
A difference was recorded between the two seasons for the techniques used (
In plot N-5, no difference was recorded in the percent of prey captured by climbing and in the height reached by climbing (Table 2). The proportion of prey size varied between seasons with more small prey captured during the rainy season (Fig. 2). The attack rate varied between seasons with more prey captured during the dry season (Table 2). A difference was recorded between the two seasons for the techniques used (
3.3 Seasonal foraging ecology of Giant Coua
In the gallery forest (plot CS-6), Giant Coua did not capture any prey by climbing. The proportion of prey size did not vary between seasons, but the attack rate was significantly greater during the dry season (Table 3 and Fig. 2).
Seasonal effects on the foraging strategies used by the Giant Coua in the two forest plots
| Foraging variables | CS-6 | N-5 | ||||
| Rainy season | Dry season | Result | Rainy season | Dry season | Result | |
| % of climbing | 0 | 0 | not calculated | 0.313±0.203 | 0.319±0.153 |
|
| Height of capture | 0 | 0 | not calculated | 2.28±2.70 | 0.97±0.49 | U=131.5 ns |
| Prey size | See Fig. 2 | See Fig. 2 |
|
See Fig. 2 | See Fig. 2 |
|
| Rate of capture | 0.42±0.19 | 0.456±0.110 | U=179⁎ | 0.313±0.203 | 0.319±0.153 | U=332 ns |
| Techniques | ||||||
| Glean | 0.838±0.073 | 0.944±0.079 | 50.22⁎⁎⁎ | 0.836±0.115 | 0.714±0.103 | 26.85⁎⁎⁎ |
| Leap + Sally | 0.088±0.086 | 0.028±0.043 | 17.38⁎⁎⁎ | 0.087±0.094 | 0.088±0.082 | 34.76⁎⁎⁎ |
| Lunge | 0.030±0.040 | 0.019±0.048 | 1.74 ns | 0.048±0.060 | 0.063±0.058 | 1.46 ns |
| Probe | 0.013±0.029 | 0.009±0.033 | 0.53 ns | 0.022±0.045 | 0.080±0.081 | 18.05⁎⁎⁎ |
| Other | 0.031±0.05 | 0 | not calculated | 0.008±0.025 | 0.055±0.066 | not calculated |
| Substrates | ||||||
| Ground | 0.817±0.065 | 0.716±0.084 | 48.26⁎⁎⁎ | 0.654±0.206 | 0.634±0.149 | 0.26 ns |
| Foliage | 0.133±0.028 | 0.204±0.066 | 60.20⁎⁎⁎ | 0.293±0.197 | 0.284±0.169 | 0.051 ns |
| Trunk | 0.043±0.047 | 0.080±0.044 | 17.46⁎⁎⁎ | 0.034±0.048 | 0.057±0.054 | 4.17 ns |
| Other | 0.002±0.005 | 0 | not calculated | 0.006±0.024 | 0 | not calculated |
⁎
⁎⁎⁎
A difference was recorded between the two seasons for the techniques used (
In plot N-5, no difference was recorded in the percent of prey captured by climbing and in the height reached by climbing (Table 3). The proportion of prey size varied between seasons with more small prey captured during the dry season (Fig. 2). The attack rate did not vary between seasons (Table 3). A difference was recorded between the two seasons for the techniques used (
3.4 Comparison between plots for Coquerel's Coua
For Coquerel's Coua, there was no difference between the two plots for the proportion of prey captured by climbing and the attack rate during the rainy season (Table 4). The prey size varied between the two plots, with more small prey captured in plot N-5 (Fig. 2). Techniques used between the two plots differed (
Seasonal effects on the foraging strategies used by the two coua species in the two forest plots
| Foraging variables | Coua coquereli | Coua gigas | ||
| Rainy season | Dry season | Rainy season | Dry season | |
| % of climbing |
|
|
not calculated | not calculated |
| Height of capture |
|
|
not calculated | not calculated |
| Prey size |
|
|
|
|
| Rate of capture |
|
|
|
|
| Techniques | ||||
| Glean | 28.97⁎⁎⁎ | 13.57⁎⁎⁎ | 0.021 ns | 130.97⁎⁎⁎ |
| Leap + Sally | 0.25 ns | 29.51⁎⁎⁎ | 0.001 ns | 17.27⁎⁎⁎ |
| Lunge | 6.76⁎ | 6.77⁎ | 2.26 ns | 14.09⁎⁎⁎ |
| Probe | 0.25 ns | 43.24⁎⁎⁎ | 1.38 ns | 28.12⁎⁎⁎ |
| Substrates | ||||
| Ground | 0.177 ns | 9.18⁎⁎ | 36.19⁎⁎⁎ | 9.67⁎⁎ |
| Foliage | 2.177 ns | 29.38⁎⁎⁎ | 42.68⁎⁎⁎ | 8.23⁎⁎ |
| Trunk | 0.0005 ns | 19.28⁎⁎⁎ | 0.835 ns | 4.71⁎ |
⁎
⁎⁎
⁎⁎⁎
During the dry season, there was a difference between the two plots for the proportion of prey captured by climbing with more prey captured by climbing in plot CS-6 (Table 4). The prey size varied between the two plots, with more small prey captured in plot N-5. Techniques used between the two plots differed (
3.5 Comparison between plots for Giant Coua
During the rainy season, Giant Coua did not capture prey by climbing in plot CS-6 (see Table 2). The prey size did not vary between the two plots. The attack rate was significantly greater in plot CS-6 (Table 4). Techniques used did not differed between the two plots (
For this species, during the dry season, there was a significant difference between the two plots for the rate of captures, which was greater in plot CS-6 (Table 4). The prey size varied between the two plots, with more medium-size prey captured in plot CS-6 (Fig. 2). Techniques used differed (
3.6 Nature of prey
Coquerel's Coua captured an important part of caterpillars in both plots during the two seasons. Seeds were more consumed in plot N-5, compared to plot CS-6 (Fig. 3). These unidentified black seeds were small (<0.5 cm) and were not found in plot CS-6. In both plots, orthopteras represented an important part of diet only during the rainy season (Fig. 3).
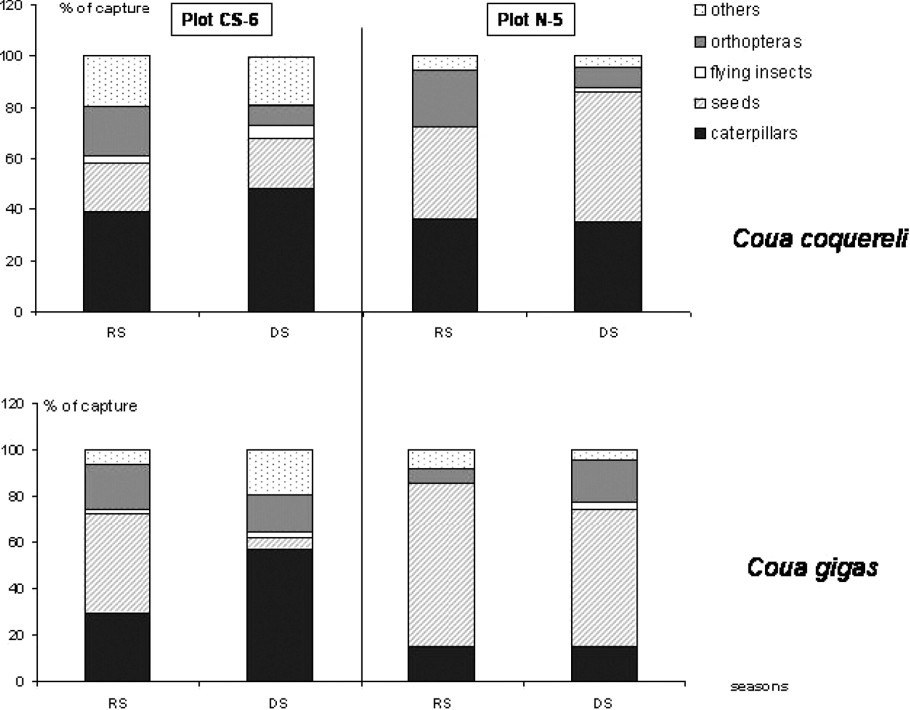
Nature of prey captured by each coua species in the two forest plots, during the rainy season (noted RS) and during the dry season (noted DS).
For Giant Coua, caterpillars represented an important part of the diet only into plot CS-6 (Fig. 3). This species ate also many seeds (Capurodendron madagascariensis and Buxus madagascariensis) during the rainy season and near the river. These seeds were important in size (between 0.5 and 1.5 cm) and were not eaten by Coquerel's Coua. In plot N-5, Giant Coua ate an important part of seeds (Euphorbiaceae), which were not found in plot CS-6. Other prey captured by Giant Coua, but not by Coquerel's Coua, included snails and some small vertebrates as chameleons (Furcifer sp.). Ants were not consumed by the two species, although I saw often the birds foraging along anthills.
4 Discussion
4.1 Habitat structure
The Kirindy River played an important role on the vegetation structure. Vegetation was tallest near the river on humid soils, where trees can reach a height of 25 m. Forest along the river was a gallery forest, while the forest far from the river (>1 km) was rarely more than 15 m high, with a denser understorey and more deciduous plants [19].
Vegetation nature differed also between the two plots, due to the nature of the soil and the humidity [19,30]: some plants were recorded in a plot, but not recorded in the other, although the distance was only 3 km. This difference could play an important role for the distribution of strictly granivorous animal. However, couas incorporated an important quantity of seeds in their diet.
The deciduous plants contributed to the litter structure. If the dead leaves fall on the ground after the rainy season, they contributed to increase the litter depth. If they were large, they increased the litter cover [16,30]. These characteristics were important to consider, because they determine the potential prey living into the litter.
4.2 Influence of habitat structure
By comparing the foraging behaviour of each species, during the same season and between the two plots, I obtained a significant variation in the substrates and techniques used, in the attack rate (evaluating the prey availability) and the ability to climb into the understorey vegetation. The different sizes and nature of prey suggested a variation of arthropods composition into the diet, according to the season. The fact that a same species exhibited a different foraging strategy in the two plots differing by habitat structure (due to the proximity of the river) indicated the importance played by the vegetation structure on the foraging ecology of these species. The two plots harboured different plant species [19] and this fact could indicate a difference in arthropods availability, but no further conclusion can be drawn, because I did not make an inventory of the potential prey into the two plots.
Foraging behaviour for the insectivorous forest birds can also be influenced by the microhabitat selection. Coquerel's Coua avoided using the same microhabitats used by Giant Coua. I recorded this species foraging in microhabitats with dense understorey vegetation, but it avoided some large places of unlogged gallery forest, where Giant Coua was often encountered [14]. These places were characterized by their lack of dense shrub layers. Logging increased the number of potential microhabitats used to forage by the Coquerel's Coua, but reduced those used by Giant Coua [31]. These results allow us to understand the densities of each species recorded in the two plots and during the rainy season [23]. However, microhabitat selection would have to be more explored, for a better understanding of the effects of vegetation structure on these birds.
4.3 Influence of seasonal variation
Some studies on tropical birds indicated few changes in foraging behaviour from season to season [32]. I observed significant differences in the foraging strategies for each coua species during the seasonal transition, indicating that they play an important role in foraging behaviour. An increase of arthropod abundance during the rainy months seems to be a common pattern in tropical dry forest [9,33,34]. Arthropods availability (defined as abundance, detectability and accessibility) at each season could be the cause of the observed difference in the foraging strategies. Seasonal transitions could implicate a difference in food availability, with the dry season corresponding to the expected period of lowest invertebrate availability.
Martin and Karr [13] suggested that the changes in the foraging tactics, with pattern towards more-costly capture techniques, reflected the periods of demanding environmental conditions and food limitation. Increased use of energetically costly techniques, as lunge and probe, during the dry season, may indicate greater food limitation. However, tropical dry forests harbour probably always many prey, whatever the season (not as in a temperate forest). Lunge could be also used during the rainy season, when litter prey escaped quickly.
According to Hawkins's results [35], there is a seasonal variation in the composition of arthropods. Spiders and cockroaches were more abundant during the dry season, but orthopteras, caterpillars, coleopteras and dermapteras were more abundant during the rainy season. Ecology of these arthropods can explain the shifts in techniques used, because spiders and cockroaches are usually hidden under dead leaves (needing to use probe), when orthopteras and caterpillars stay on the surface of the litter or the green leaves (needing to use glean).
Season had probably to be considered as an important factor for food availability in the foraging studies, and it would be necessary not to pool all the observations if the aim of the study is to analyse the foraging behaviour.
4.4 Difference between species
Coquerel's Coua and Giant Coua were similar in morphology, but differed in size, with Giant Coua being significantly bigger than Coquerel's Coua. If morphology was linked to the techniques used, as suggested by Martin and Karr [13], the two species in Kirindy would have to use the same pattern of techniques. My results support this hypothesis, because they used the same patterns of techniques, although they differed by the proportions used, with gleaning as the main technique. However, I recorded that the two species used the same techniques with the same proportions, during the rainy season (glean more used) and during the dry season (probe more used) in plot CS-6. The inversed fact was recorded into plot N-5, with glean more used during the dry season, and probing more used during the rainy season.
The two species tended to use the same main substrates too (ground and leaves). They differed also by the proportions used, the ability to climb in the upper vegetation layers and by the size and the nature of prey. Giant Coua and Coquerel's Coua are probably closely related and well adapted to a forested environment.
Coquerel's Coua is more agile to exploit efficiently the prey in the foliage than Giant Coua, particularly near the river. Such preys were usually caterpillars, which live on leaves during all the rainy season and sometimes as soon as the end of the dry season [36].
Giant Coua captured larger prey than Coquerel's Coua, including snails and small vertebrates (Chameleons Furcifer sp.), and ate more vegetal matter, especially in plot N-5. The consumption of seeds by this species could also explain the greater attack rate observed: Giant Coua tended to revisit the same place several times (personal observation). The dry forest (plot N-5) may be lower-quality habitat for this species, providing probably a more-difficult foraging environment during the dry season. Seeds may also be suboptimal food items for predominantly insectivorous species like giant Coua.
At the species level, the dominant species, with larger size, could be obliged to forage at a higher rate than the subordinate. Some portions of habitat gradients may therefore be not productive enough to support the dominant species, but may be productive enough for the subordinate species, conducting to an interspecific segregation [37]. I observed no interspecific territoriality in Kirindy in the two logged plots. My results suggest that even logged forests allow the individuals of each species to have territories rich enough for an efficient foraging.
4.5 Application for conservation
Because of their wide repartition, and their different foraging strategies, Coquerel's Coua and Giant Coua are potentially good indicators of the habitat change. The seasonal changes in foraging behaviour associated with the influence of habitat structure suggest the importance of maintaining a diversity of habitats within an area. This can help to maintain these ecologically similar species. Disturbance, by fire or logging, could modify the optimal exploitation, and contribute to threaten these species. Studies of how these disturbances modify their foraging behaviour can provide some information for the management of the western dry forest in Madagascar, and indicate which species would be the most threatened by forest disturbance. It would be necessary to retain a diversity of foraging substrates in different habitat types, to sustain the normal foraging activities of these birds. In this sense, studying the foraging of couas species can be used for forest conservation.
Acknowledgements
I thank the ‘Commission tripartite’ of the Malagasy Government, the ‘ministère pour la Production animale et des Eaux et Forêts’ for the permission to work in Madagascar. The staff of WWF and Steven M. Goodman provided logistic support and very pleasant hospitality in Antananarivo. Olivier Langrand initiated the study and advised on the methods. Jean-Marc Thiollay made some comments on the first version of the manuscript. I thank the ‘Deutsch PrimatenZentrum’ (DPZ) of Göttingen, especially Jorg Ganzhorn and Peter Kappeler, for the permission to use their station in the Kirindy forest and to take advantage of the logistic; the ‘Centre de formation professionnelle en foresterie’ in Morondava, to facilitate the access to the Kirindy concession. I thank all the people from the Kirindy forest, the German students, and the Malagasy people to have facilitated my accommodation during the stay in the forest. Émilien Marc provided some data during my absence. Chris Birkinshaw (Missouri Botanical Garden) and Fidy Ranaivo (student at DPZ) helped for seed identifications.