

1 Introduction
The spatial structure of genetic variation is an important aspect of evolutionary and ecological processes. Since spatial patterns can result from various processes, May [1] has stated that spatial structure due to environmental heterogeneity needs to be discriminated from that which is self-organized by spatio-temporal non-linearities within a homogeneous environment. On these lines, the integration of spatial heterogeneity in population biology and landscape ecology has led to the emergence of landscape genetics. This multidisciplinary approach focuses on the interactions between landscape features and gene flow, and on the genetic base of microevolutionary processes as well [2,3]. Connectivity is a particular topic which has given rise to many debates. We have defined connectivity as the degree to which the landscape facilitates gene flow among habitat patches, via the spatial contiguity between habitats and the responses of organisms to the landscape in terms of their movements [4–6]. Connectedness (i.e. the degree of spatial contiguity between habitats) is therefore assumed to be a key factor contributing to connectivity. Ambiguously, this second concept is close to “landscape connectivity” sensu [7], defined as the “physical linkage of areas of native vegetation cover within a landscape”. Species assemblage studies [8–13] have suggested that connected corridor networks (such as hedgerow networks) enhance dispersal, especially for plant species in wooded habitats (e.g. forest edges and hedgerows). However, the corridor concept is still in debate when considering processes occurring at population level [14,15]. Hedgerow network connectedness thus provides a unique opportunity for investigating the potential contributions of linear features to landscape connectivity [16]. The effects of hedgerow network structure have been studied in detail in animal models [17] and to a lesser extent in plant species [8–10,12,18–20]. The latter studies focused on plant species distribution, and to our knowledge, the effects of hedgerow network structure on dynamic plant population processes have been rarely studied in terms of the spatial genetic structure.
In a recent work [21] we have examined how variation in pollen and seed dispersals, and mating performances, of the distylous Primula vulgaris were correlated to spatial structure of a hedgerow network landscape, covering an area of 28 km2 in the Southern French Alps. Our results suggested that a dense hedgerow network does not necessarily ensure connectivity in Primula vulgaris in terms of gene flow. These results and previous studies on Primula species [22,23] provided evidence for considering landscape structure in the microevolutionary processes.
In this study, we investigated a complementary genetic aspect, i.e. the correlations between connectedness and connectivity based on multilocus genotype data. According to general agreements on the role of landscape physical linkage on gene flow, it could be thought that greater habitat contiguity should result in an increase of gene flow rates, followed by a decrease in genetic differentiation and a less pronounced pattern of isolation by distance. However, our previous results [21] support the contrary: we thus hypothesized that the increase of habitat contiguity caused gene flow restriction. Our objective is therefore to examine this hypothesis by analyzing the correlations between spatial genetic structure and hedgerow network heterogeneity.
2 Material and methods
2.1 Plant species
Primula vulgaris Huds. (Primulaceae) is a small, long-lived (10–30 years), herbaceous diploid perennial with a North-Atlantic and Mediterranean distribution [24]. In the Champsaur valley, P. vulgaris is mainly confined to hedgerows and forest edges. The flowers, which are pale yellow and borne on separate stalks, emerge/bloom in early spring (March to May at our site). Like most other species in the genus Primula, P. vulgaris has a genetically based, self-incompatible (distylous) breeding system [25]. The main pollinator of P. vulgaris in the study area is Bombylius sp. (Diptera) [21]. The seeds have an elaiosome attracting ants and occasionally small mammals [26].
2.2 Study sites
The Champsaur Valley is an upland valley (average altitude of 1000 m) located in the South of the French Alps (longitude: 3°46′26.13; latitude: 44°39′52.68, in South–East France). The study area is composed of a hedgerow network (bocage) dominated by Fraxinus excelsior. In line with [27] and [28], a geographic grid composed of 128 cells, one cell measuring 500 by 500 m, was drawn up and two variables were computed in each grid cell: (1) total hedgerow length, and (2) the “mean total hedgerow length” of the 8 adjacent cells. A k-means procedure was used to determine two classes of hedgerow network structure (using R software): dense and sparse. The results showed a pronounced aggregation of variable values and the existence of a sharp contrast between a densely structured hedgerow networks in the North and a sparser one in the South (Fig. 1). Both types of clusters differed greatly (; homogeneous variances) in terms of total hedgerow length within geographic cells (mean value of North cluster = 119 m per ha, mean value of South cluster = 50 m per ha).
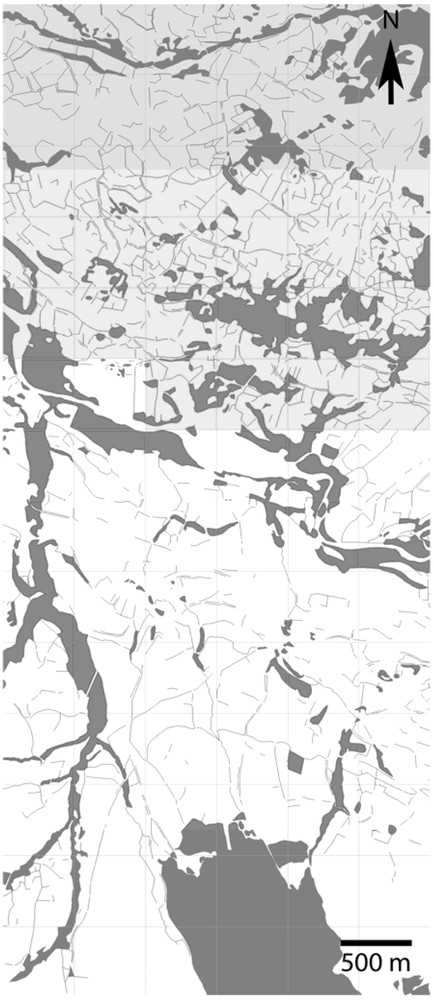
Map of geographic cell clusters based on a k-means procedure. Grey cells correspond to high hedgerow density and white cells to low hedgerow density.
This hedgerow network is therefore dense in the North and sparse in the South (Fig. 1). This North–South (Dense–Sparse) gradient has existed for a long time, because a compilation of old maps (“Cadastre Napoléonien”; 1837) under GIS showed the existence of the same pattern of hedgerow networks.
2.3 Sampling strategy
Since P. vulgaris is mostly restricted to the hedgerows in the study area, sampling was systematically performed along hedgerows in two sampling areas located in each class of hedgerow network structure (dense and sparse). Apart from some occasional clumps of individuals, P. vulgaris distribution is mostly continuous. Hence there are no clear spatial boundaries within the population. Two leaves were collected per individual and the samples were separated by a minimum distance of 60 m along the hedgerow network. A total number of 241 individuals were sampled, 87 and 81 individuals were collected in the dense and sparse sampling areas, respectively. To complete this systematic sampling with more distant individuals, 73 individuals were sampled in randomly selected hedgerows. Since most of the potential habitat of P. vulgaris was investigated, no artificial hiatuses exist in our sampling scheme.
2.4 AFLP markers
Each individual was fingerprinted using two pairs of selective amplification primers. More than forty polymorphic markers were thus generated, which is the minimum threshold for resolution of genetic structure at fine spatial scales [29].
Total DNA isolation from 40 mg of silica gel dried leaves was performed manually using a 2% CTAB protocol from [30] with modifications: samples were ground in liquid nitrogen and the powder was mixed with 2% CTAB extraction buffer (1.4 mM NaCl, 20 mM EDTA, 100 M Tris-HCl pH 8 and 2% of hexadecyltrimethylammonium bromide). Samples were then incubated at 65 °C for one hour and 250 ml of 24:1 chloroform:isoamyl alcohol was then added. After mixing and microcentrifugation, the supernatant was transferred to an equal volume of a 0.6 M sodium acetate ethyl alcohol solution and precipitated at overnight. After undergoing microcentrifugation, the genomic DNA pellet was washed with 70% ethyl alcohol, and then resuspended in pure H2O. DNA concentration and quality were assessed using ethidium bromide staining methods on a 0.8% agarose gel. The AFLP reaction was performed as described by [31] with slight modifications: 300 to 1000 ng of DNA were digested for 3 h at 37 °C with 6 units of EcoRI (MBI Fermentas) and for 3 h at 65 °C with 4 units of Tru9I (MBI Fermentas) in a total volume of 25 μL. Digestion products were then ligated for 8 h at room temperature by adding 2.5 pmol EcoRI and 25 pmol MseI adaptators, 0.5 units T4 DNA ligase and 10 mM ATP (MBI Fermentas). Five microliters of 8X diluted ligation products were used as a template for preamplification purposes, using 10 pmol of EcoRI and MseI primers, 0.16 mM dNTPs, 0.65 mM MgCl2 and 1.5 units of Taq DNA polymerase (Q-Biogen) in a final volume of 50 μL. The preamplification thermocycle profile was 94 °C for 2 min, followed by 20 cycles at 94 °C for 45 s, 56 °C for 45 s, 72 °C for 1 min and 72 °C for 10 min. Lastly, selective amplification procedures were performed using 5 pmol EcoRI and MseI primers with 5 μL of 100X diluted preamplification product in a final volume of 20 μL. Each selective amplification reaction mixture contained 0.5 mM dNTPs, 0.65 mM MgCl2 and 1 unit of Taq DNA polymerase (Q-Biogen). The selective amplification thermocycle profile was: 94 °C for 2 min, followed by 10 cycles at 94 °C for 30 s, 65 °C for 30 s (step per cycle), 72 °C for 1 min, and then 20 cycles at 94 °C for 30 s, 56 °C for 30 s, 72 °C for 1 min and 72 °C for 5 min (thermocycler: PTC-200, MJ Research). After an initial screening of selective primers, two primer combinations giving clear band profiles were chosen for further analysis (EcoRI-AAC with MseI-CAA and EcoRI-ACA with MseI-CAT). Lastly, electrophoresis was performed on high resolution 4% polyacrylamide gels (Sequi-Gen® GT System Biorad) that were silver-stained using the procedure described by [32].
The presence/absence of bands on the gel was scored manually and marked directly on the gel. 72 samples were amplified a second time from the ligation products and 10 individuals were completely recycled/re-tested to check the AFLP profiles. Only clear, unambiguous bands/loci were selected for analysis.
2.5 Data analysis
AFLP polymorphism characterization and 1-D spatial autocorrelation analysis were performed using the GenAlEx 6 software program [33]. All other spatial analyses of AFLP polymorphism were conducted using the open source R environment for statistical analysis [34] and the ADE4 package [35]. Except for those used in the AMOVA, pairwise genetic distances were calculated as described by [36]. In line with the latter authors, similarity was calculated as 1 divided by “genetic distance +1”. Spatial genetic structure corresponding to isolation by distance was tested by computing r, a 1-D spatial autocorrelation coefficient which corresponds to a multivariate extension of Moran's I index [33]. Autocorrelation coefficients (r) were tested using a boot-strap procedure (999 iterations). Partial Mantel tests were used to describe correlations between genetic distances [36] and hedgerow network distances (explicative variable) independently from the Euclidian distances (covariable). Effective distances along the hedgerows based on the least cost path algorithm were computed with PATHMATRIX [37]. In each distance class defined, Mantel R significance was tested by calculating the Monte Carlo permutations (999 permutations).
To analyze variations of genetic structure over space, two multi-scale analyses were performed. Both were based on circular buffer zones consisting of different distance classes (100–1000 m, with a 100 m interval) centered on individuals. For a given individual, each buffer zone delimited its neighborhood at different scales (buffer zone radius). In the first analysis, the mean multilocus genetic similarity (previously defined) of individuals within their neighborhood were computed in each buffer zone. For each individual, the significance of the mean multilocus genetic similarity was tested by randomizing the individual distributions . The second analysis consisted of calculating the between-component of the AMOVA (Analysis of Molecular Variance [38]) in each individual-centered buffer zone, i.e. all individuals in the buffer zone were compared to all those not present in the buffer zone. The was adopted as an index of local differentiation, since it can be used to detect local singularities in a landscape pattern. Only buffer zones containing at least 5 individuals were included in these analyses. In order to represent the results of both multi-scale analysis, two local 2-D maps were drawn up. In each 400-m radius buffer zone, significant (i.e. tested with 999 permutations) mean multilocus genetic similarities and differentiation were plotted separately using geographic coordinates.
The spatial genetic structures of the two classes of hedgerow networks defined above (k-means procedure: Fig. 1) were compared. The 1-D spatial autocorrelation r (GenAlEx 6 software) was computed separately in each of these two clusters of geographic cells (and tested using bootstrap methods: 999 iterations). Partial Mantel tests (as mentioned above) were also carried out between overall distance matrices, i.e. genetic distance (dependent variable), network distance (explicative variable), and Euclidian distance (the covariable), and tested with 999 Monte-Carlo permutations. Randomization tests were undertaken to test the differences between the means and variance of both genetic similarity and differentiation findings (as described above) at the 400-m distance class . These last analyses were performed by adapting functions of the ADE4 software package.
3 Results
3.1 Spatial genetic structure
The two primer combinations showed the existence of 145 clearly visible and reproducible fragments in P. vulgaris, 93 of which were polymorphic out of the entire set of 241 samples. The length of the AFLP products ranged between 80 and 960 bp, with an average of 95.4 fragments per individual. All individuals had different AFLP genotypes differing by one to fifty-five bands.
Overall, the relationship between inter-individual genetic variation and distance was given by the spatial autocorrelation analysis (Fig. 2a). The distance class size of 60 m corresponds to the minimal lag between samples. The analysis of the entire population yielded significantly positive r values (, boot-strap procedure, 999 iterations) up to the 480 m distance class (Fig. 2a). The significant r values decreased from 0.153 to 0.025 giving an inversed logarithmic curve and reached a plateau at approximately 300 m. Genetic similarity is therefore greater within the 300-m class, and the fact that the curve obtained showed no marked oscillations reflected a strong, regular pattern of isolation by distance. Partial Mantel tests (Fig. 2b) yielded significant correlations between genetic distance and Euclidian distance from the 0–240 up to the 0–840 m classes, reaching maximum correlations in the 0–600 m distance class. By contrast, significant correlations between genetic distance and network distance weighted by Euclidian distance as a covariable were observed only in the 3 largest distance classes, i.e. in the 0–600-m to 840-m distance class. values were negative, reflecting a negative relationship between genetic distance and network distance, only in the case of the large distance classes .
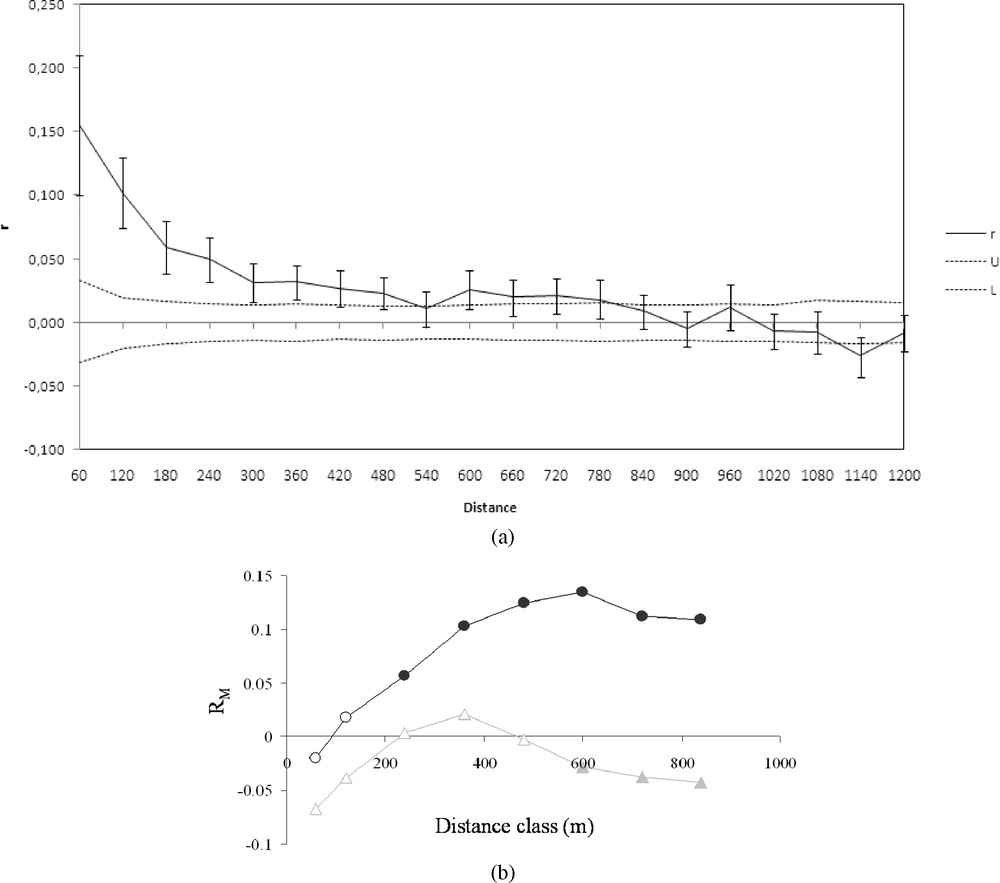
(a) Correlogram plot of the genetic autocorrelation coefficient (r) as a function of distance. U and L lines correspond to bootstrapped 95% confidence intervals (999 iterations). (b) Partial Mantelogram of the correlation between genetic distance, Euclidian distance (covariable) and network distance. Dark circles correspond to values between genetic distance and Euclidian distance; grey triangles: values between genetic distance and network distance with Euclidian distance as a covariable. Filled symbols correspond to significant correlations (p < 0.05).
3.2 Landscape effects on spatial genetic structure
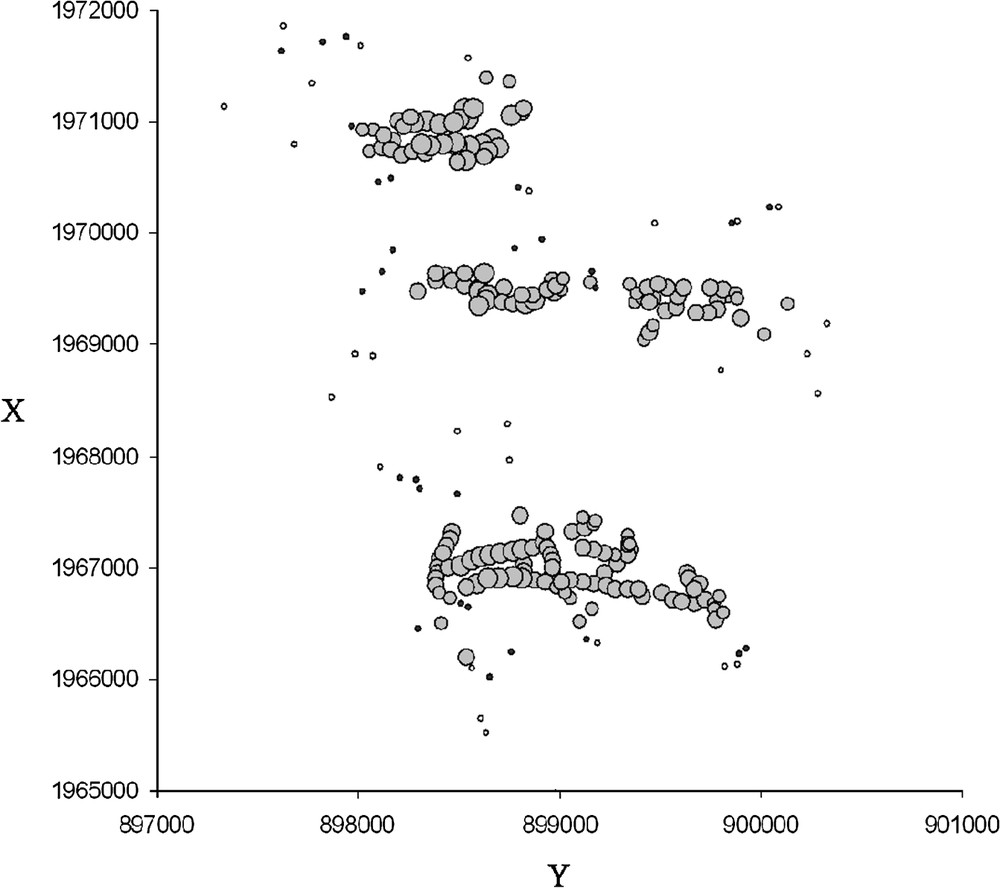
Local 2-D diagrams showed that multilocus genetic similarity and differentiation are differentially sensitive to landscape pattern. In the spatial autocorrelation tests, we chose the 400-m distance as the most suitable distance class corresponding to local neighborhood size. Local 2-D diagrams of mean similarity (Fig. 3) showed that in 400-m buffer zones, the majority of individuals were significantly more similar to their neighbors than to the other individuals. Variations in the magnitude of the mean similarity generally showed a North–South gradient. The southern part of the study area showed both less similar neighborhoods (small circles) and a larger number of non-significant values. No such striking geographical pattern was observed in the case of the differentiation index (Fig. 4). However, the were more homogeneous and lower in the Southern part. This pattern was confirmed by performing complementary exploratory analyses of differentiation value distributions.

2-D representation of mean similarity around samples under 400 m (individual-centered buffer zones). Grey circles correspond to significant mean similarities of neighborhoods (under 400 m); black points correspond to non-significant values; circle sizes are proportional to mean similarity within buffer zones; white points indicate individuals not integrated in the analysis (less than 5 neighbors under 400 m). X and Y coordinates are given in meters (Lambert II Carto; Paris).
2-D representation of differentiation rates of individual-centered buffer zones (radius = 400 m). Grey circles correspond to significant values (under 400 m); black points correspond to non-significant values; circle sizes are proportional to differentiation rate; white points indicate individuals not integrated in the analysis (less than 5 neighbors under 400 m). X and Y coordinates are given in meters (Lambert II Carto; Paris).
We repeated these spatial analyses of genetic structure on the Dense and Sparse clusters separately. The one-dimensional spatial autocorrelograms obtained on each landscape type clearly showed the existence of two distinct spatial patterns (Fig. 5). Apart from the regular decrease in the autocorrelation coefficients mentioned above (Fig. 2a), the autocorrelation values obtained were higher on the whole (except for the lowest distance class, 60 m) in the Northern cluster than in the Southern cluster in the case of the following distance classes: 120 m; 180 m; 240 m; 320 m (Fig. 5a); and 180 m; 360 m; 540 m; 720 m (Fig. 5b). Randomization tests showed that the mean genetic distance at distances of less than 400 m was greater in the Northern cluster (; homogeneous variances ). The mean and variance of the differentiation index ( with a distance class of 400 m) were lower in the sparse landscape ( and , respectively), which confirms the findings obtained in the local 2-D maps. These differences in multilocus similarity and distributions were verified to be robust at different scales (100–1000 m, with a 100 m interval).
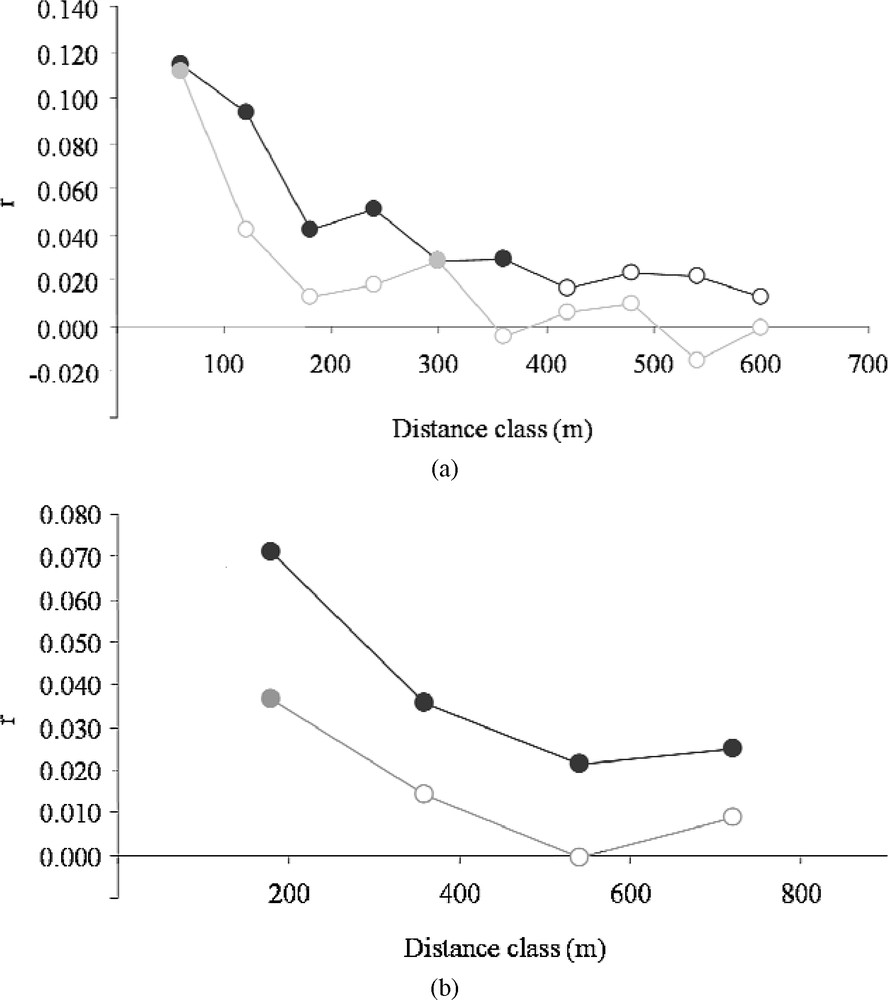
Correlogram plot of the genetic autocorrelation coefficient (r) as a function of distance for two types of distance classes: 60 m intervals (a) and 180 m intervals (b). Dark and grey circles correspond to clusters of Dense and Sparse hedgerow densities, respectively. Filled points correspond to significant correlations (p < 0.05) tested by a bootstrap procedure (999 iterations).
Mantel tests ( coefficients) also showed contrasting patterns. In the dense landscape, with Euclidian distances and with network distances weighted by the Euclidian distance as a covariable. In the sparse landscape, with Euclidian distances (as the covariable) and with network distances.
4 Discussion
Primula vulgaris genotypes were organized in space and showed a significant and regular pattern of isolation by distance (Fig. 2). The existence of genetic structures and their scale of organization is a reflection of the spatial pattern of habitat, the dispersal history of populations and gene flow in space and time. First, the establishment of clear spatial genetic structure implies a structural stability of the landscape. Historical documents (the Napoleonian cadastre of 1837 and aerial photographs taken in 1953) attest that differences in hedgerow network density between Northern and Southern clusters already existed in 1837. These differences became more accentuated between 1953 and 2003: initially sparse hedgerow networks were more severely affected by hedgerow removal during the last 50 years than initially dense hedgerow networks (Campagne P, pers. data). Second, the spatial scale at which spatial genetic structure is observed depends on the distance and direction of the seed and pollen dispersal. Our field observations [21] in the same site showed that (1) seed dispersal by ants followed the hedgerows and the maximum seed dispersal distance observed was about 5–10 m, whereas (2) dispersal of pollen analogues (fluorescent powders) occurred up to 450 m. Field observations of gene flow distance and the autocorrelation of AFLP markers support the idea that pollen flow is the main component shaping genetic structure in P. vulgaris. This flow is likely to be isotropic since the Mantel test indicates that distance along the hedgerow network is a less relevant variable than Euclidian distance. In a same fashion, spatial genetic structure of Primula veris [39] is predominantly shaped by pollen flow at fine scales (based on findings at a study site about 2 ha in size). Kitamoto et al. [40] studied Primula sieboldii at a much smaller study site with an area of 0.3 ha and noted shorter pollen flow distances of about 50 m. However, the latter study was performed with paternity analysis, and the authors may have failed to detect any rare long distance pollen flows.
4.1 Landscape effects on genetic connectivity
Landscape effects in Primula populations have been previously described in terms of genetic diversity and inbreeding [22,41–43]. Loss of connectivity can lead to a decrease in genetic diversity [23] and even to bottlenecks [44] at landscape level. In our study, hedgerows were found to impede gene flow [21], which shows that the pollinating agents associated with heterostyly play an important role. Considering that network distances are not pertinent in explaining genetic distances, it might be concluded at this stage that the hedgerow network has little or no effect on genetic structure. Even if the one-dimensional autocorrelations could have been obtained in a neutral landscape assuming only that gene flow was restricted by distance, genetic structure was not homogeneous and revealed variations over space. Surprisingly, the three components of genetic structure (i.e., isolation by distance, similarity, and differentiation) showed clear-cut and consistent patterns of covariation with hedgerow network structure. First, isolation by distance (cf. Mantel tests and correlograms) was greater in the Dense cluster: spatial dependency of AFLP markers was higher. Secondly, genetic similarity was found to be significantly higher in the Dense cluster (Fig. 3 and randomization test). In the Sparse cluster, a large proportion of individuals were not more similar with their neighborhood than with randomly distributed genotypes. Thirdly, apart from the more structured pattern of isolation by distance and lower genetic variation, local differentiation was found to be greater and less homogeneous in the dense hedgerow network (Fig. 4). Based on these three points, it was stated that a lower genetic connectivity existed in the dense hedgerow networks, i.e., in the places where there is higher habitat contiguity. Although if it is likely that hedgerow act as corridor in seed dispersal of P. vulgaris, this is not true in pollen flow. As a resultant connectedness in the hedgerow network leads to a loss a genetic connectivity. This counterintuitive pattern shows how difficult it is to deal with connectivity in plants when the two components of gene flow (seed and pollen) do not necessarily respond to habitat contiguity in the same way. Therefore habitat connectedness, a physical parameter estimated a priori, does not always correspond to connectivity in terms of the ecological processes at work.
4.2 On what “spatial genetic structure” involves
In this study, spatial genetic structure is typically organized at landscape level and revealed some variations over space (e.g., between sites). Local genetic structure is now being demonstrated to depend on fine scale heterogeneity [45] and on landscape features [2,46]. However, pointing out genetic structures (e.g. inbreeding or kinship) does not necessarily imply that these structures are efficient in terms of biological processes (e.g. inbreeding depression). At landscape level, a crucial question is thus to know whether population genetics and population ecology can corroborate each other. In these sites, spatial genetic structure revealed striking correspondence with the population ecology of P. vulgaris [21]. First, contrasts in spatial genetic structure were consistent with contrasts observed in dispersal distances of pollen-analogues. Higher isolation by distance, genetic similarity and differentiation was in place with lower pollen dispersal distances. Dense hedgerow network were found to impede pollen flow via either density-dependent effects or barrier effects of hedgerows. Second, inbreeding depression and advantage to long-distance outbreeding in the reproductive performances of P. vulgaris were in place with the highest genetic similarity and the lowest genetic differentiation, respectively. This agreement supports the idea that microevolutionary processes can occur at fine scale in relation to genetic-shaping effects of space heterogeneity. Third, these experiments pointed out that the self-incompatibility system in P. vulgaris was not strict in our study site. The breakdown of self-incompatibility systems may evolve in the context of geographical isolation or pollinator loss [47–50] and partial self-compatibility might constitute an advantage in the context of gene flow disruption [51]. Recent studies give sense to such considerations. For example it was showed that landscape structure could generate evolutive response in dispersal modalities, in plants [52] and in insects' populations [53]. From this point of view, putting the landscape into landscape genetics [3] gives rise to a key question: in a context of global changes what could be the adaptative abilities of species at fine scale, in relation to space-time heterogeneity?
Acknowledgements
We would like to thank R. Bonet and H. Cortot at the ‘Parc National des Écrins’ for their helpful collaboration; Jessica Blanc and Carey M. Suehs for greatly improving the English in this paper.