

1 Introduction
Since a few years, most molecular phylogenetic studies routinely make use of multiple DNA markers on a large number of species [1–3]. This trend was driven by the development of more efficient experimental techniques in molecular biology (DNA extraction, PCR amplification and sequencing), and by the resulting exponential growth of DNA sequences in databases, such as GenBank/EMBL/DDBJ. This approach has great advantages, as more complete gene and taxon samplings often increase the accuracy in the estimated phylogeny [4,5].
There are two main methods for constructing a phylogenetic tree by using multiple data sets: (1) in the supermatrix approach, all characters of the diverse data sets are combined into a single matrix, and then analyzed simultaneously; this method is also known as “simultaneous”, “combined” or “total evidence” analyses [6]; (2) in the supertree approach, the different data sets are analyzed separately, and then the topologies derived from these analyses are used as “source trees” to construct a “supertree” summarizing the phylogenetic information [7]. A potential effect of these approaches is that hidden phylogenetic signals can be revealed. In other words, novel clades that are not found by separate analyses of the data sets can emerge from the supermatrix and supertree analyses. In addition, clades that are weakly supported by separate analyses can be found with a strong support in the supermatrix analyses, because common phylogenetic signals from different data sets can be added and therefore enhanced. Another potential advantage of both supermatrix and supertree approaches is that other types of characters, such as those of morphology, physiology or behaviour, can be easily incorporated in the analyses [7].
Both supermatrix and supertree methods implicitly assume that all characters have experienced the same branching history. However, this assumption is not always valid, and conflicting phylogenetic signals between data sets may result in robust topological incongruence that can be misleading for understanding the real evolutionary history of taxa. In molecular phylogeny, there are eight main sources of incongruence between DNA markers: (i) errors in phylogenetic reconstruction caused by the use of inappropriate methods or models; (ii) sequencing and alignment errors; (iii) taxonomic misidentification; (iv) DNA contamination by other organisms; (v) endogenous contamination, i.e. paralogous sequences, including pseudogenes; (vi) strong selection pressure, (vii) horizontal transfer events, including introgression; and (viii) incomplete lineage sorting. The two last sources of incongruence can result in real conflicts between gene trees and species trees, whereas all others sources produce apparent conflicts, which are due to errors during the data production process, or misassumptions in the phylogenetic analyses. When the markers bring conflicting phylogenetic signals, the supermatrix and supertree methods can result in different interpretations of the evolutionary history of taxa. The supermatrix approach is expected to be misleading if the species-tree signal is not dominant after combination of the data sets. For instance, the analysis of data originating from a mitochondrial introgression can lead to erroneous phylogenetic conclusions, when the mitochondrial genes contain most of the information in the supermatrix. In such a case, the supertree approach could be more reliable than the supermatrix approach to uncover the true relationships among species. However, its application suffers from two limitations: (1) most methods of supertree construction ignore or misinterpret hidden support in different data sets; and (2) the logical basis of phylogenetic robustness measures in supertree analysis is unclear [8–11].
The most commonly used supertree method, named Matrix Representation with Parsimony (MRP) [12,13], is based on the combined analysis of a set of trees, where the different source trees are used to construct a binary matrix for parsimony analysis, each binary character representing a node of a source tree. Baum [12] first proposed to weight the characters of the MRP matrix using bootstrap percentages of the majority-rule consensus tree. Weighting individual binary characters in proportion to the support for the corresponding groupings in the original analyses is a good way of improving the fit between the binary matrix and the original data [14]. In principle, bootstrap-weighted MRP should arbitrate conflicts among the set of source trees such that the supertree topology is resolved in favor of the most strongly supported source-tree nodes. However, this approach does not allow nodal support in the supertree to be evaluated [15]. More recently, Moore et al. [15] have proposed two additional approaches using nonparametric bootstrapping, in which a set of source trees is compiled by randomly and repeatedly drawing (with replacement) either from the original set of estimated source trees (source-tree bootstrapping) or from their respective bootstrap profiles (hierarchical bootstrapping). Then, a MRP matrix is constructed from this set of source trees, and finally used to estimate the supertree. The procedure is repeated an arbitrary number of times to generate a bootstrap profile of supertrees, which is then summarized by majority-rule consensus. The limitation of these two methods is that only a random population of source trees is used for the analyses.
Here we propose and implement a new approach, named SuperTRI, in which the supertree is constructed by using the branch support values (Bootstrap percentages or posterior probabilities) of all phylogenetic hypotheses produced during the Bootstrap or Bayesian analyses of the independent data sets. The reliability of the nodes is estimated by three different measures: the “Supertree Bootstrap Percentage” (SBP); the mean branch support, which corresponds to the “Mean Posterior Probability” (MPP) for the Bayesian method, or to the “Mean Bootstrap Percentage” (MBP) for Maximum Likelihood (ML) and Maximum Parsimony (MP) methods; and an index of reproducibility (Rep). Our supertree approach is tested by analyzing a data matrix including seven genes for 82 taxa of the family Bovidae (Mammalia, Ruminantia) and the results are compared to those found with the supermatrix approach.
2 Material and methods
2.1 Sampled genes
Seven genes were analyzed for 82 taxa including 79 species and representing all the 52 genera currently recognized in the family Bovidae [16] (see online Appendix 1). Three genes belong to the mitochondrial genome: the complete cytochrome b gene (Cyb), the complete 12S rRNA gene (12S), and the subunit II of the cytochrome c oxydase gene (CO2). The four nuclear markers are unlinked DNA fragments located on different chromosomes in the genome of Bos taurus: the intron 1 of the protein kinase C iota gene (PRKCI) in the chromosome 1 (1q34-q36), the exon 4 of the kappa-casein gene (κCas) in the chromosome 6 (6q32), the intron 1 of the β-spectrin nonerythrocytic 1 gene (SPTBN1) in the chromosome 11, and intron and exon regions of the thyroglobulin gene (TG) in the chromosome 14 (14q13).
2.2 DNA alignment
The nucleotide sequences were aligned manually with Sequence Alignment Editor Version 2.0 alpha 11 [17]. The protein-coding genes (CO2, Cyb and κCas) were aligned using the amino-acid sequences. All regions with ambiguity for the position of the gaps in 12S, PRKCI, SPTBN1 and TG genes were excluded from the analyses to avoid erroneous hypotheses of primary homology. The gap placement was considered unambiguous when only one local sequence alignment was possible due to the conservation of both gap length and nucleotide motifs adjacent to the 5′ and 3′ boundaries of the gap. Unambiguous indels (insertions/deletions) were coded as additional characters by using 1 and 0 symbols for insertion and deletion, respectively [18].
The matrix of 82 taxa was composed of the following genes and characters: 12S: 860 nt and one indel; CO2: 582 nt; Cyb: 1140 nt; κCas: 487 nt and one indel; PRKCI: 487 nt and four indels; SPTBN1: 575 nt and eight indels; and TG: 797 nt and seven indels. The total matrix represents therefore 4949 characters (4928 nucleotides and 21 indels). It is available upon request to the authors.
2.3 Phylogenetic analyses
Four methods of tree reconstruction were used for phylogenetic analyses: Bayesian inference (BI), Maximum Likelihood (ML), and Unweighted and Weighted Maximum Parsimony (UMP and WMP). The genes were analyzed separately or in combination to benefit from the maximum number of molecular characters (supermatrix approach).
Bayesian analyses were performed with Mr.Bayes 3.1.2 [19]. The Bayesian approach evaluates the posterior probability (PP) of a tree, i.e., the probability that the tree is correct given the character matrix. For each gene, MrModeltest 2.2 [20] was used for choosing the model of DNA substitution that best fits the data. Using the Akaike information criterion, the selected models were GTR + I + G for all mitochondrial genes, GTR + G for PRKCI, kCas, and SPTBN1, and HKY + G for TG. Unambiguous indels were analyzed as an additional partition and treated as morphological characters. Separate analyses of the seven genes were run with the model selected by MrModeltest 2.2. Partitioned Bayesian analyses were conducted to account for the combination of markers with contrasted molecular properties: the mitochondrial matrix was run with the GTR + I + G model for each gene; the nuclear matrix was run with the GTR + G model for each gene; and the supermatrix (combining all the seven genes) was run using the selected model for each partition. Unpartitioned Bayesian analyses were also performed using a GTR + I + G model for the whole matrix. All analyses were conducted with five independent Markov chains run for 2 000 000 Metropolis-coupled MCMC generations, with tree sampling every 100 generations, and a burn-in period of 2000 trees.
ML analyses were performed with PHYML (version 2.4) [21], and Bootstrap percentages (BPML) were computed after 100 replicates.
UMP analyses were run in PAUP 4.0b10 [22], and Bootstrap percentages (BPUMP) were calculated after 100 replicates of the closest stepwise addition option.
WMP analyses were conducted in PAUP 3.1.1 [18] with differential weighting of the character-state transformations using the product CIex. S (CIex, consistency index excluding uninformative characters; S, slope of saturation) as detailed in Hassanin et al. [23,24] (see online Appendix 2). For each partition, the amount of homoplasy was measured for each substitution-type (i.e., A–G, C–T, A–C, A–T, C–G, G–T, and indels) through the CIex, and the saturation was assessed graphically by plotting the pairwise number of observed differences against the corresponding pairwise number of inferred substitutions calculated by PAUP (the slope of the linear regression [S] was used to evaluate the level of saturation). Unpartitioned WMP analyses were also performed. Bootstrap percentages (BPWMP) were computed after 100 replicates of the closest stepwise addition option.
2.4 Supertree construction
The results obtained from the independent analyses of five data sets, i.e., the four nuclear genes and the matrix including the three mitochondrial genes, were used to construct supertrees with a new approach based on the Matrix Representation with Parsimony (MRP) method. In the original MRP method of Baum [12] and Ragan [13], each clade of the source trees is represented by a matrix element, where members of the clade are scored as “1”, non-members are scored as “0”, and taxa not present in the source tree are scored as “?”. In the SuperTRI method (SuperTree with Reliability Indices), the source used to construct the matrix is not a tree, but the lists of all bipartitions resulting from either the Bayesian or Bootstrap analyses, with their frequency of occurrence (steps 1 to 2, Fig. 1). All lists of bipartitions obtained from separate analyses were transformed into a binary matrix (step 3, Fig. 1) for supertree construction. Each binary character corresponds to a node, which was weighted according to its frequency of occurrence in the Bayesian or Bootstrap separate analyses (for ML and MP methods). In that way, the procedure specifically allows the expression of hidden information. The supertree was then constructed using a parsimony heuristic search under PAUP (step 4, Fig. 1). In total, four supertrees were constructed: a Bayesian supertree was constructed using the five lists of bipartitions resulting from separate Bayesian analyses of the five data sets (κCas, PRKCI, SPTBN1, TG, and mtDNA); and, similarly, three supertrees were built with either ML, UMP, or WMP methods, using the lists of bipartitions resulting from separate BP analyses of the five data sets.
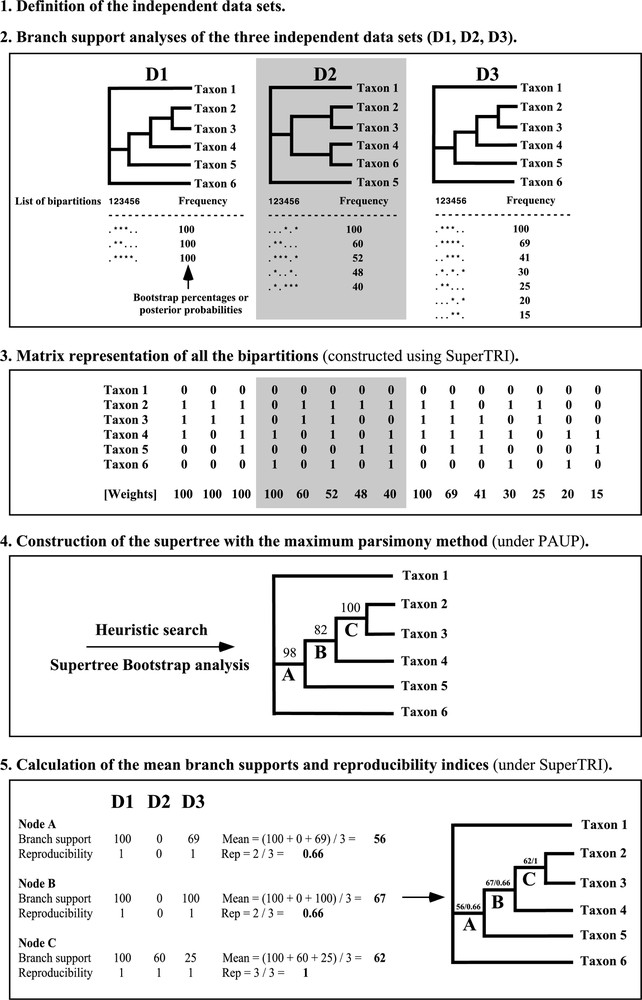
The five steps of the SuperTRI method.
2.5 Reliability indices of the supertree
The node reliability of the supertree was assessed using three different measures: the first value is the Supertree Bootstrap Percentage (SBP), which is calculated by Bootstrap analysis of the weighted binary matrix used to construct the supertree; the second value is the mean branch support in the different data sets: it corresponds to the “Mean Posterior Probability” (MPP) for the Bayesian method, or to the “Mean Bootstrap Percentage” (MBP) for ML and MP methods; the third value is an index of reproducibility (Rep), which is simply the ratio of the number of data sets supporting the node of interest to the total number of data sets. A python script called “SuperTRI” was written to construct automatically a matrix representation, which can be used directly for supertree reconstruction in PAUP* [22]. This script is available upon request to the authors. For each node of the supertree, “SuperTRI” also computes the mean branch support values (MBP or MPP) and the index of reproducibility (Rep). All these values may be reported on the branches directly using “SuperTRI”.
2.6 Tree comparisons
The trees produced during this study were compared to each other using a global similarity approach. First, each tree was compared to the 50% majority rules consensus tree reconstructed on the basis of all supertrees and supermatrix trees obtained with the four methods of tree reconstruction (BI, ML, UMP, and WMP). For that comparison, each node of a given tree was coded as a binary character, the character-state “1” indicating that the node is present in the 50% majority-rule consensus tree, and the character-state “0” indicating that the node is absent. Second, the trees recoded as sets of binary characters were used as “taxa” to construct a nexus matrix on PAUP*. Third, the different tree topologies were then compared to each other using the Neighbour-Joining method on PAUP* [22]. The NJ network is a good way to visualize the global similarity between the different topologies obtained during this study, and the length of patristic distances gives a good idea of the number of topological differences between trees.
3 Results
3.1 Independent analyses of the seven markers and comparisons with mitochondrial and nuclear supermatrix analyses
Nine data matrices were analysed using four methods of tree reconstruction (BI, ML, UMP, and WMP): the seven molecular markers (Cyb, CO2, 12S, κCas, PRKCI, SPTBN1, and TG), the matrix combining the three mitochondrial markers (mtDNA), and the matrix combining the four nuclear markers (nucDNA). The 36 topologies obtained from Bayesian or BP analyses were then compared by the Neighbour-Joining method after transformation into binary matrices. For each of the nine data matrices, the four methods of tree reconstruction produced similar topologies, as revealed by the presence of nine clusters in the NJ tree of Fig. 2. All the mitochondrial topologies obtained from the four data matrices (Cyb, CO2, 12S, mtDNA) are grouped into a cluster, which means that they are more similar among them than to the nuclear topologies (κCas, PRKCI, SPTBN1, TG, nucDNA). This result was expected, as mitochondrial genes are linked markers evolving together in the same circular genome. Moreover, the mtDNA topology is more closely related to the Cyb topology. This relationship indicates that the signal of the mtDNA matrix is more influenced by the marker containing the highest number of informative sites. Indeed, the Cyb gene represents 508 informative sites, whereas CO2 and 12S include only 236 and 229 sites, respectively. The same trend is observed with nuclear markers, as the nucDNA topology is more closely related to the TG topology, i.e., the nuclear gene containing the largest amount of phylogenetic information (TG: 197; SPTBN1: 138; κCas: 106; PRKCI: 93).
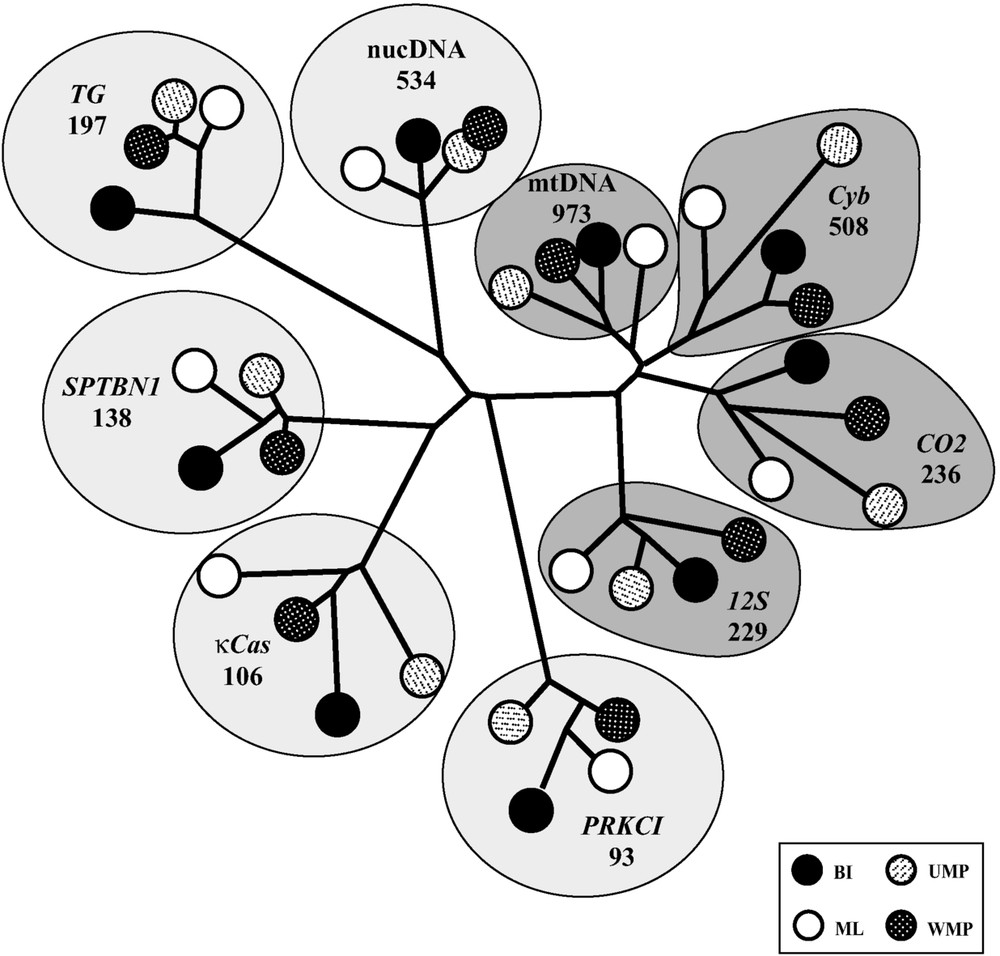
Distance tree comparing the topologies constructed with the seven markers. The topologies constructed in this study were compared using the Neighbour Joining method after transformation into binary matrices (see Material and Methods for details). Abbreviations used: BI: Bayesian Inferences; ML: Maximum Likelihood; UMP: Unweighted Maximum Parsimony; WMP: Weighted Maximum Parsimony.
By comparing pairwise distances between gene topologies, the lowest mean distances were logically found between mitochondrial trees: 22% between CO2 and 12S, 24% between Cyb and CO2, and 26% between Cyb and 12S. The distances were more important between nuclear trees: 49% between TG and PRKCI, 43% between PRKCI and SPTBN1, 40% between PRKCI and κCas, 39% between TG and κCas, 38% between TG and SPTBN1, but only 28% between SPTBN1 and κCas. Similar differences were found by comparing the topologies of mitochondrial genes with those of nuclear genes: 36% with SPTBN1, 39% with κCas, 44% with PRKCI, and 45% with TG.
3.2 Method and model sensitivity: SuperTRI versus Supermatrix analyses
Supertrees were reconstructed with the SuperTRI method and then compared with trees resulting from supermatrix analyses. Only five data sets were used for supertree reconstruction: the four nuclear genes were analysed separately, because they are physically unlinked markers located on different chromosomes; and the three mitochondrial genes were concatenated in the same data matrix, because they are linked markers located in the same molecule.
Distance topological comparisons (Fig. 3) show that the four supertrees constructed using different methods of tree reconstruction (BI, ML, UMP, and WMP) are more similar to each other than are the supermatrix topologies. For supertrees, the maximal distance was found between ML and WMP topologies (12%), and the minimal distance between UMP and WMP topologies (6%). For supermatrix trees, the maximal distance was found between UMP and partitioned WMP topologies (19%), and the minimal distance between unpartitioned and partitioned BI topologies (3%). In the analysis of the bovid dataset, these results suggest that the supermatrix approach is more sensitive to the different methods of tree reconstruction than is the SuperTRI method. In agreement with that, the results indicate that the more the evolutionary model used for the supermatrix analysis is simple, the more the phylogenetic tree is similar to the mtDNA topologies (Fig. 3). Indeed, the tree generated from the UMP method, which considers only a single substitution rate, differs from the mtDNA topologies by only 12% (mean distance), whereas the trees produced from the methods considering six substitution rates are more divergent: 15% for ML and unpartitioned WMP, and 18% for unpartitioned BI. The trees constructed using the partitioned models are more distantly related to the mtDNA topologies: 27% for the partitioned WMP, and 21% for the partitioned BI.
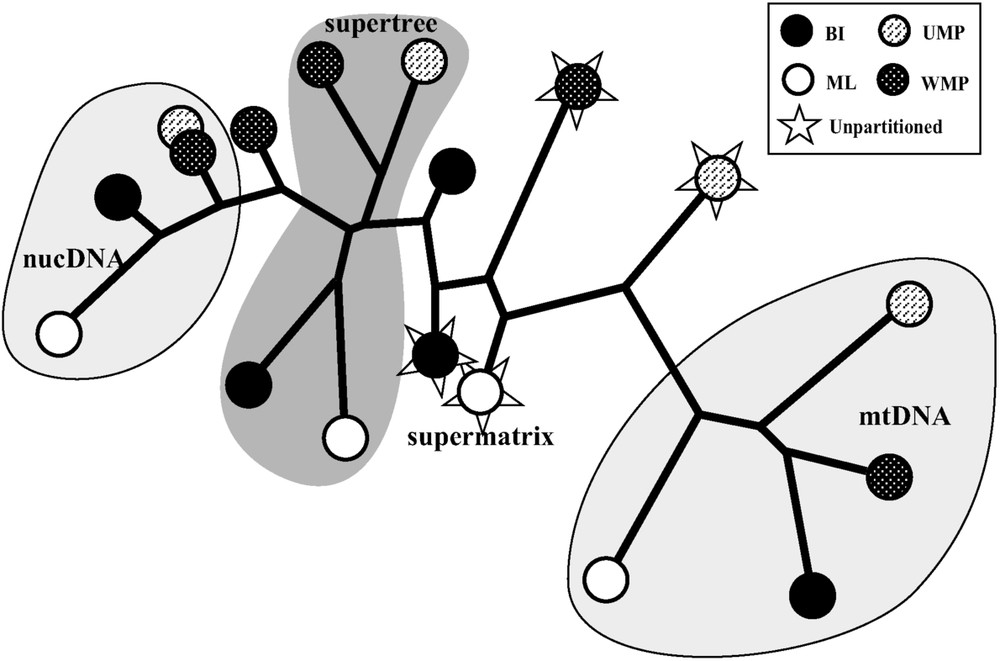
Distance tree comparing the topologies constructed with SuperTRI and Supermatrix methods. The topologies constructed in this study were compared using the Neighbour Joining method after transformation into binary matrices (see Material and Methods for details). Abbreviations used: BI: Bayesian Inferences; ML: Maximum Likelihood; UMP: Unweighted Maximum Parsimony; WMP: Weighted Maximum Parsimony.
3.3 Measures of node reliability and robustness
Three measures were calculated for each node of the supertrees. Two values were determined using the separate analyses of the data sets: the reproducibility index (Rep), which corresponds to the proportion of data sets supporting the node, and the mean branch support value, which corresponds to the mean PP for the Bayesian method or to the mean BP for other methods (UMP, WMP, or ML). The third value, named SBP (Supertree Bootstrap Percentage), was obtained from the Bootstrap analysis of the weighted binary matrix used to construct the supertree.
There is a linear relationship between the reproducibility index and mean branch support values (Figs. 4a and 4b). The slope of the regression straight line is very close to 1 for the Bayesian method (0.94). It is weaker, but similar for all other methods of tree reconstruction (0.83/0.82/0.80 for WMP/UMP/ML supertrees). These differences between MPP and MBP values may be correlated with previous studies showing that Bayesian posterior probabilities are significantly higher than corresponding nonparametric Bootstrap frequencies for true clades [25,26].
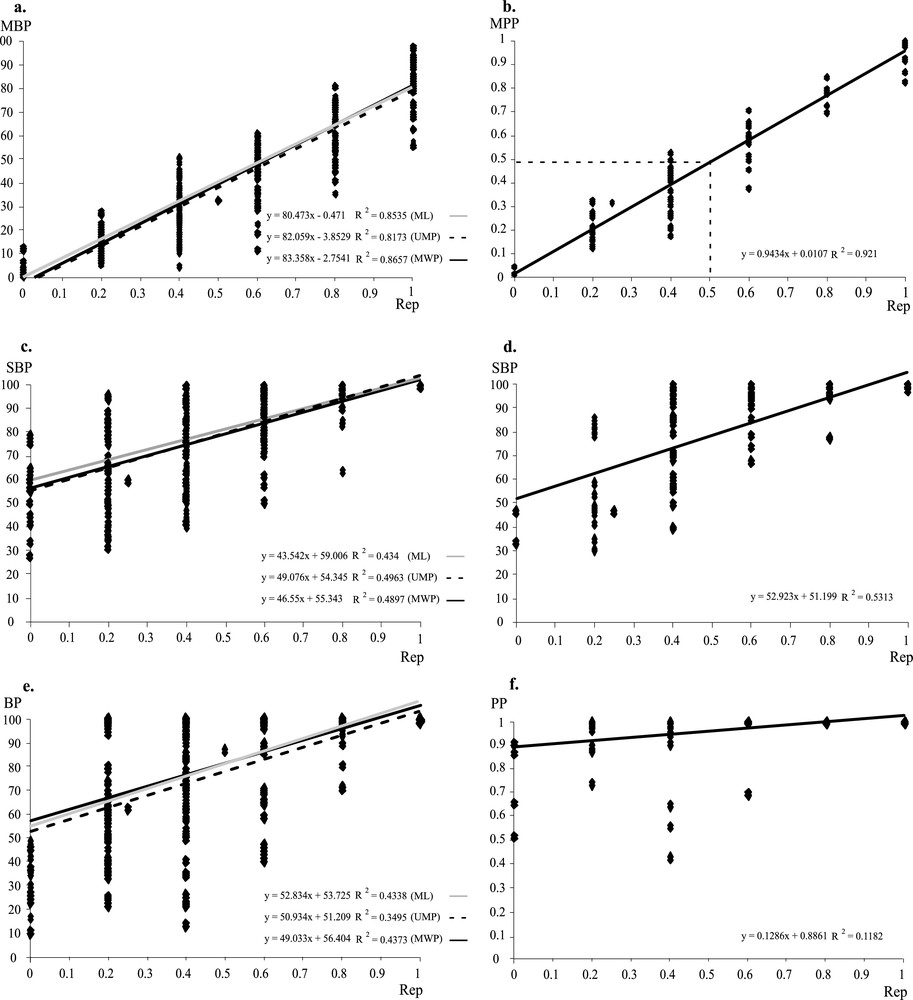
Comparisons between branch support values and reproducibility indices. The branch support values correspond to either Mean Bootstrap Percentages (MBP) of the ML, UMP, and WMP supertrees (a), Mean Posterior Probabilities (MPP) of the Bayesian supertree (b), Supertree Bootstrap Percentages (SBP) of the Bayesian supertree (c), and of the ML, UMP, and WMP supertrees (d), Bootstrap Percentages (BP) of the ML, UMP, and WMP supermatrix trees (e), or Posterior Probabilities (PP) of the Bayesian supermatrix tree (f). The linear regression is reported for each analysis.
The comparison between the reproducibility indices and SBP values (Figs. 4c and 4d) shows little correlation between these two values. For instance, several nodes that were observed in topologies inferred from two markers (Rep = 0.4) receive here a maximum support (SBP = 100). In addition, novel clades, i.e., that were not detected in any separate analyses (Rep = 0), are here supported by SBP values ranging from 28 to 79.
The reproducibility indices were also calculated for all nodes of the supermatrix trees (BI, ML, UMP, and WMP) and then compared to their corresponding branch support values (PP or BP). The results found with BP values (Fig. 4e) are very similar to those obtained with SBP values. However, the nodes that were not detected in any of the separate analyses of the data sets (Rep = 0) are never supported by BP > 50. The results found with PP values (Fig. 4f) show that they are not correlated to the reproducibility indices, as most nodes receive high support values (PP > 0.9).
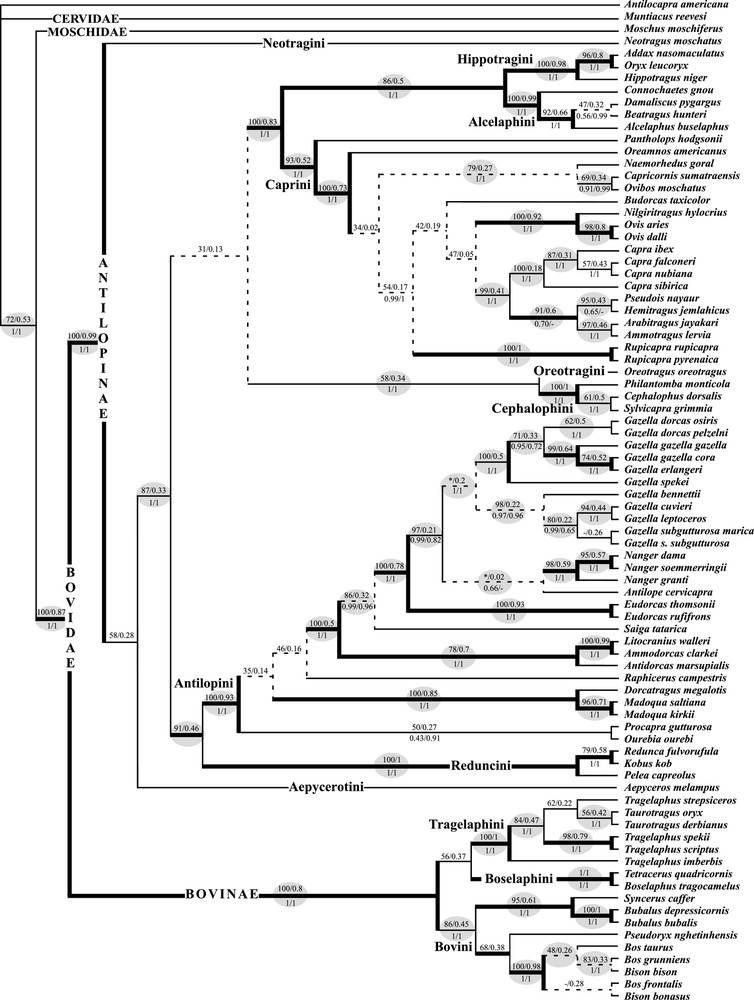
Since the supertrees produced from the four methods of tree reconstruction (BI, ML, UMP, and WMP) gave similar topologies, we show here only the Bayesian supertree (Fig. 5). Indeed, 77% of the nodes evidenced in the Bayesian supertree were also recovered in other supertrees (highlighted in grey in Fig. 5). By comparison, only 68% of the nodes evidenced in the Bayesian tree of the supermatrix analysis (not shown) were also recovered with other methods. This lower percentage indicates that the supermatrix approach is more sensitive to the methods of tree reconstruction than the SuperTRI approach.
Eighty-one percent of the nodes of the Bayesian supertree were also found in the Bayesian supermatrix analyses (Fig. 5). The branch support values of the SuperTRI analyses, expressed in MPP, are lower than those of the supermatrix analyses, here expressed in posterior probabilities (PPp and PPu for partitioned and unpartitioned BI, respectively). Indeed, only 48% of the nodes of the Bayesian supertree are supported by MPP ⩾ 0.5, whereas 99% of the nodes in the trees of supermatrix analyses are supported by PP > 0.5. At first sight, this result suggests that the SuperTRI method produces less robust trees than the supermatrix approach. However, MPP values of the supertree are indicators of node reliability, i.e. the reproducibility of the phylogenetic results (Fig. 4), whereas PP values of the supermatrix tree are only indicators of node robustness. When bootstrapping was performed on the weighted binary matrix used to construct the supertree, the SBP values were found to be comparable to the BP values of the supermatrix analyses: with the UMP method, 94% of the nodes of the supertree are supported by SBP ⩾ 50%, whereas 78% of the nodes of the supermatrix tree are supported by BP > 50%; with the WMP method, 91% of the nodes of the supertree are supported by SBP ⩾ 50%, whereas 90% of the nodes of the supermatrix tree (reconstructed using a partitioned model) are supported by BP > 50%; with the ML method, 90% of the nodes of the supertree are supported by SBP ⩾ 50%, whereas 86% of the nodes of the supermatrix tree are supported by BP > 50%. Our results show therefore that the SuperTRI method does not produce less robust trees than the supermatrix approach, and that there is no simple relation between node robustness (indicated by PP, BP or SBP values) and node reliability (indicated by Rep, MPP or MBP values).
3.4 Topological conflicts between SuperTRI and Supermatrix analyses
Particularly relevant is the fact that all highly reliable nodes of the Bayesian supertree (Fig. 5), i.e. with MPP ⩾ 0.5, were recovered in the supermatrix analyses with maximum Bayesian support (PP = 1), but also with high BP values (BPML ⩾ 93; BPWMP ⩾ 89; BPUMP ⩾ 41). There is, however, one exception to the rule. Within the tribe Caprini, the genus Hemitragus is allied to Pseudois, Ammotragus and Arabitragus in all supertrees (MPP = 0.6; MBP = 44–48; SBP = 81–97), as well as in the trees of the partitioned supermatrix analyses (PPp = 0.7; BPWMP = 97). By contrast, other supermatrix methods suggest close affinities of Hemitragus with Capra (PPu = 1; BPML/UMP = 97/94). This robust conflict is due to divergent signals in the data sets: three independent nuclear genes are in favour of the clade uniting Hemitragus with Pseudois, Ammotragus and Arabitragus (PP = 1 for κCas, SPTBN1 and TG); there is no robust signal in PRKCI (PP < 0.5); and the mitochondrial genes support the grouping of Hemitragus with Capra species (PP = 1).
Three nodes that were unreliable in the supertrees (Rep = 0.2) were strongly supported in all supermatrix analyses: (1) within Bovini, the grouping of Bison bison with Bos grunniens (SuperTRI: MPP = 0.33; MBP = 20–28; SBP = 79–83; supermatrix: PP = 0.97–1; BP = 98–100); (2) within Antilopini, the monophyly of the genus Gazella (SuperTRI: MPP = 0.2; MBP = 20–21; SBP = 64–65, not found with BI; supermatrix: PP = 1; BP = 79–100); and (3) within Caprini, the clade uniting Capricornis, Naemorhedus and Ovibos (SuperTRI: MPP = 0.27; MBP = 20–23; SBP = 79–96; supermatrix: PP = 1; BP = 99–100). All these relationships are only supported by the mitochondrial data set, but with high support (PP = 1; BP = 98–100).
Five nodes that were found in all or most supermatrix analyses were not recovered in the Bayesian supertree:
(1) Aepycerotini and Neotragini are found to be sister tribes in all supermatrix analyses (PPp/u = 0.99/0.98; BPML/UMP/WMP = 56/47/81). This relationship is essentially supported by the mtDNA data (PP = 1; BPUMP/WMP = 31/70), but significant secondary signals are present in nuclear data, as revealed by the fact that the node was recovered in several analyses of three independent genes: PRKCI (BPWMP = 32), SPTBN1 (BPUMP/WMP = 36/26), and TG (BPML/UMP/WMP = 31/30/36). The four supertree analyses show conflicting results: the WMP supertree agrees with supermatrix analyses, as Aepyceros and Neotragus are found to be sister-genera (MBP = 36; Rep = 0.8; SBP = 64); the three other supertrees suggest that Neotragus first diverged from the rest of the subfamily Antilopinae (MPP = 0.28; MBPML/UMP = 18/17; Rep = 0.4; SBPBI/ML/UMP = 58/52/54), but the grouping of Neotragus with Aepyceros is also supported by the data (SBPBI/ML/UMP = 40/47/45).
(2) The tribes Bovini and Tragelaphini are grouped together in all supermatrix analyses (PPp/u = 0.97/1; BPML/UMP/WMP = 71/71/65) and in most supertrees (MBPML/UMP/WMP = 44/50/44; SBPML/UMP/WMP = 81/91/73). This relationship is supported by most separate analyses of the data sets: SPTBN1 (PP = 0.96; BPML/UMP/WMP = 96/83/92), κCas (PP = 0.99; BPML/UMP/WMP = 61/67/63), TG (BPML/UMP/WMP = 29/56/48), and the UMP analysis of the mtDNA data (BP = 45). However, the Bayesian supertree suggests a link between Tragelaphini and Boselaphini (MPP = 0.37; Rep = 0.4; SBP = 56), a phylogenetic signal provided by the PRKCI gene (PP = 0.9; BPML/UMP/WMP = 71/72/68), and also present in the mtDNA genes (PP = 0.93; BPML/WMP = 47/57). The conflict between the Bayesian and other supertrees is explained by the fact that the Bayesian method failed in recovering Bovini and Tragelaphini together with the TG gene.
(3) Within Caprini, Oreamnos is grouped with Capricornis, Naemorhedus, and Ovibos in most supermatrix analyses (PPp/u = 0.99/0.98; BPML/UMP = 42/37). This clade was also found in the WMP supertree with very weak support (MBP = 8; Rep = 0.2; SBP = 57), but not in other supertrees, which show variable positions for the genus Oreamnos. This node was recovered with the mtDNA data alone (PP = 0.65; BPML/WMP = 40/34), and a weak signal was detected in the UMP analysis of the κCas (BP = 11).
Within the tribe Bovini, two relationships were found in most supermatrix analyses: (4) the clade uniting Bos frontalis, Bison bison and Bos grunniens (PPp/u = 0.90/0.97; BPML/UMP = 63/68), and (5) the connection between Bison bonasus and Bos taurus (PPp/u = 0.97/0.99; BPML = 74). Both these signals come from the mtDNA data alone, which clearly support the group composed of Bos frontalis, Bison bison and Bos grunniens (PP = 0.96; BPML/UMP/WMP = 84/65/49), as well as the sister-group relationship between Bison bonasus and Bos taurus (PP = 0.94; BPML/UMP/WMP = 89/36/76). These nodes are not found in the supertrees, which show a weakly supported clade composed of Bos taurus, Bison bison and Bos grunniens (MPP = 0.26; MBP = 17–26; SBP = 46–50).
The clade uniting the tribes Antilopini and Reduncini was evidenced in all the supertrees (MPP = 0.46; MBPML/UMP/WMP = 18/19/23; SBPBI/ML/UMP/WMP = 91/98/79/51), and also in the ML and UMP supermatrix trees (BP = 52/59), whereas BI and WMP supermatrix analyses suggested that Antilopini are related to Cephalophini and Oreotragini (PPp/u = 1/0.98; BP = 36), and that Reduncini are linked to the clade containing Alcelaphini, Caprini and Hippotragini (PPp/u = 1; BP = 58). These contradictions are the consequences of conflicting signals in the data. The PRKCI gene contains a robust signal to cluster Reduncini with Alcelaphini, Caprini and Hippotragini (PP = 1; BPML/UMP/WMP = 82/89/88). This node is also found in MP analyses of the SPTBN1 gene (BPUMP/WMP = 34/44). In addition, this gene contains a weak signal to group Antilopini with Cephalophini (PP = 0.24; BPML/MP/WMP = 28/16/14). By contrast, three data sets show a moderate support for a sister-group relationship between Reduncini and Antilopini: TG (PP = 0.79; BPML/MP/WMP = 25/31/36), κCas (PP = 0.75; BPML/UMP/WMP = 27/30/44), and mtDNA (PP = 0.51; BPUMP/WMP = 26/33). In addition, the mtDNA supports that Cephalophini and Oreotragini are related to Alcelaphini, Caprini, and Hippotragini (PP = 0.63; BPML/UMP/WMP = 37/17/14).
4 Discussion
4.1 Assumptions of the SuperTRI method
4.1.1 Independence of the data sets
The SuperTRI approach, as all other supertree methods, implies to make a choice on the data sets used to construct the supertree. Unfortunately, many authors have published supertrees without defining the criteria for selection of the data sets. Gatesy et al. [27] pointed out that the incorporation of source trees based on dubious data makes these published supertrees weak phylogenetic statements. Moreover, some published supertrees have included redundant sampling of the same characters for the same taxa [28]. These problems of redundancy do not concern the SuperTRI method, which implies to build and then analyse the different data sets used for supertree construction.
The most important criterion of the SuperTRI method assumes that the data sets used for separate phylogenetic analyses have evolved independently from each other. In molecular phylogeny, the hypothesis of independency of the data sets can be however rejected when several mitochondrial genes are included in the analyses. As the mitochondrial genome is maternally transmitted as a whole to the descendants, mitochondrial genes are supposed to share the same evolutionary history. Therefore, if different mitochondrial genes are defined as being different data sets, the contribution of the mitochondrial signal will be overweighted in the supertree construction, because of the addition of redundant signals. This unwarranted overweighting can lead to incorrect phylogenetic conclusions when the mitochondrial signal differs significantly from that of nuclear genes. For instance, ancient mitochondrial introgression, as those previously hypothesized in the family Bovidae [29,30], could be particularly misleading for phylogeny. To avoid such errors in supertree construction, the mitochondrial genes must be concatenated and considered as a single data set. Similarly, nuclear genes that are physically linked to each other should be also grouped into a single data set. For that reason, all the four nuclear markers selected for our study are located on different chromosomes. Note that the hypothesis of independence of the data sets could be however questioned if chromosomal rearrangements occurred during the evolution of the studied taxon.
4.1.2 Reproducibility of the results
A phylogenetic hypothesis could be described as reliable if it has a high probability to be supported over time (reproducibility criterion). Thus, the congruence of phylogenetic results obtained from multiple independent data sets is considered as a strong indicator of reliability, even if the statistical branch support for each individual result is weak [31–33]. By contrast, a phylogenetic hypothesis that is highly supported by only one data set and never found by others could not be considered as reliable.
The SuperTRI method exploits the advantages of branch support analyses and reproducibility criterion to evidence the most reliable phylogenetic hypotheses. The independent data sets are analysed separately, and the branch support value (BP or PP) of each phylogenetic hypothesis is used to apply a weight for the MRP analysis. As a consequence, the supertree constructed with the SuperTRI method can be interpreted as a consensus tree of all branch support analyses. In Fig. 4, we have plotted the reproducibility indices of all nodes of the supertrees against the mean branch supports (expressed in MPP and MBP, respectively) or SBP values. The results show that the reproducibility index is linearly correlated with the mean branch support, but not with the SBP value. This means that only MPP and MBP values can be used as indicators of node reliability.
4.1.3 Principal and secondary signals
The principal phylogenetic signal of a data set is the one that gives the optimal tree under several selected criteria of tree reconstruction, including alignment, method and model. Secondary signals correspond to subsignals of the data set that support phylogenetic hypotheses that are not found in the optimal tree. A presumed advantage of the supermatrix approach is that novel relationships, which are contradicted by all separate analyses of the data sets, can emerge from the simultaneous analysis by summing the subsignals coming from different data sets [6]. In our supermatrix analyses, only one novel relationship was found with a significant support: within the tribe Caprini, the grouping of the genera Ovis, Nilgiritragus, Rupicapra and Budorcas in the Bayesian tree (PP = 0.91). Since this clade was not recovered in any other supermatrix analyses (ML and MP), and has never been proposed in the literature, we conclude however that no accurate novel clade emerged from the combination of the data sets. A more interesting and real effect of the supermatrix approach is that principal signal(s) can be enhanced by subsignals of other data sets, which can result in a significant increase of the branch support relative to that indicated by separate analyses of the individual data sets [34].
As pointed out by several authors, the phenomenon of signal enhancement cannot exist with current methods of supertree, because source trees correspond only to principal signals [7,8]. By contrast, the SuperTRI method takes into account both principal and secondary signals, because all phylogenetic hypotheses found during branch support analyses of the independent data sets are represented in the matrix used for supertree construction.
4.2 The misleading effects of the mtDNA in the Supermatrix approach
4.2.1 Model partitioning
Combining multiple molecular data sets into a single one can be problematic for phylogenetic reconstruction. Indeed, DNA markers may differ in evolutionary modalities (differences in mutational rates, selective constraints, and base composition), and in phylogenetic signal, concerning both quantity (number of informative sites) and quality (topological conflicts between markers). The best example concerns the differences classically observed between mt and nuclear markers. Since the mt genome typically evolves much more rapidly than the nuclear genome [35,36], and with asymmetric mutational constraints [37,38], mt genes always contain greater percentages of informative sites than nuclear genes, and their estimated model parameters are generally divergent from those calculated for nuclear genes. In our analyses, the mt genes exhibit significant differences in the parameters estimated for the GTR + I + G model (Appendix 2): the probabilities for transversions are lower; the probability for C/T transition is higher; the base composition is A + C rich, and poor in G nucleotides; and the proportion of invariable sites is an important parameter, whereas it is negligible for nuclear genes. These differences can be problematic when the supermatrix is analysed by using a single model for phylogenetic reconstruction (unpartitioned BI, MP, and ML methods). Indeed, as mt genes represent 52.4% of our data, and contain 65% of the total number of informative sites, the model parameters estimated for the supermatrix are more similar to those calculated for the mtDNA data alone (Appendix 2). Since this model exhibits inadequate fit to the nuclear data, the phylogenetic signal of nuclear markers is expected to be misanalysed. To overcome this problem, one solution is to divide the data into several partitions that have evolved under different evolutionary constraints, and then to conduct the phylogenetic analyses by applying a specific model for each partition. Partitions may correspond to sequences from different genomes, different genes, or different regions of the same gene, such as the three codon-positions in protein-coding genes, stems and loops of secondary structure in rRNA genes, introns and exons of genes. Model partitioning improves fit of the parameters to subsets of the data evolving under different mutational and selective constraints [39–42]. Our results show that partitioned methods are less biased by the dominant signal of the mtDNA than unpartitioned methods (Fig. 3). Our supermatrix analyses confirm therefore previous studies that have shown the importance of model partitioning for improving the accuracy of phylogenetic inferences [43–45].
4.2.2 Misinterpretations due to mtDNA introgression
Many robust topological conflicts between supermatrix and supertree results concern recent divergences that occurred during the Pliocene and Pleistocene epochs. They are systematically due to differences in phylogenetic signals between mt and nuclear data. For inferring relationships among closely related species or genera, it is well known that mtDNA genes bring more information than nuclear genes, which may be invariable at this level of the tree. As no strong competing signal exists in the data, the mtDNA genes often impose their own signal in the supermatrix analyses. Differences in genetic variation may therefore explain why several nodes are strongly supported in the supermatrix analyses, but not in the supertrees. A good example concerns the relationships between species of Bos and Bison within the tribe Bovini (Fig. 5). All supermatrix analyses highly support that the genus Bison is polyphyletic, while supertrees do not reveal robust relationships between Bos and Bison species. Actually, the nuclear genes analyzed here do not contain any structured signal at this level of the tree. However, the genus Bison was found monophyletic with the SRY gene, suggesting that the mt signal is misleading [46].
A more striking example of conflicts between mt and nuclear data concerns the position of the genus Hemitragus within the tribe Caprini: it appears related to Pseudois, Ammotragus and Arabitragus with three independent nuclear genes (κCas, SPTBN1 and TG), whereas it is robustly allied to Capra with the mtDNA data. The reason of this conflict was developed in Ropiquet and Hassanin [29]: the species tree is in fact given by the nuclear genes, while the mitochondrial genes are misleading, because the mitochondrial genome of proto-Hemitragus was transferred into the common ancestor of Capra species during the Pliocene epoch (ancient mitochondrial introgression). As another ancient event of mitochondrial introgression has been also identified between two other bovid species (i.e. from kouprey, Bos sauveli, to banteng, Bos javanicus, in Cambodia; [30]), we consider that relationships only supported by the mtDNA signal are of doubtful accuracy. As the signal of the mtDNA data is dominant over nuclear genes, the supermatrix analyses can result in dramatic misinterpretations. In such cases, the supertree method is expected to be more proper.
4.3 Robustness and accuracy of the phylogenetic hypotheses
In the supermatrix approach, all molecular data available for a chosen taxonomic sample are concatenated into a single data matrix, which contains therefore a large number of characters for phylogenetic reconstruction. The main advantage of supermatrix is that phylogenetic signals from different DNA markers, including weak signals, can be combined and thereby enhanced [8,47]. For that reason, the supermatrix tree is often more resolved and robust than the trees coming from separate analyses of DNA markers. The statement that trees obtained from supermatrix analyses tend to be more resolved than the corresponding supertrees [11] might also reflect the greater information content of supermatrices and the associated emergence of hidden support [6]. With the SuperTRI method, however, our analyses do not confirm that the supermatrix trees are more resolved and robust than the supertrees. In addition, two arguments suggest that many of the robust nodes evidenced in the supermatrix analyses cannot be considered as accurate for interpreting phylogenetic relationships: (1) as developed previously, the comparisons with the supertrees and separate analyses of data sets have emphasized several cases in which the supermatrix approach is biased by the dominant signal of the mtDNA; and (2) there is no evident correlation between node robustness of the supermatrix analyses and reproducibility of the results in the independent analyses of the five datasets (Figs. 4e and 4f). In other words, robust nodes in the supermatrix trees are not necessarily reliable. In such conditions, we can question the usefulness of robustness analyses when mitochondrial genes are overrepresented in the supermatrices.
The SuperTRI method is expected to be more accurate than the supermatrix approach because it minimizes the misleading effect of loci with histories involving horizontal transfers, such as mitochondrial introgression. Indeed, if the problem affects a taxon in only one data set, the node corresponding to the misplaced taxon in one tree should be concealed in the supertree by other data sets placing the taxon at the “correct” place. In addition, the mean branch support values are easily interpreted in the case of the SuperTRI method. Since there is here a clear correlation between robustness of the nodes and their reproducibility by different data sets, all well supported relationships could be considered as accurate.
In deep contrast with the tree obtained from the supermatrix analyses, many nodes of the supertrees are however poorly supported when the mean branch support values are considered. In theory, four main hypotheses can be advanced to interpret this weak support. (1) For taxa that have recently diverged, unsupported relationships can be explained by the lack of phylogenetic signal in nuclear genes. (2) For ancient divergence events, the accumulation of multiple substitutions at the same positions over time can lead to many convergences and reversions (homoplasies), which may completely erase the genuine phylogenetic signal. In such cases, most deep nodes of the tree will be unresolved. (3) Robust disagreements between the data sets may also result in low branch support values. In such cases, the origin of the conflict is often explained by the incorporation of erroneous sequences: taxonomic misidentification, DNA contamination, paralogous copies, and sequencing errors. (4) In some cases, the weak branch support may be the result of a radiation, i.e. a rapid succession of speciation events in a time period too brief to allow the accumulation of substitutions. The hypothesis of radiation can be accepted with high confidence level when two conditions are satisfied. First, the presence of well supported nodes both after and before the putative event of radiation is a strong argument for rejecting the hypotheses that the data do not contain enough phylogenetic information or, on the contrary, that they are saturated with homoplasy. Second, the lack of resolution should be observed in both SuperTRI and supermatrix analyses. Using these two criteria, we detected four cases of radiation in the family Bovidae: (1) inter-tribal relationships within Antilopinae; (2) the diversification of several lineages within the tribe Caprini; (3) the basal radiation among genera of Antilopini, and (4) the divergence between three genera of gazelles: Gazella, Eudorcas and Nanger. The two first radiations were detected in previous studies [48,49], whereas the two others are new molecular evidence.
5 Conclusions
The originality of the SuperTRI method is that it takes into account both principal and secondary phylogenetic signals for supertree reconstruction.
Our analyses have shown that the dominant signal of the mtDNA data is particularly misleading for supermatrix analyses, whereas its effect is voided or strongly limited in the SuperTRI analyses, suggesting that the latter are more reliable to determine the true relationships among taxa. However, we consider that the comparison between SuperTRI and supermatrix results is pertinent to evidence either horizontal transfers or radiation events.
Note
Acknowledgements
A.R. and A.H. are very grateful to Professor Guillaume Lecointre for encouraging collaboration with B.L.