

1 Introduction
Transfer into tumors of conditionally toxic suicide genes is an attractive gene therapy approach for selective elimination of cancer cells. Suicide genes generally encode non-mammalian enzymes that are able to convert toxicologically and pharmacodynamically inert agents into highly toxic metabolites [1–3]. A potent suicide gene named FCU1 derived from the Sacccharomyces cerevisae cytosine deaminase (FCY1) and uracil phosphoribosyltransferase genes (FUR1) and able to transform in situ the non toxic prodrug 5-fluorocytosine 5-FC to its highly cytotoxic derivatives 5-fluorouracil (5-FU) and 5’-fluorouridine-5’monophosphate (5’-FUMP) has shown interesting properties for novel cancer gene therapies [4]. Recently and in combination with concomitant per os administration of prodrug 5-FC, the therapeutic benefit of using a highly attenuated vaccinia virus named modified vaccinia virus Ankara (MVA) to deliver and express the FCU1 gene under the control of the p11K7.5 promoter (MVA-FCU1) has been demonstrated in culture cells as well as in vivo in nude mice bearing subcutaneous implanted human colon carcinoma tumors [5]. In this last case, the tumor volumes were determined by external caliper measurements of the dimensions of the visible tumor using the formula (π/6) (length × width2) [5]. External dimension measurements able to monitor the growth of tumors lack precision for volume definition and are only useful in the restricted case of subcutaneous implanted tumors and are inappropriate in orthotopic implanted tumor cells. Preclinical molecular imaging modalities (CT, MRI, PET and SPECT) have recently emerged as potential new tools in small animal models of human diseases for non invasive longitudinal and quantitative follow-up of therapeutic strategies allowing for orthotopic tumors measurements. The benefits involve a smaller number of animals relative to histological measurements and the advantage of each animal being his own reference [6,7].
The aim of this work was to demonstrate in vivo the efficacy of the MVA-FCU1 gene therapy in an orthotopic mouse model of glioblastoma by longitudinal monitoring of the brain tumor volume evolution with low field preclinical MRI without any assumption on the tumor shape and also avoiding the sacrifice of animals.
2 Materials and methods
2.1 Animal model and suicide gene therapy protocol
Animal experiments were conducted in compliance with the French guidelines for the care and use of research animals (authorization 67-48220). Sixteen adult female Swiss nu/nu mice with a mean weight of 20 g were anesthetized (100 mg/kg ketamine and 5 mg/kg xylazine) and 5 × 10⁵ human glioblastoma cells (U-87 MG cell line obtained from the American Type Culture Collection [Rockville, MD]) suspended in 5 μl of PBS were inoculated with a Hamilton syringe into the striatum of the right hemisphere via stereotactic injection (1.8 mm lateral and 0.1 mm anterior to bregma, at a 3 mm depth from the skull surface). Inoculation time was 10 min to limit backflow along the injection tract.
The MVA-FCU1 suicide gene protocol used in this study is described in details elsewhere [5]. Briefly, tumors were allowed to grow for 5 days before stereotactic injection (day 5) of 5 μl of control vehicle (PBS) or 1 × 10⁶ PFU of MVA-FCU1 vector using the same coordinates on the stereotactic frame, as for tumor cell implantation. One day after injection (day 6), half of the animals were given 5-fluorocytosine (5-FC) by oral gavage at 100 mg.kg−1 (0.5 ml 5-FC 0.5% in water) twice a day during 14 days (until day 20). As a result, four groups of four mice were obtained: sham group, sham group treated with 5-FC only, sham group with injection of MVA-FCU1 vector only, therapy group administered with MVAp11K7.5-FCU1 vector and 5-FC. To estimate the evolution of the intracerebral tumor volume, animals were examined with magnetic resonance imaging (MRI) every 7 days starting on day 7 after the tumor inoculation. At the onset of hemiplegia, moribund state, or inability to feed or drink, animals were euthanized by an overdose of anesthetic.
2.2 Magnetic resonance imaging
MRI studies were performed using a preclinical dedicated 0.1T resistive magnet (Bouhnik SAS, Velizy-Villacoublay, France) as previously described [8,9]. During imaging procedures, mice were maintained under gaseous anesthesia (isoflurane 1–1.5% in air) in a warmed-up MR compatible technical cell dedicated to small animal imaging (Minerve, Esternay, France) that aimed at maintaining the animal homeostasis and that standardized animal positioning. After intraperitoneal administration of 1 mL of a Gd-DOTA contrast agent (1/4-dilution in physiological saline solution; Dotarem, Guerbet, France) at a dose of 5–6 mmol kg−1, both T1- and T2-weighted images were acquired covering the entire mouse brain. An in-house built radiofrequency solenoid copper coil (2 cm in diameter, five turns, Q factor of 200) was placed around the animal head's before its snout was driven into the anesthesia mask with a bite bar. The air inside the imaging cell was heated to 37 °C and an inductive coil was slid along the outer tube of the technical cell for coupling at 4.26 MHz corresponding to the 1H resonance frequency at 0.1T as shown in Fig. 1. The technical imaging cell was placed inside the vertical magnetic field of the MR imager and the animal positioning was controlled with a scout sequence (50 sec) before use of 3D gradient echo imaging sequences to produce T1- and T2-weighted images. The complete imaging procedure including positioning of the animal in the MR imager lasted about 1 h 45 using the following imaging sequence parameters: FLASH T1-weighted sequence [10], isotropic voxel 0.5 mm × 0.5 mm × 0.5 mm, TR/TE 100/7 ms, flip angle 80°, cubic FOV = 32 mm, acquisition matrix 64 × 64, 64 slices, NEX = 8, total acquisition time 56 min; CE-FAST T2-weighted sequence [11], reconstructed voxels 0.5 mm × 0.5 mm × 1 mm, TR/TE 14/21 ms, flip angle 70°, cubic FOV = 32 mm, acquisition matrix 64 × 48, 32 slices, NEX = 60, total acquisition time 32 min.
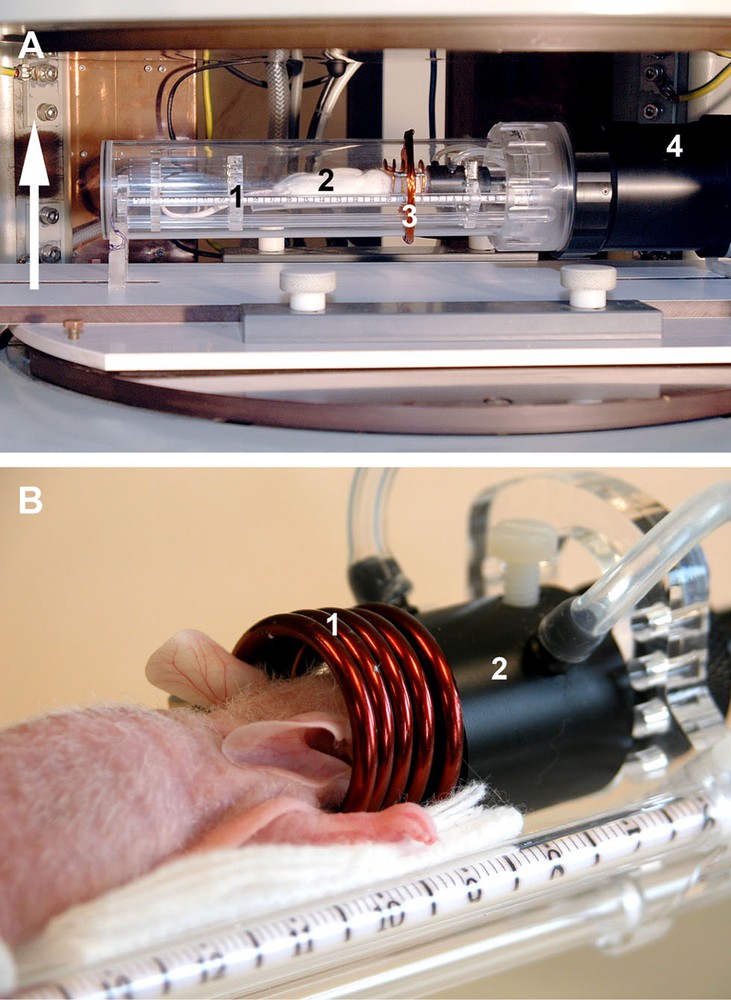
Set-up of the experiment: A. View of the animal inside the warmed-up MR compatible technical cell dedicated to small animal imaging, placed in the open magnet (white arrow: direction of the magnetic field; 1: removable blister in plexiglass to isolate from the outside; 2: animal; 3: pick-up coil for coupling betweeen RF coil and spectrometer; 4: heating air circuit and regulation). B. Close-up view of the animal on the bed (1: RF coil; 2: gaseous anesthesia mask).
2.3 Data analysis
The 3D reconstructed MRI data were processed using the Image J software (Rasband WS, Image J, US National Institute of Health, Bethesda, Maryland, USA, http://rsb.info.nih.gov/ij/, 1997–2009). The brain tumor segmentation was obtained in each axial slice by selecting high intensity pixels related to the tumor using a threshold, the value of which being determined manually both by visual data analysis and by considering the data grey level histogram. The thresholding step was followed by manual erasing of selected non brain related areas, e.g. scalp or muscles in T1, and fat or eyes in T2-weighted data. The number of selected voxels was then multiplied by the individual voxel volume (125 × 10−3 mm3 and 250 × 10−3 mm3 respectively in T1- and T2-weighted images) in order to calculate the volume of the tumor. Data were processed twice by the same observer to test for intra-observer variability and by a second observer to test for inter-observer variability. To assess efficacy of the suicide gene therapy, the tumor doubling times (tD) were calculated for each animal using every volume measurements by fitting the experimental T1 and T2 curves under assumption of geometric increase [12]: Vt = 2(V0)t/tD, where V0 is the initial tumor volume (day 7) and Vt is tumor volume at time t.
2.4 Histology
Animals were sacrificed at different times post-injection by administration of a lethal dose of Pentobarbital®. They were exsanguinated by transcardial perfusion first with 0.1 M Phosphate Buffer (pH7.4, ice-cold, 20 ml/mouse), then with a 4% formaldehyde solution in PBS (ice-cold, 5 ml/mouse). Brains were dissected out of the skull and rinsed in PBS before Tissue Tek® OCT (Sakura Finetek, France) inclusion and rapid freezing on dry-ice. Twenty-micrometer thick transversal sections were cut in a cryomicrotome and placed on poly-L-Lysine-coated slides. Sections were washed in distilled water and mounted in Mowiol® (Calbiochem, Germany).
2.5 Statistics
Statistical analysis for comparison of tumor doubling times between groups was performed using the non-parametric Mann-Whitney U test. For inter- and intra-observer tumor volume measurements, a t test was used. A value of p < 0.05 was considered statistically significant.
3 Results
During the 6 weeks of follow-up, no animal died during, nor following, the weekly imaging procedure that required a 1 h 45-long-anesthesia and an intraperitoneal contrast agent injection. The observed median survival rates were similar to the ones obtained in a previous Kaplan-Meier survival analysis (sham group median survival 28 days, treated group median survival 42 days, J. Kintz et al., manuscript in preparation). Mice brains were harvested at different time points for histopathological examination, confirming the presence of tumor in all sacrificed mice.
In both T1- and T2-weighted acquisitions and as illustrated in Fig. 2, the tumor-related volume of interest exhibited hyper-intense T1-weighted images, this was related to the presence of gadolinium contrast agent intake in the tumor tissue revealing that the blood brain barrier was broken, while in T2-weighted images, tumor tissue modifications and peritumoral edema were both visible. For each time points, no statistical significant differences were shown for both intra- and inter-observer tumor volume measurement. The tumor-related hyperintense volumes could be detected in every animal as soon as day 7. The measured tumor-related mean volumes were larger in T2-weighted images than in T1-weighted images due to tumor tissue modifications as well as peritumoral edema. For each group, both T1 and T2 mean tumor volume growth curves are displayed in Fig. 3, which illustrates also the efficacy of the suicide gene therapy in delaying the tumor growth. In Fig. 3 and for simplicity are only displayed the changes in mean tumor volumes (T1 and T2) over time without adding the standard deviation values at each time point. This is because individual volume values were sometimes highly different due to variable individual tumor behavior and limited number of animals in each group leading to important standard deviation values in particular for the treated animal group at late time points. Therefore, for statistical reasons, we preferred to use the standard deviation of the volume doubling time computations reflecting anyway the individual differences in tumor growth. The tumor doubling times calculated using the T1 volume measurements were respectively 6.0 ± 1.1, 6.6 ± 0.4 and 6.0 ± 1.3 days for the three sham groups, i.e., sham group, sham group treated with 5-FC administration only, sham group with injection of MVA-FCU1 vector only. Similarly, the tumor doubling times calculated using the T2 measurements were respectively 5.3 ± 0.7, 7.7 ± 1.7 and 7.1 ± 1.4 days for the three sham groups. In the three sham groups, no significant differences were obtained between the doubling times based on T1 and T2 volumes curves computation.
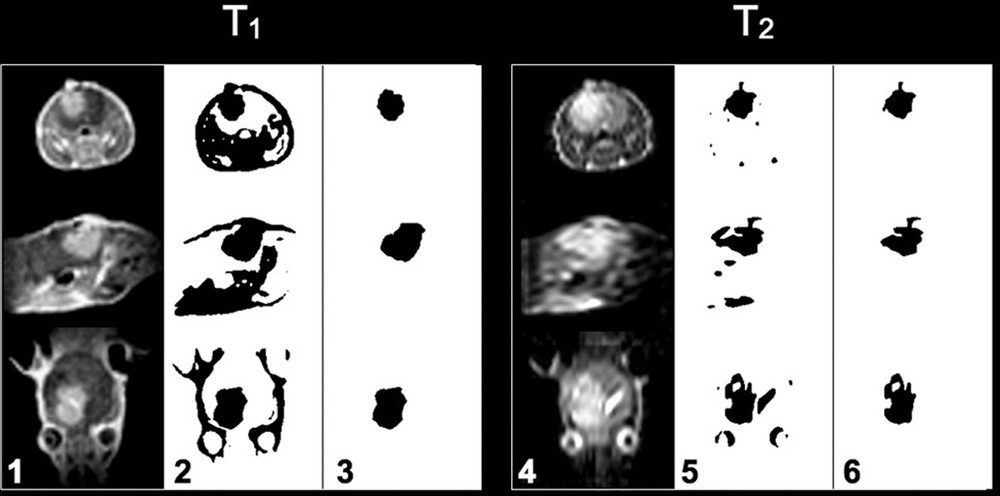
T1- and T2-weighted axial, sagittal and coronal slices (from top to bottom), of a mouse of one of the sham groups showing the presence of brain glioma at day 21 after implantation. The columns 1 and 4 show the original acquisitions, columns 2 and 5 binary images obtained after thresholding, colums 3 and 6 voxels of the tumor remaining after manual erasing of other tissues. These voxels are the ones taken into account in the calculation of the tumor volume.

Time evolution of mean of the tumor volumes calculated from T1 (squares) and T2 (circles) acquisitions. The three sham groups are shown in black (opened symbols) and the suicide gene therapy group in grey (closed symbols).
In contrast, the mean tumor doubling times calculated using the T1 and T2 volumes curves in the therapeutic group were respectively 19.1 ± 16.6 and 17.2 ± 13.7 days. Significant differences (p < 0.05) were found between mean tumor doubling times of the three sham groups and the therapeutic group both for T1and T2 volume curves.
4 Discussion
4.1 In vivo MRI follow-up of brain tumors
Previous investigations have demonstrated a good correlation between MRI results and histological measures of brain tumor volume in small animal models, [13–15]. Based on these results, no comparison between histological brain volumes and MRI results was undertaken in this study. Up to now, MRI follow-up of brain tumor growth in mice relies on the measurement of the tumor's largest radius, under the hypothesis that this radius reflects the actual tumor volume, or using ellipsoidal modeling of the volume based on measurements of largest tumor dimensions, or slice by slice manual outlining of the tumor [13,14,16–23]. Reconstructed data in all these studies using magnetic fields ranging from 1.5 T to 11.7 T were anisotropic, with a slice thickness four to 10 times larger than the in-plane resolution, leading to reconstructed voxel volumes ranging from 6 × 10⁻³ mm3 [20,21] to 40 × 10−3 mm3 [14] (whenever the voxel volume was given or could be derived from the data given). In addition, only some of these studies performed several sequential tumor volume measurements (two measurements [20,14], four measurements [16], five measurements [18], between four and nine measurements [20]) reflecting the tumor growth kinetics. In addition to tumor volume growth measured by T1- and T2-weighted images, diffusion MRI has been successfully evaluated as a biomarker of early treatment response because the apparent diffusion coefficient (ADC) of water is sensitive to changes in tissue cellularity [23]. ADC increases as water mobility, induced by cell kill, increases in extracellular spaces [24]. However, we decided not to use diffusion MRI sequences even knowing that the ADC is independent of the magnetic field strength [25]. Our principal reasons in this study were first to demonstrate that low field MRI is able to accurately follow tumor growth with the advantages of lower installation and running costs [9] and second, to avoid lengthening of in vivo exams as T1- and T2-weighted images acquisition time was 1 h 45 per mouse at 0.1T.
In our T1 protocol, we chose to acquire an isotropic 3D-volume with a voxel volume of 125 × 10−3 mm3. A lower signal in T2-weighted data acquisition does not allowed to keep the same imaging strategy leading to voxel volumes of 250 × 10−3 mm3. Tumor volumes were directly measured in every data set, without making any assumption on the tumor shape [15]. There are obviously differences when comparing voxel resolutions and signal to noise ratio at 0.1T versus those obtained at high and very high magnetic fields reported above (to that respect see the extensive discussion in [9]). However, to test the relevance of any therapy aiming at reducing a tumor volume or able to delay its growth, only significant tumor volume differences are expected during follow-up when compared to the voxel size. For that reason, we think that low field MRI was adapted to test in vivo the efficacy of the proposed suicide gene therapy protocol directed against brain tumor growth in an orthotopic human glioblastoma mice model.
The relatively long imaging procedure (1 h 45 per mice), which was repeated weekly, did not impact on animal survival because we used gas anesthesia and used a warmed non-magnetic imaging cell. For comparison, the images acquisition times obtained at higher field were 45 min for a set of T2-weighted images at 4.7T [4] and 42 min at 8.45T for T1- and T2-weighted images [14].
4.2 Manual versus automatic segmentation of tumor volumes
Manual determination of a tumor volume based on ellipsoidal modeling using bi-dimensional measurements of corresponding larger radius in selected MRI slices is an approximate but classical method [26]. However, the use of a slice by slice manual thresholding method allowing defining highlighted pixels in the T1 and T2 images for segmentation prior to tumor volume determination is a time-consuming task. Moreover, and even if inter- and intra-observer differences in tumor volumes measured in this study were not statistically significant, reproducibility of manual methods for MR volume determination requires experienced observers. To overcome these difficulties, a vectorial multichannel-multiphase brain tumor segmentation technique aiming at reducing the number of operator dependent actions to the single choice of a volume of interest (VOI), which may include the whole brain, has been proposed recently by our group [27]. Application of such semi-automatic methods should greatly facilitate image data analysis in future works.
4.3 Evaluation of therapeutic response with low field MRI
The T1-weighted volume growth curves were similar among the three sham groups showing that both the tumor model and MRI method were reproducible. The T2-weighted volumes also followed similar growth patterns but showed a greater heterogeneity, which reflected the individual variability in edema volume, but also a larger image slice thickness and a lower signal to noise ratio compared to T1 acquisitions. The tumor volumes calculated among the sham groups were similar and comparable to the ones calculated in the treated group after the end of the treatment administration. The significant differences observed in tumor doubling times between the sham groups and the treated group confirmed that the intratumoral injection of MVA-FCU1 vector in combination with 5-FC oral administration neutralized the growth of the intracerebral glioblastoma tumor during the 2 weeks of 5-FC administration in agreement with previous in vivo results obtained in subcutaneous colon carcinoma implanted tumors in nude mice [9]. A separate study (J. Kintz et al., manuscript in preparation) was conducted in order to determine the potential toxicity to normal brain of the MVAp11K7.5-FCU1/5-FC protocol. Brains from mice were injected with MVA-FCU1 and mice were treated with 5-FC per os for 14 days. No noticeable side effects were observed during the time of the experiment and mice were still alive 3 months after virus inoculation.
5 Conclusion
In this study, we performed a weekly follow-up of intracerebral glioblastoma tumors in mice using 3D T1- and T2-weighted MRI during 6 weeks. The tumor volumes were calculated from the 3D MRI data allowing for tumor doubling times determination. A significant statistical difference between sham groups and animals treated with an intratumoral injection of MVA-FCU1 vector in combination with 5-FC oral administration during 2 weeks was observed. A total of 65 examinations were performed throughout this study, with four examinations a day during the first 4 weeks, which showed that the protocol combining the use of a low field 0.1 T MRI dedicated preclinical scanner including an MR compatible imaging cell was adapted to the in vivo follow-up of tumor growth and therapy evaluation in mice series bearing a cerebral tumor.
Acknowledgements
E. Breton has benefited from a doctoral fellowship from GE Healthcare and Region Alsace.