

1 Introduction
Histone H1 is a basic chromatin protein that seals the ascending and descending strands of DNA wrapped around a core histone octamer to stabilize the nucleosome structure [1]. Despite a conventional view of histone H1 playing a principal role in chromatin organization by positioning nucleosome arrays and folding a nucleosome filament into higher-order fiber [2], many aspects of its activity remain controversial. There are some ambiguities about histone H1 dispensability in lower [3] and higher [4] eukaryotes, its impact on global [5] or individual [6] gene transcription and a mandatory presence in chromatin regardless of variable stoichiometry [7]. Moreover, highly mobile H1 histone subtypes temporarily occupying specific chromatin sites may create unique continuously modulated states in chromatin structure and activity [8]. A weakly defined function of histone H1 is likely to be caused by a variable abundance of non-allelic variants [9] whose functionality could be occasionally altered by site-specific covalent modifications [10]. As histone H1 non-allelic variants can be preferentially located both in euchromatin and/or heterochromatin regions [11] and differentially influence gene activity [12], they are thought to act in common to organize chromatin fiber but individually to regulate chromatin local function [13].
A heterogeneous histone H1 family is represented by several variants which may differ in a number and/or quantity depending on a taxon and species [14]. Except for testicular (H1t, H1T2 and HILS1) and oocyte-specific (H1oo) histone H1 variants, seven ubiquitously expressed somatic subtypes (H1.1–H1.5, H10 and H1x) have been revealed in mammals [15]. Avian erythrocyte histone H1 family is represented by six or seven non-allelic subtypes that form a species-specific set of proteins [16]. A fully sequenced collection of chicken histone H1 contains six subtypes, H1.a, H1.a′, H1.b, H1.c, H1.c′ and H1.d, which differ in length and sequence of amino acid chains [17]. As compared to the histone H1 complement in the chicken [16], an extra subtype H1.z and lack of subtype H1.a′ have been detected in other species [16,18–20].
The occurrence of allelic forms among histone H1 subtypes in plants [21], mammals [22] and humans [23] appears to create an additional layer of histone H1 microheterogeneity. During our work aimed at searching for allelic variations of avian histone H1, we have found two categories of subtypes. The first category, present in a vast majority of avian species screened, encompasses polymorphic subtypes H1.a [24,25], H1.b [18,19] and H1.z [18,20] that are represented by two or three allelic variants while the second category that includes subtypes H1.c, H1.c′ and H1.d has been so far regarded as more homogeneous. The latter subtypes tended to create a relatively invariable triangle-shaped pattern in two-dimensional polyacrylamide gels typically seen in several species (quail, goose and duck) [16]. Since we have found a phenotypic diversity of histone H1.c in a pheasant population [26], an attempt was made to verify whether this subtype is polymorphic in Guinea fowl as well.
Here, we present evidence for a polymorphic variation in Guinea fowl erythrocyte histones H1.b and H1.c. As revealed by using a two-dimensional polyacrylamide gel screening, the histone H1.b is represented by alloforms H1.b1 and H1.b2, and the histone H1.c is represented by alloforms H1.c1 and H1.c2. While b1 and b2, and c1 and c2 phenotypes were present in both Guinea fowl populations, the b1b2 and c1c2 phenotypes were lacking in white-feathered birds (fixation index F = 1). A differential SDS-polyacrylamide gel migration of the C-peptides released from H1.b and H1.c alloforms following cleavage with N-bromosuccinimide (NBS), and digestion with α-chymotrypsin or Staphylococcus aureus protease V8, seems to indicate that these proteins differ in their amino acid composition in a region spanning the C-terminal part of the globular domain and/or whole C-terminal domain.
2 Material and methods
2.1 Animals
Whole blood samples for histone H1 isolation were collected separately from 34 Guinea fowl individuals belonging to separate white- and black-feathered subpopulations bred at the Department of Poultry Breeding of the University of Technology and Life Sciences in Bydgoszcz, Poland.
2.2 Isolation of erythrocyte nuclei
The blood samples collected into SSC solution (0.15 M NaCl and 0.015 M sodium citrate) containing 1 mM phenylmethylsulfonyl fluoride (PMSF) as a protease inhibitor were centrifuged at a low speed and then erythrocyte pellets were washed twice with the same solution. The purified nuclei were isolated from the washed erythrocyte pellet by using 3% saponin in 0.1 M sodium phosphate buffer, pH 7.0, supplemented with 0.9% NaCl and 1 mM PMSF [27]. The lysed nuclei were washed three more times with 0.9% NaCl in the above buffer containing 1 mM PMSF.
2.3 Extraction of acid-soluble proteins
Acid-soluble proteins were extracted from the purified erythrocyte nuclei by a gentle homogenization with 1 M perchloric acid solution. The pellet obtained after centrifugation was subsequently homogenized with the solution containing 0.5 M perchloric acid. The proteins were precipitated from the pooled supernatants with 20% trichloroacetic acid and air-dried after washing with acetone acidified with HCl (500:2, v/v) followed by pure acetone. Protein preparations were dissolved in a sample buffer (1 mg/200 μL) containing 8 M urea, 0.9 M acetic acid and 10% 2-mercaptoethanol (2-ME).
2.4 Electrophoresis
Histone H1 preparations were analyzed in a two-dimensional polyacrylamide gel. In a first dimension, the proteins were resolved in an acetic acid-urea polyacrylamide gel (15% acrylamide, 0.5% N,N’-methylenebisacrylamide, 8 M urea, 0.9 M acetic acid). The Coomassie Blue R-250 stained stripes of histone H1 were cut out from the gel and incubated twice in an adaptation buffer (2.1% SDS, 2% 2-ME, 10% glycerol, 0.124 M Tris-HCl, pH 6.8) for 15 min. The equilibrated stripes were then electrophoresed in a second dimension in an SDS-polyacrylamide slab gel (13.5% acrylamide, 0.36% N′,N′-methylenebisacrylamide, 0.1% SDS).
To obtain a sufficient amount of pure protein for chemical cleavage and enzymatic digestion, on average, ten bands of the appropriate histone H1.b or H1.c alloform which had been resolved in the acetic acid-urea polyacrylamide gel were separately collected and incubated in the adaptation buffer (see above). Then, the equilibrated gel pieces were electrophoresed in a preparative SDS polyacrylamide gel to concentrate the protein and remove any contamination [28].
2.5 Chemical cleavage and enzymatic digestion
The excised bands with concentrated histone H1.b or H1.c alloforms were soaked twice with 1 mL solution of 0.1% N-bromosuccimide (NBS) in 50% acetic acid. After 30 min incubation, the reaction was repeated with freshly prepared NBS solution. Prior to electrophoresis in one dimension 13.5% SDS-polyacrylamide gel, the gel stripes were equilibrated (2 × 15 min) in the adaptation buffer (see above).
Enzymatic digestion of histone H1.b or H1.c alloforms with α-chymotrypsin or S. aureus protease V8 was conducted directly in a stacking SDS-polyacrylamide gel. In both cases, the bands with concentrated protein excised from the preparative gel were soaked (2 × 15 min) in the incubation buffer consisting of 0.1% SDS, 10% glycerol, 0.125 M Tris-HCl, pH 6.8 and 1 mM EDTA. Then, the equilibrated gel pieces were put inside a well in the SDS stacking polyacrylamide gel and overlaid with 2 μL aliquot of the appropriate enzyme dissolved in the incubation buffer (conc. 0.5 mg/500 μL).
Two-dimensional gel images were captured by Doc-Print II gel documentation system (Vilber Lourmat) and processed by using ImageJ 1.42q software (www. rsbweb.nih.gov/ij). The volume of each protein spot was measured as a level of grey in the two-dimensional gel images from three independent individuals. The volume of protein spots was expressed as a percentage of H1.b or H1.c spot(s) relative to all histone H1 spots in the preparation. The coefficient of variation (CV) was calculated as a ratio of standard deviation and mean value. The ratio of protein amount in double spots in heterozygotes was assessed by measuring the volume of each protein constituent within a freehand selected boundary.
3 Results
3.1 Polymorphic variation of erythrocyte histone H1.b and H1.c loci in Guinea fowl population
Histone H1.b and H1.c were identified along with remaining histone H1 subtypes (H1.a, H1.c’, H1.d and H1.z) in the gel patterns of perchloric acid-soluble protein fraction extracted from Guinea fowl erythrocyte nuclei. In a first dimension acetic acid-urea polyacrylamide gel, the adjacent histone H1.b and histone H1.c bands migrated with similar electrophoretic mobilities in all preparations screened (Fig. 1). More complex patterns of histone H1.b and histone H1.c migration were apparent in a second dimension SDS-polyacrylamide gel (Fig. 2A). A relatively stable migration of histone H1.c′ and H1.d was employed to distinguish between slow (H1.b1 and H1.c1) and fast migrating (H1.b2 and H1.c2) alloforms of the H1.b and H1.c subtypes, respectively. While slow b1 and c1 spots migrated with similar mobilities as those of H1.c′, the faster spots b2 and c2 migrated closer to histone H1.d (Fig. 2A). Differential electrophoretic mobilities of histone H1.b and H1.c alloforms both in the two dimension polyacrylamide gel (Fig. 2A) and one dimension SDS-gel (Fig. 2B) appear to indicate that slower moving H1.b1 and H1.c1 alloforms may differ from faster migrating H1.b2 and H1.c2 counterparts in apparent molecular weights. These alloforms were shown to combine (Fig. 2A) to form three genotypes of histone H1.b (b1b1, b2b2 and b1b2) and histone H1.c (c1c1, c2c2 and c1c2). The phenotypes b1, b2, c1 and c2 contain a single protein, H1.b1, H1.b2, H1.c1 and H1.c2, respectively, while the phenotypes b1b2 and c1c2 are composed of both H1.b1 and H1.b2 or H1.c1 and H1c2 variants. The CV calculated for the histone H1.b and histone H1.c protein spots in all Guinea fowl phenotypes was below a threshold of 0.25 (Table 1), indicating a low variability in the relative spot density between the protein preparations. The volumes of histone H1b and H1c spots in heterozygous individuals were measured in the gel patterns of total histone H1 from three independent individuals and expressed as a mean of grey level. The following results were obtained: 103.82 ± 1.55 for b1 and 103.41 ± 1.85 for b2 in the individuals b1b2 and 104.52 ± 0.38 and 102.77 ± 0.72 for c1 and c2 in the individuals c1c2. The ratio of the spots in the heterozygotes approaching the value 1:1 demonstrates a codominant nature of the constituent alleles at a locus.
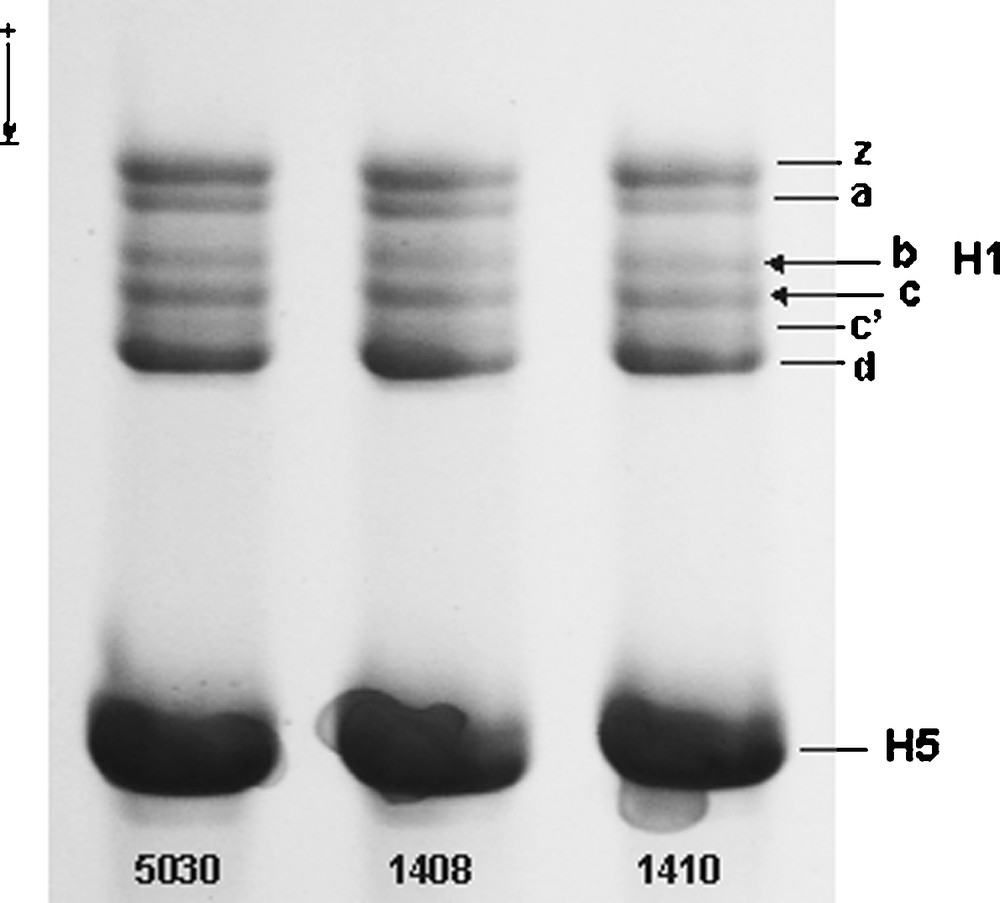
Non-allelic components of the total preparation of erythrocyte linker histone from three individuals of Guinea fowl. Approximately 5 μL aliquots of total protein dissolved in a sample buffer (see Materials and Methods) were resolved in an acetic acid-urea polyacrylamide gel into six histone H1 non-allelic variants (z, a, b, c, c′, d) and histone H5. Single histone H1.b and H1.c bands (arrows), located between subtypes H1.a and H1.c′, migrated with the same rate in the histone H1 gel patterns irrespective of the phenotype of numbered individuals: 1410 (b1/c1), 1408 (b2/c2) and 5030 (b1b2/c1c2). The histone H1.b and H1.c phenotypes were assessed by inspecting two-dimensional polyacrylamide gel patterns (Fig. 2) of the total H1 preparations from appropriate individuals detected by a population screening. H5, histone H5. Masquer
Non-allelic components of the total preparation of erythrocyte linker histone from three individuals of Guinea fowl. Approximately 5 μL aliquots of total protein dissolved in a sample buffer (see Materials and Methods) were resolved in an acetic acid-urea polyacrylamide gel ... Lire la suite
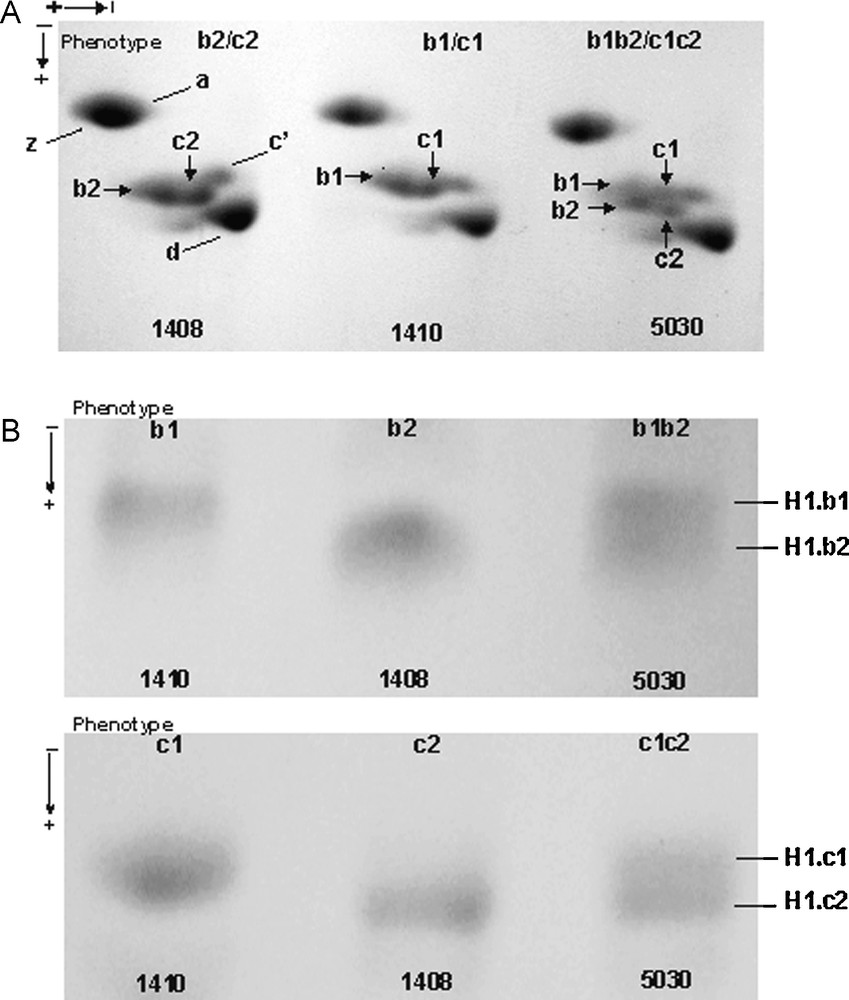
Phenotypic variation in Guinea fowl erythrocyte histone H1.b and histone H1.c in a two-dimensional polyacrylamide gel. (A) Three phenotypes of histone H1.b and histone H1.c, b1 and c1 (individual 1410), b2 and c2 (individual 1408), b1b2 and c1c2 (individual 5030) were revealed. (B) The histone H1.b and histone H1.c bands from the individuals with different phenotypes were cut out from a preparative gel and reelectrophoresed in one dimension SDS polyacrylamide gel. In both two-dimension (A) and one-dimension SDS-gel (B), differently migrating single spots (A) or bands (B) in the phenotypes b1 and c1, and b2 and c2, and a double spot (A) or a double band (B) in the phenotypes b1b2 and c1c2 were identified. Masquer
Phenotypic variation in Guinea fowl erythrocyte histone H1.b and histone H1.c in a two-dimensional polyacrylamide gel. (A) Three phenotypes of histone H1.b and histone H1.c, b1 and c1 (individual 1410), b2 and c2 (individual 1408), b1b2 and c1c2 (individual 5030) ... Lire la suite
Average coefficient of variation (CV = SD/mean) of the volume of histone H1.b and H1.c spots for particular Guinea fowl phenotypes at the H1.b and H1.c loci. The volume of protein spots, measured as a level of grey (in pixels) in the two-dimensional gel images from three independent individuals, was expressed as a percentage of H1.b spot(s) relative to all histone H1 spots in the preparation. The CV was calculated as a ratio of standard deviation and mean value.
| Phenotype | Histone H1.b Mean ± SD |
CVa | Phenotype | Histone H1.c Mean ± SD |
CVa |
| b1 | 20.60 ± 0.52 | 0.025 | c1 | 20.0 ± 1.0 | 0.050 |
| b2 | 21.46 ± 0.72 | 0.033 | c2 | 19.0 ± 0.7 | 0.037 |
| b1b2 | 22.46 ± 1.01 | 0.044 | c1c2 | 23.1 ± 1.0 | 0.043 |
a CV values below 0.25 indicate a low variability.
The results presented in Tables 2 and 3 show a differential structure of Guinea fowl populations. While the black-feathered population conformed to Hardy-Weinberg proportions (histone H1.b χ2 = 1.96, p = 0.16 and histone H1.c χ2 = 0.64, p = 0.72), the genotype frequency of white-feathered birds deviated considerably from expected Hardy-Weinberg equilibrium for both loci (χ2 = 18.0, d.f = 1, p << 0.001). The inbreeding coefficient (F) equals 0.354 and 0.20 for histones H1.b and H1.c, respectively, in black-feathered subpopulation and, as expected, equals 1 for both H1 loci in white-feathered birds, indicating a possible operation of inbreeding in the tested Guinea fowl group. Thus, the genetic diversity considering the total Guinea fowl group indicated a departure from Hardy-Weinberg proportions (FIS = 0.610 and 0.634 for H1.b and H1.c loci, respectively) between tested subpopulations as well as in the entire population (FIT = 0.637). The differences in allele distribution between both strains probed using the Fisher's exact test were statistically significant (p < 0.001 for H1.b and p = 0.002 for H1.c).
Characteristics of Guinea fowl populations at locus H1.b.
| Population | Genotype | Number of individuals Observed/Expected |
Frequency of genotype Observed/Expected |
Allele | Frequency of allele |
| White-feathered birds | b1b1 b2b2 b1b2 |
15/12.49 3/0.5 0/5.0 |
0.833/0.693 0.167/0.027 0/0.278 |
b
1
b 2 |
0.833 0.167 |
| χ2 = 18.0, p << 0.001; F = 1 | |||||
| Black-feathered birds | b1b1 b2b2 b1b2 |
7/5.62 4/2.65 5/7.72 |
0.437/0.351 0.25/0.165 0.312/0.482 |
b
1
b 2 |
0.593 0.407 |
| χ2 = 1.96, p = 0.16; F = 0.354 |
Characteristics of Guinea fowl populations at locus H1.c.
| Population | Genotype | Number of individuals Observed/Expected |
Frequency of genotype Observed/Expected |
Allele | Frequency of allele |
| White-feathered birds | c1c1 c2c2 c1c2 |
10/5.54 8/3.56 0/8.89 |
0.55/0.30 0.44/0.20 0/0.49 |
c
1
c 2 |
0.550 0.440 |
| χ2 = 18.0, p << 0.001; F = 1 | |||||
| Black-feathered birds | c1c1 c2c2 c1c2 |
7/6.25 3/2.25 6/7.50 |
0.437/0.39 0.187/0.14 0.375/0.469 |
c
1
c 2 |
0.625 0.375 |
| χ2 = 0.64, p = 0.72; F = 0.20 |
3.2 Identification of a variable protein segment between the alloforms of H1.b and H1.c histones
To obtain polypeptide maps for identification of a region in H1.b and H1.c molecules responsible for differences between the alloforms, the appropriate protein bands from homozygous individuals were separately concentrated in a preparative 13.5% SDS-gel after a prior resolution in the acetic acid-urea polyacrylamide gel. Histone H1 alloforms were freed from a contaminating histone H1.c′, then in-gel treated with NBS, α-chymotrypsin or S. aureus protease V8 to cleave the histone H1 molecule into specific peptides.
The NBS cleavage of histone H1.c alloforms at a single Tyr residue (Figs. 3 and 4) resulted only in C-terminal peptides in the SDS-polyacrylamide gel because low molecular weight N-terminal peptides could not be detected by staining with Coomassie Blue. As the C-terminal peptide derived from either H1.b1 or H1.c1 alloform migrated slower than its counterpart released from the H1.b2 or H1.c2 alloform, the expected differences in amino acid sequences between tested alloforms might be located in the C-terminal region.
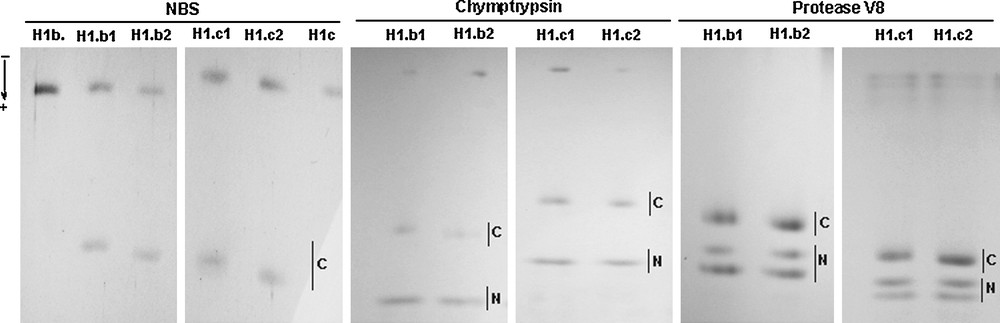
N-bromosuccinimide (NBS) chemical cleavage and enzymatic digestion with α-chymotrypsin and Staphylococcus aureus protease V8 of histone H1.b and histone H1.c alloforms. The NBS cleavage of histone H1.b and histone H1.c isoforms resulted in a differential migration of C-peptides (C). Slower moving C-peptides from the histones H1.b1 and H1.c1 and slightly faster migrating C-peptides from the histones H1.b2 and H1.c2 were detected in the SDS-polyacrylamide gel. Moreover, similar rates of the electrophoretic migration of faster moving N-peptides (N) and differential mobilities of the C-peptides (C) released from H1.b and H1.c alloforms by both α-chymotrypsin and protease V8 were also apparent in the SDS-polyacrylamide gel. Masquer
N-bromosuccinimide (NBS) chemical cleavage and enzymatic digestion with α-chymotrypsin and Staphylococcus aureus protease V8 of histone H1.b and histone H1.c alloforms. The NBS cleavage of histone H1.b and histone H1.c isoforms resulted in a differential migration of C-peptides (C). Slower ... Lire la suite
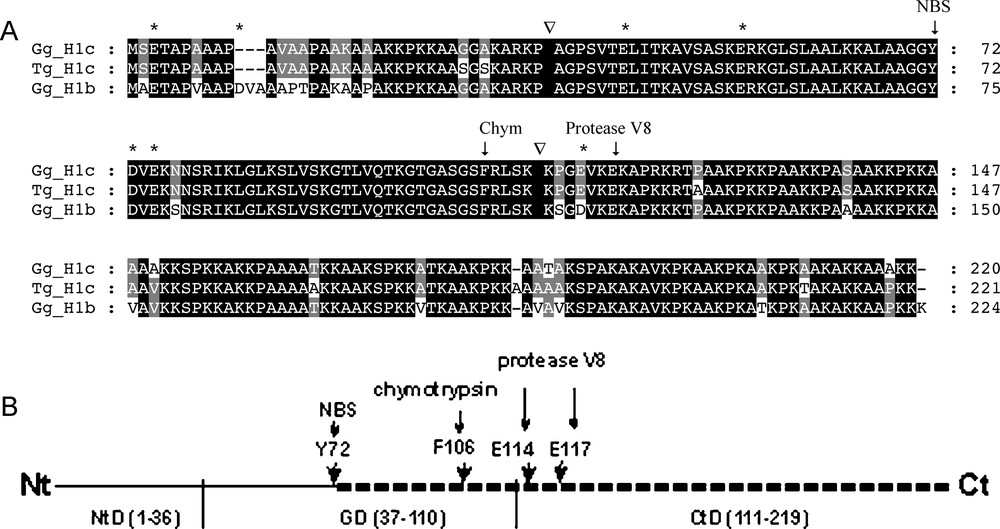
Schematic representation of digestion pattern of histone H1.b and H1.c by N-bromosuccinimide (NBS), chymotrypsin (Chym) and Staphylococcus aureus protease V8. (A) An alignment of available amino acid sequences of avian histones H1.b and H1.c: chicken histone H1.b (Gg, Gallus gallus; GeneBank accession # AAA48787), chicken H1.c (accession # AAA48788) and zebra finch H1.c (Tg, Taeniopygia guttata; accession # ACH44062). The boundaries between histone H1 N-terminal and globular domains as well as between globular nad C-terminal domains are indicted by (▿). The sequence of zebra finch histone H1.c was identical to that of chicken H1.c except for a few amino amino acid substitutions in the N- and C-terminal domains. The vertical arrows above the sequence alignment indicate the sites of cleavage at a single Y residue (NBS), single F residue (chymotrypsin) and the last E residue (protease V8). The remaining acidic amino acid residues (D and E), constituting potential sites for protease V8 cleavage, were designated with asterisks above the alignment. (B) A putative region (dashed line) in the histone H1 molecule harboring a segment differing in amino acid sequence between the alloforms. Domain organization of the histone H1: globular domain (GD 37–110) and flanking regions, N-terminal domain (NtD 1–36) and C-terminal domain (CtD 111–219). The potential cleavage sites for NBS (Y72), α-chymotrypsin (F106) or protease V8 (E114 or E117) are designated by vertical arrows. The numbers refer to the positions of amino acids in the chicken histone H1.c sequence [47] (Fig. 4A). Masquer
Schematic representation of digestion pattern of histone H1.b and H1.c by N-bromosuccinimide (NBS), chymotrypsin (Chym) and Staphylococcus aureus protease V8. (A) An alignment of available amino acid sequences of avian histones H1.b and H1.c: chicken histone H1.b (Gg, Lire la suite
To establish the location of a variable region in the histone H1.b and H1.c alloforms, we have also used α-chymotrypsin and S. aureus protease V8. It appeared (Fig. 3) that digestion with both enzymes provided shorter variable C-terminal peptides that slightly differed in a size and longer invariable N-terminal peptides. As shown in Fig. 3, the C-terminal peptides released by α-chymotrypsin digestion of the histone H1.b1 and H1.c1 alloforms migrated faster in the SDS-polyacrylamide gel than their counterparts from histones H1.b2 and H1.c2. As the chymotrypsin cleaves the peptide bond at the carboxylic side of a single Phe residue, the allele-specific regions of Guinea fowl histone H1.b and H1.c alloforms may have been localized between Arg107 residue and the very C-terminal amino acid (Fig. 4A). A similar pattern of C-peptide migration was also seen (Fig. 3) after digestion of the histone H1 alloforms with S. aureus protease V8. This enzyme can cleave the peptide bonds at Asp or Glu residues, especially at acidic amino acid residues occurring at the beginning of C-terminal domain. As seen in Fig. 3, the protease V8 generated a single slower moving C-peptide released by a presumable digestion at the Glu residue in the C-terminal domain and two faster migrating N-peptides, one of which was likely to be produced by an additional cleavage at the acidic amino acid residue located either in N- or C- terminal domain. A cleavage at the remaining Glu residues in the globular domain would result in much smaller N-peptides that probably would not be visible in the gel. The similar rate of the migration of N-terminal peptides and slightly different mobilities of C-terminal peptides in the SDS-polyacrylamide gel (Fig. 3) following protease V8 digestion of the H1.b and H1.c alloforms appears to indicate that a possible amino acid alteration may be located in the region spanning the onset of C-terminal domain and the very C-terminal end of the molecule.
In general, the above data on the peptide mapping appear to demonstrate that a difference in the amino acid composition in the Guinea fowl histone H1.b and H1.c alloforms may be placed between the NBS-cleaved bond and the C-terminal Lys residue, that is in the C-ending part of H1.c globular domain and/or within the whole C-terminal one (Fig. 4B).
4 Discussion
Unlike linker histone H1.b subtype which is present in chicken tissues in relatively comparable proportions, the subtype H1.c is expressed at a low level in actively replicating immature tissues and significantly increases in nonreplicating cells [29,30]. Chicken erythroid histones H1.b and H1.c encompass 20–23% of total histone H1 [17]. The histones H1.b and H1.c were identified in the gel patterns of total erythrocyte histone H1 in other avian species as well [16]. Usually, histone H1.b moved as a single band between subtypes H1.a and H1.c′ in the acetic acid-urea polyacrylamide gel whereas histone H1.c migrated as a single spot close to the histone H1.d in the two dimensional polyacrylamide gel. While the relative migration of Guinea fowl subtypes H1.b and H1.c in the acetic acid-urea polyacrylamide gel was quite similar to that in other avian species [16], these proteins migrated in the two dimensional polyacrylamide gel in the immediate vicinity of histone H1.d creating a pattern closely resembling that seen in the chicken [16]. It seems that in comparison to a majority of other avian H1.b and H1.c subtypes [16,20], the Guinea fowl histone H1.b and H1.c possess slightly higher apparent molecular weights.
So far, three out of six linker histone subtypes in erythroid cells, i.e. H1.a [18,24,25], H1.b [18,19] and H1.z [18,20,31] were identified to be polymorphic in at least two avian species. In addition to the mentioned polymorphic subtypes H1.a, H1.b and H1.z, the polymorphic variation of the Grey partridge histone H1.a′ [32] and the phenotypic variation of pheasant histone H1.c [26] was recently identified. Like certain polymorphic histone H1 subtypes with two alleles at a locus which differed in a frequency in the population [18,20,25], the Guinea fowl erythrocyte subtypes H1.b and H1.c are represented either by frequent alloforms H1.b1 and H1.c1 or rarer ones H1.b2 and H1.c2, which may form phenotypes b1, b2 and b1b2 or c1, c2 and c1c2, respectively, differently distributed across tested Guinea fowl strains. A lack of heterozygotes in the white-feathered population and some heterozygote deficiency in the black-feathered population may result from inbreeding or drift which usually operate on small sized populations [33], as exemplified by our Guinea fowl birds which had been transferred to a breeding facility from private stocks.
As the Guinea fowl histone H1.b and H1.c alloforms identified in the SDS-polyacrylamide gel differ in their apparent molecular weights, the polymorphism of both subtypes is likely to be due to an insertion/deletion or nonconservative substitution that may influence the mass of the protein rather than a single basic-to-acidic amino acid replacement that would be rather expected to alter a charge of the affected alloform and, hence, its migration in the acetic acid-urea polyacrylamide gel [25]. Nonetheless, a different mobility of histone H5 electromorphs, H5.a and H5.b, that represented Glu/Arg polymorphism has been observed in the SDS polyacrylamide gel [34].
Histone H1 structure consists of a highly conservative and evolutionary stable central globular domain (∼80 residues) and less conservative and variable short N-terminal (∼30–40 residues) and long C-terminal (∼100 residues) tails [35,36]. The C-terminal domain significantly influences histone H1 functioning [37]. It stabilizes nucleosome arrays [38] by linking up the DNA strands [39] and competes for binding sites with architectural [40] and regulatory proteins [41] to modulate chromatin events. Besides, the C-terminal domain was often found to harbor differences between alloforms of the polymorphic variants of avian erythrocyte histone H1 [24,25,31]. Our results on chemical cleavage with NBS and proteolytic digestion with α-chymotrypsin and S. aureus protease V8 of the Guinea fowl histone H1 alloforms, schematically depicted in Fig. 4B, also suggest that a variable region may be located in the C-terminal part of the molecule.
Since the histone H1 C-terminal domain was classified as an intrinsically disordered region [42], it could have remained in alternative conformational states depending on specific amino acid composition [43]. Such sequence and structural disorders may contribute greatly to molecular recognition processes by diversifying the interactions between protein–protein and protein–DNA [44]. By using the PrDOS [45], the C-terminal domains in chicken histone H1 subtypes, whose sequences might be related to those of Guinea fowl (see Fig. 4A for alignment of known avian histone H1.b and H1.c sequences), has been predicted to be disordered. They may contain patches of amino acids capable of adopting distinctive conformational states during transition from unbound to bound state [46] which may likely correspond to a remodeled recognition mode for DNA and partner proteins [41]. Similarly, an altered amino acid sequence of the histone H1 alloforms may confer a specific conformation which, in turn, may change their functionality. Therefore, one may assume that a modulated architectural and regulatory function [5] of the polymorphic histone H1 subtypes may differentially influence the structure and/or function of Guinea fowl chromatin.
Conflict of interest statement
No conflict of interest.
Acknowledgements
We would like to thank Professor Zenon Bernacki and Dr. Marek Adamski, Department of Poultry Breeding, University of Technology and Agriculture, Bydgoszcz, Poland, for allowing us to use their bird stocks.