

1 Introduction
Monitoring biodiversity changes, i.e., assessing the state of biodiversity at different points in space and time, is necessary for efficient biodiversity conservation. Information is required to establish a link between the state of biodiversity and human pressures, to propose scenarios based on forecasted evolutions of pressures and society responses and, in turn, to contribute to the development of adequate policies [1].
To obtain this information, a wide range of monitoring schemes exists, from long-term ecological research sites (LTER) to remote sensing [2]. Depending on protocols and the type of information provided, schemes correspond to different scientific questions and may be qualified as passive, targeted or adaptive monitoring, respectively [3–5].
To design an efficient and sufficiently complete biodiversity observation system, comparable in scope and ambition to those available to assess climatic, social and economic dynamics, it is necessary to identify the relevance of the various schemes and determine, in consequence, the effort to be allocated to each one.
The present article focuses on the unique and promising perspectives offered by extensive monitoring, in which a set of species are simultaneously monitored at a large number of sites within a large territory in which few variables per species are regularly recorded. Such an extensive monitoring is usually performed by networks of human observers. In this paper, we first examine scientific compromises that must be made in terms of protocols, and we then review the major scientific achievements that have taken place in the domain of ecology as a result of extensive monitoring programmes, from documenting species and community patterns to testing hypotheses.
2 Monitoring biodiversity: two contrasting options
Since global monitoring efforts cannot be infinitely extended, choices have to be made as to the biodiversity components to be monitored, the quantities to be estimated and the distribution of observation actions in space and time [6]. A monitoring scheme is the result of a compromise between three parameters: the size of the area surveyed, the density of sites sampled within this area and the observation effort per site (Fig. 1). The relative importance given to each of these three parameters within a monitoring scheme has major consequences on its ability to address various scientific questions. We compare here these consequences for a given territory size in relation to the intensity of the sampling effort per site versus site density.
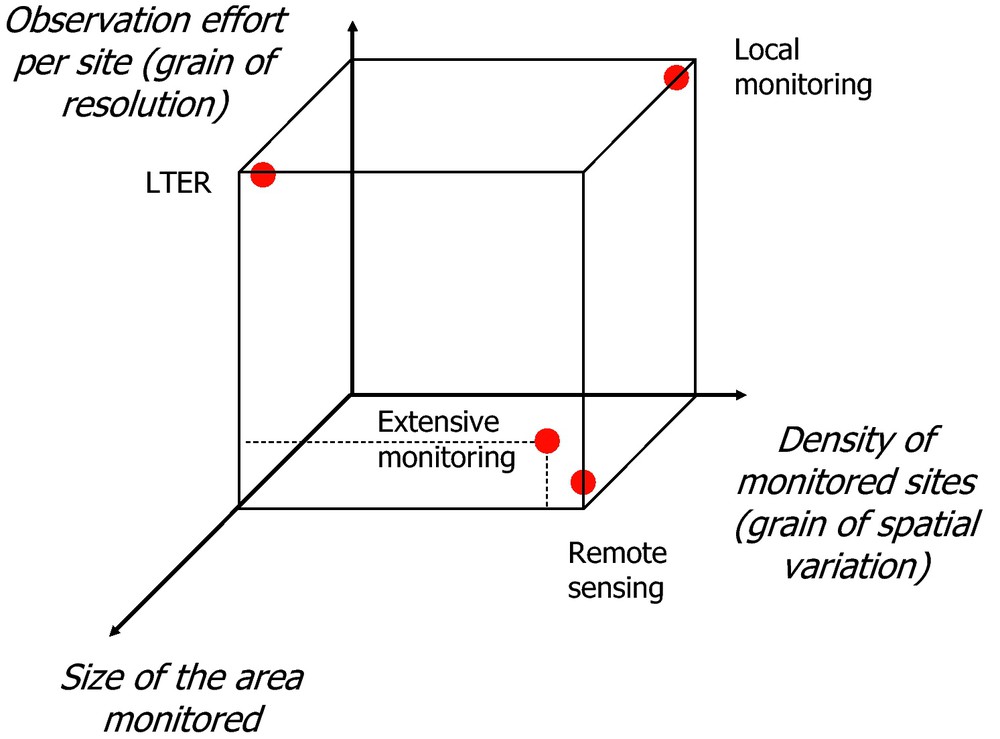
Contrasted options for monitoring biodiversity, depending on the size of the area monitored, the density of sites and the observation effort per site, with different consequences on the grain of resolution and spatial variation and, therefore, on precision and generality of the ecological patterns observed.
2.1 The “site-focused” option: fine-grained site resolution
With few sites but a large observation effort per site, the “site-focused” option provides a detailed description of an ecosystem and attempts to characterise detailed interactions within species and among species, and between species and their environment. The objective is to analyse ecosystem functioning by studying local phenomena likely to have a high level of generality and to document so-called ecological laws. “Site-focused” observations have been very important for ecosystem ecology, e.g., by characterising the extent of nutrient release after deforestation [7].
Because the aim of such endeavours is to understand fundamental ecological mechanisms, observers usually focus on very particular sites such as the most pristine ones in order to minimise human impacts on what is observed, or sites claimed as being most representative of a particular land use or simple ecosystem. However, the representativeness of a few sites is implicitly based on the assumption of a low variability among sites of the same type, and this assumption is difficult to evaluate.
Corresponding to a “targeted monitoring” approach, the site-focused option typically aims at discriminating among a priori hypotheses [3]. By adding sites, replication in space usually has two goals: to characterise the environmental range over which the studied phenomenon occurs; to obtain a comparative design by minimising most of the environmental variation except over a few selected variables of interest, in order to provide evidence for the relationship between the studied phenomenon and these variables as efficiently as possible.
Since the number of sites that can be monitored is inevitably limited by the large sampling effort per site, information obtained from the limited number of monitored sites does not adequately capture the multi-factorial spatial covariation between humans and biodiversity. This approach therefore generally documents coarse-grained spatial variations (Fig. 2A).
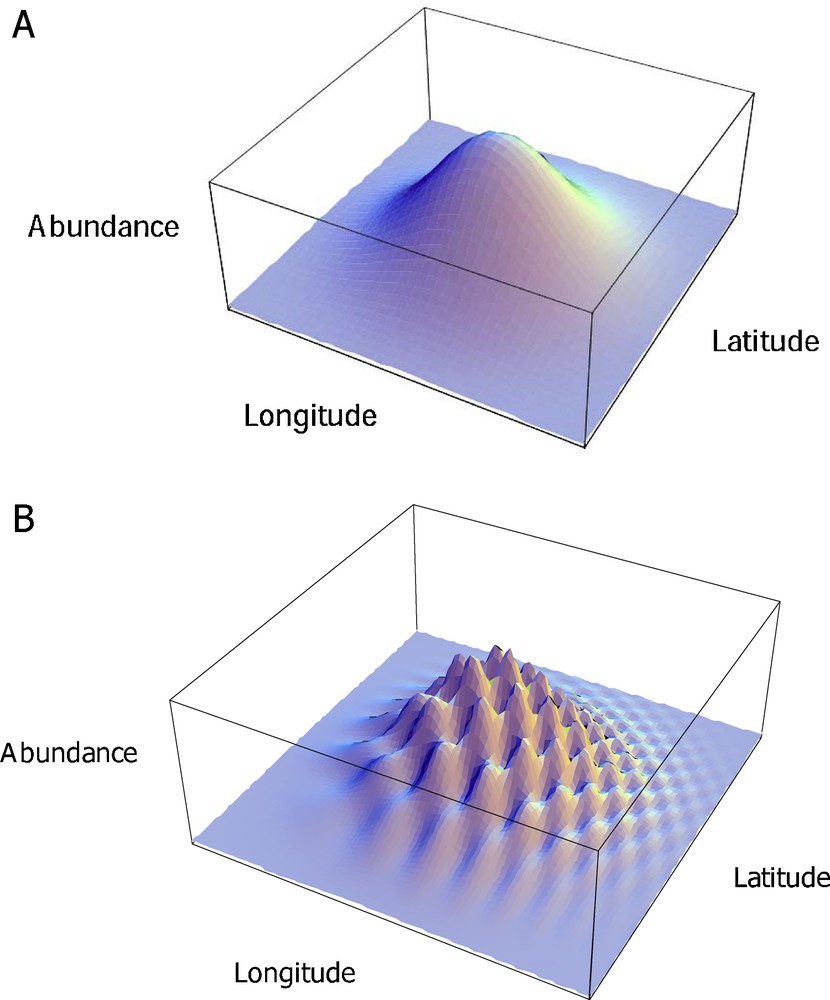
Two estimates of the spatial variation of abundance of a species, fitted with bell-shaped curves along the latitude and longitude, depending on the number of sites monitored. A. Low site density. Coarse-grained spatial variation is characterised. B. High site density. Fine-grained spatial variation is characterised.
As a result, on its own, “site-focused” monitoring cannot fulfil the two aims of a global biodiversity observation scheme: to characterize the state of biodiversity in all types of ecosystems of the area monitored; hence to link such states to the numerous, interacting, human-induced pressures. For example, NEON, a recent initiative to document ecosystem changes in the USA, defines 20 ecological domains with three sites instrumented per domain, in which different ecological variables are intensively monitored [8]. Obviously, monitoring biodiversity at 60 sites at the scale of the USA cannot be sufficient to describe and predict the full range of spatially fine-grained biodiversity variation due to the numerous interacting factors relating human uses and biodiversity at all scales.
Global biodiversity information facility (GBIF)-like systems can establish relationships between ‘site-focused’ studies by an effort in assembling data and solving problems related to data management and conservation. In such a context, meta-analyses make it possible to characterise spatially coarse-grained diversity with low temporal diversity, e.g., morphological variation [9]. However, it is difficult to assess fine-scaled temporal and spatial variations of biodiversity with these types of systems and methods, given the disparity of time periods, protocols, species and traits recorded in the different studies, thus requiring additional observation systems [10].
2.2 The extensive monitoring option named as “fine-grained spatial variation”
Alternatively, a high density of sites monitored makes it possible to focus on general trends over a large territory, characterising fine-grained spatial variations of biodiversity as they unfold. Since total observation efforts are limited, such schemes result in a coarse-grained resolution per site, due to the limited observation effort per site (Fig. 1). Such schemes, referred to below as “extensive monitoring” schemes, have contributed major information about the dynamics of biodiversity, and particularly of common species [10].
Drawing inferences from observations based on inductive reasoning, the extensive monitoring philosophy differs from mainstream scientific practice based on deductive reasoning with a priori hypotheses, and has been suspected of leading to a waste of energy [3]. Nevertheless, climate monitoring and long-term data series, in general, illustrate the benefits of such a surveillance approach. With relevant scientific protocols, this approach can combine passive monitoring to address patterns, targeted monitoring to test hypotheses, and adaptive monitoring to evaluate the effects of various policies [3].
Remote sensing is the extreme case of such an option, assessing the extent and productivity of different types of ecosystems, types defined at the scale of remote sensing resolution. For example, remote sensing data indicate that humans appropriate an average of 25% of the net primary productivity for their own needs [11]. This figure corresponds to the proportion of birds that would have disappeared due to human-induced land-use changes, a piece of information provided by a meta-analysis [12]. Such a correspondence could be expected, as the ecosystem production appropriated by humans does not benefit wild species, and evidence for it contributes to our understanding of human effects on biodiversity. However, remote sensing provides a relatively low resolution per site and therefore cannot adequately assess the distribution of species diversity and, as a consequence, the variation in most of the components of biological diversity.
3 Organisation schemes for extensive monitoring
Human observers are usually necessary to monitor most biodiversity groups, to sample and recognise species, with the exception of microorganisms for which automatic devices can be used to estimate their diversity patterns. Large numbers of human observers are thus required for extensive monitoring, given the large number of sites surveyed.
Citizen science programmes – where volunteers from the public participate in scientific programmes in conjunction with research laboratories – can fulfil this requirement. Such programmes can be based on the coordination of a network of observers over a complete territory to regularly monitor biological diversity at numerous sites. In Europe, they currently involve nearly 50,000 individuals within 500 networks [13], focusing on birds (38%), mammals (23%), insects (17%), plants (15%), and reptiles and amphibians (13%), illustrating the potential of these types of networks for monitoring biodiversity.
3.1 Protocols
Extensive monitoring protocols have to take into account the methodological requirements necessary to meet ambitious scientific objectives, as well as constraints associated with human observers [10]. Based on these considerations and past experience, a general outline for such protocols can be proposed (Table 1). They are detailed below.
Conditions proposed for extensive monitoring protocols over a large territory to maximise scientific output.
| Characteristics of the protocol | Scientific advantages |
| Density of sites sampled | Assessment of fine-grained spatial variation, of diffuse cumulative interactions and of remote environmental effects |
| Monitoring of each species within a community | Assessment of the state of the community Distinction of specific versus general impacts, comparing species responses based on their ecological traits |
| Standardised methods of observation | Biodiversity measures can be compared in space and time (phenology, abundance, etc.) |
| Regular sampling (depends on generation times: annual for long-lived species like birds, but might be shorter for other species, and different in non-seasonal environments) | Assessment of fine-grained temporal variation, which can be related to environmental factors of comparable variability such as climate and land-use factors |
3.1.1 Spatial sampling and human observers
The density of monitored sites should be large enough to survey the whole range of gradients of environmental and human pressures. This density should be at least at the scale of some major local environmental factors in play, especially those concerning land use. Nevertheless, whatever the site density, it will never be large enough to encompass all ecological phenomena [3]. Overall, density should increase when a large number of environmental factors interact, and/or fine-grained spatial variations are prominent (Fig. 2B).
Designing an optimal sampling stratification of sites a priori is difficult because the relevance of many factors will be revealed a posteriori and can even change with time as a result of interaction with global changes. Some stratification can be decided beforehand, based on the diversity of the habitats identified, in particular, by remote sensing with the Corine land cover (CLC) in Europe, for example.
Citizen science could make the requirements and characteristics of any a priori sampling design difficult to achieve, depending on the number of sufficiently skilled human observers. Hence, a pragmatic option may be a pure random design, accounting for practical constraints such as ease of access and observer availability. A posteriori, networks of human observers often meet a priori requirements [14,15].
Moreover, additional knowledge about the distribution of environmental factors and human pressures can be obtained after geolocalisation of sampling sites as a result of the interoperability of many available GIS databases that describe many different types of environmental and land-use variables. Such information makes it possible to obtain post-stratified samples with respect to any variable of interest and, therefore, to set up flexible, multi-use monitoring schemes whose scientific interest loosely depends on the initial choice of sampling stratification. Finally, observations may be motivated by specific questions. In this case, they could be limited to specific sites, leading to targeted or adaptive monitoring [3].
3.1.2 Biodiversity variables monitored
Due to the trade-off between the number of sites monitored and the effort per site (Fig. 1), only a restricted number of biodiversity and ecosystem variables can be monitored. Thus, to limit the observation effort, the biodiversity variables recorded have to be carefully chosen in relation to the main questions addressed. Phenology, a category of variables related to ecophysiological properties and to fitness [16], is of increasing importance for extensive monitoring, especially in the context of global change.
Sampling the abundances of the different species of a community (i.e., a set of species similar from a phylogenetic and functional point of view such as passerines) and estimating community composition has often been considered for scientific and practical reasons. Compared to data from the same number of species but from numerous, different communities, documenting composition and abundance of the different species of a same community provides additional scientific information about ecosystem functioning and ecosystem services, linking species abundances to their biological traits [17,18]. In practice, such sampling is easily possible because a human observer is usually able to identify the whole set of species belonging to a same community.
A consequence, not a goal, of sampling strategies to monitor community composition is to focus on common species since most individuals belong to such species. Such a focus is relevant because ecosystem functioning largely relies on abundant, i.e., common species [17]. In other words, the frequency of common species is likely to indicate the general state of biodiversity, although it might not be representative of the entire range of the community.
As a result of temporal variation, site monitoring should take place on a regular basis, in accordance with the rate of change of the recorded biodiversity variable, which can be rapid in response to fragmentation and/or climate change. More specific requirements that take the effects of spatiotemporal variability, species detectability and the heterogeneity of observers into account have been considered by other authors [6,10].
Atlases of biodiversity, which map species distributions, are a long-standing case of extensive monitoring, where data collected are usually only related to species presence/absence. Since the focus in this case is especially on specific species and habitats (since one of the primary objectives is to map rare species), the protocol often lacks standardisation of effort and replication of observations, meeting only some of the conditions we considered (Table 1).
3.1.3 Improving grains of resolution and of spatial variation
A trade-off between the grain of resolution per site and that of spatial variation results from a limitation of the observation effort. Nevertheless, a sound choice of the variables monitored and sites sampled can improve both grains. A lower number of sites monitored yields a relevant fine-grained spatial picture when spatial relationships between the variables monitored and other variables sampled more exhaustively in space (e.g., by remote sensing) are firmly established. In the same way, several variables monitored per site can yield a high resolution when their relationships with variables not monitored are adequately known. Alternatively, benefits in resolution and spatial variation are small when the information collected is redundant.
4 Species patterns and macro-ecology
By estimating variations in the abundance of species, extensive monitoring provides information about macro-ecological patterns, defined as quantitative descriptions of the abundance and distribution of species considering broad areas and/or a large number of species [19].
4.1 Assessing trends: winners and losers of global change
Assessing the state of biodiversity and comparing species dynamics is one obvious pattern documented. Multi-species monitoring schemes invariably point to species whose numbers are increasing “winners” and others whose numbers are decreasing “losers”.
By combining other pieces of information, hypotheses about the causes of differences between “winners” and “losers” of global change can be tested. For example, species whose distribution areas are characterised by a small temperature amplitude, that could therefore be referred to as “temperature-specialists”, are more sensitive to extreme climatic events associated with climate change than other species [20]. This association between the response to climate change and a species’ thermal niche creates the possibility of hypothesizing as to which species should be a target for conservation efforts, based simply on atlas information when the species’ dynamics is unknown, a common case.
4.1.1 Anticipating future effects of global change
A further step in the assessment of the state of biodiversity is to build scenarios of species dynamics, which can be simple extrapolations, when future changes are expected to follow past and current changes.
Documenting macro-ecological patterns contributes to corroborating models used in scenarios. Niche models point to expected “climate winners” or “losers”, that is, species whose populations are expected to increase or decrease in response to climate change [21]. Extensive monitoring actually revealed a large disadvantage for the expected “climate losers” during the recent episode of climate warming [22,23], corroborating niche models.
4.2 Changes of species abundance distributions
Monitoring fine-grained spatial variation in species abundance offers the possibility of going beyond a mere description of the boundaries of species-area distributions, which show poleward or altitudinal shifts in response to climate change [24,25]. Extensive monitoring also makes it possible to characterise the centre of gravity, variance and kurtosis of this distribution, quantities that heavily depend on the species core-area distribution (Fig. 3).
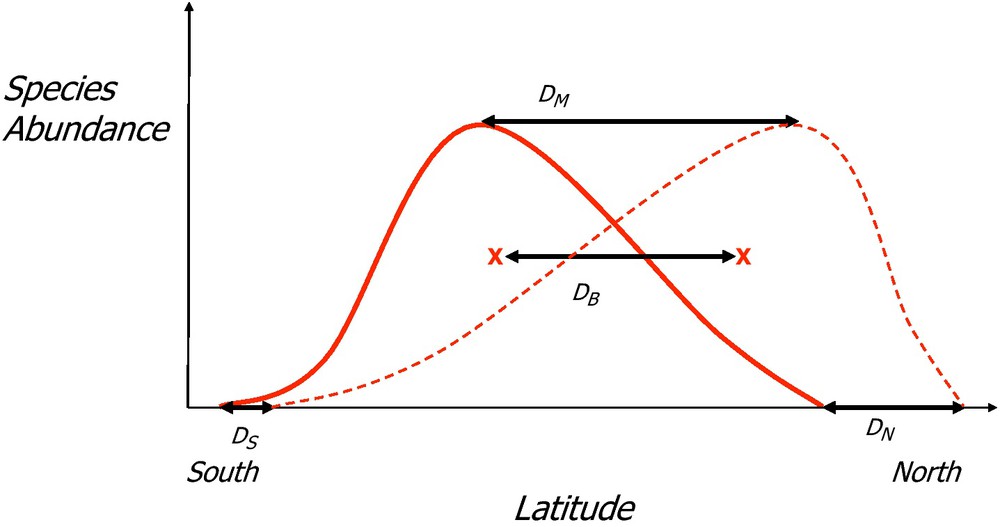
Species distribution shift as a result of climate change. The continuous line represents a former distribution and the hatched line the present species distribution range. x represents the barycentre of the two bell-shaped distribution ranges. DS, DN, DM and DB represent the shifts of the southern and northern edges, mode of variation and barycentre.
Estimating shifts in these core area quantities [26,27] provides at least two additional types of information: when the species monitored are large-range species, core-area shifts might be the sole evidence of species movements, in the absence of species-area distribution edges in the region, a common case in temperate regions; core-area shifts might differ from edge shifts in magnitude and pace [26] because the mechanisms involved differ. Edge displacement requires colonisation of northern sites and/or extirpation from southern sites, while core-area shifts might result from dispersion between established populations.
5 Contributions to community ecology
Because the grains of resolution per site and of spatial variation between sites are submitted to a trade-off (Fig. 1), community ecology patterns and processes depend on observation options. Documenting fine-grained spatial variation of biodiversity provides little and rough population data. With the “site-focused” option, rich information is produced at the population level concerning mechanisms of population interactions and their relationship with community dynamics.
However, the few sites monitored in the “site-focused” option can provide little information on community spatial patterns and processes. In contrast, the high density and large spatial extent of monitored sites contribute to the characterisation of multi-scale spatial effects associated with community ecology, particularly in response to changes in land use and climate [28,29]. Extensive monitoring data should contribute to assessing the relative effect of habitat filtering and species competition in relation to dispersal constraints and random effects, an assessment notoriously difficult since these factors interact and their importance varies at the spatial level [30]. Characterising community functional diversity [17] and partitioning species-trait values in a between and a within community component [31] are major possibilities for further interpretation of these data.
5.1 Community patterns: shifting baselines
A difficulty in assessing overall human impacts on biodiversity is that communities, including those that are the least disturbed by humans, might be gradually shifting, with relatively small changes that are barely observable by humans, and that therefore remain unnoticed. However, the large number of species affected, the directionality and large spatial extent of these changes could lead to major ecological changes at a scale comparable to climate warming and might therefore have major socioeconomic consequences. The term “shifting base-line” has been coined to describe this phenomenon [32].
Detection of shifting base-lines benefits from extensive monitoring but requires, in addition to the description of species patterns, characterisations of community variations.
5.2 Biodiversity indicators that group species
A simple way to characterise community shifts is to aggregate data on a large number of similar species within a same community. By appropriately selecting and combining species, after a priori hypotheses based on their ecology, it is possible to compile the information contained in species changes of abundance into an index, a biodiversity indicator, designed to be sensitive to a specific pressure [47]. Grouping species provides statistical power and gives a representation of the response of the community.
The regular decline of the trophic index of over-fished marine species [33] and of farmland bird species in Europe [34] are examples of shifting base-lines whose ecological consequences might be far-reaching. In fact, the corresponding “farmland bird indicator” is one of the 12 major indicators of sustainable development in Europe (epp.eurostat.ec.europa.eu).
5.3 Relating community-trait variations to global change factors
A more inclusive characterisation of community variation is to compile community traits considering all species, each characterised by the value of the trait considered and its abundance [28]. Variation of within-species variability should be included to characterise community variation when information is available since it could be of a magnitude comparable to species variability [35].
Community indices that average the climatic dependence of the species present can be used to examine community responses to climate change. Northward shifts of bird communities were shown to be slower than that of butterflies, and both were lower than expectations based on the assumption that the thermal dependence of species-area distribution is not changing [26,36]. Ecological consequences of a lag between trophically-related groups could be food availability limitations for predator populations and/or prey proliferation. Prey has in fact been shown to escape from its predator as a result of the difference in a northward shift [37].
Community specialisation might be a general biodiversity indicator to assess ecosystem exposure to global change since this indicator has been shown to decrease with disturbance and habitat fragmentation [38,39]. Moreover, decreasing specialisation could have functional consequences: lower ecosystem productivity because generalist species are less efficient in capturing resources than specialists [40]; lower community stability associated with decreasing landscape diversity because less differentiation of neighbouring ecological networks impairs their cross-regulation [41]. A complicating factor is that patterns of community specialisation and diversity can differ [42], as can be expected from a theoretical point of view when the disturbance is related to enhanced immigration [43,44]. The consequences of these diverging dynamics for biodiversity management and the sound use of biodiversity indicators such as community diversity and specialisation must be thoroughly considered.
6 Detection of unfolding, diffuse, cumulative, interacting and remote effects
Extensive monitoring data are not restricted to recorded species and community patterns. Comparing populations and communities exposed to different environmental factors is a possibility offered by the multiplicity of sites monitored, similar to an experimental approach in which hypotheses are tested [6,45].
Unfolding effects generate new hypotheses, i.e., those that may arise after the monitoring scheme has been set up, and extensive monitoring data offer the possibility to readily test these hypotheses. This possibility could be quite useful because the effects of global change unfold progressively, generating new hypotheses that need to be rapidly tested. This approach generally concerns long-term data and, in particular, observation schemes that readily documented climatic effects on biodiversity when the hypothesis of climate warming gained general acceptance [24].
The detection of diffuse effects – effects that are spatially extensive but of small amplitude per site – benefits from the large number of sites monitored, i.e., their large density and spatial extent (Fig. 1). Consequences of diffuse effects can be quite significant due to their spatial extension and can lead to major ecosystem changes, particularly when ecosystems meet tipping-points. However, they are difficult to demonstrate when few sites are monitored. Diffuse effects of pesticides on several bird species were documented through the common bird census (CBC) in Canada, although the interpretation is difficult and remains correlative [46].
Detection of the effects of cumulative and interactive stressors is also enhanced by both the large number of sites and species monitored. An increase in the number of interacting factors unavoidably generates correlations among them when a restricted space, few sites and/or species are sampled, making it difficult to differentiate between effects. Effects of landscape artificialisation, climate change, etc., can be determined through fine-grained spatial variations and through differences in species sensitivity to these human pressures. For example, the effect of eight different components of agricultural practices on farmland birds in the UK was determined [47], making it possible to build quantitative scenarios of the effect of agricultural policies on bird communities [48].
Finally, detection of remote rebound effects of local policies is improved by the large spatial coverage of observation sites. Remote effects are a well-identified problem in conservation biology. Enforcement of protected areas might readily lead to higher impacts on other sites, the so-called leakage effects outside reserves [49,50].
6.1 Hypothesis testing: false negatives and the precautionary principle
The precautionary principle should benefit from extensive monitoring because sound use of this principle requires a low type II error, or “false negative”, the probability of concluding that there is no effect of the factor tested, when there is actually some effect. A low type II error (equivalently, a high test power) requires a large number of monitored sites, the advantage of extensive monitoring, especially when the factor tested has diffuse spatial effects and/or interacts with several other factors.
Although trivial from a statistical viewpoint, the importance of minimising type II errors has been overlooked with standard scientific practices that generally aim at demonstrating new processes and, as a result, only consider the scientifically accepted, a priori, level of type I error. Risk assessments of genetically modified organisms (GMOs) have not placed enough emphasis on type II errors [51]. Due to the inherent variability in natural systems, Squire et al. [52] estimated that to demonstrate a hypothetical but large effect of the GMOs tested on biodiversity – a decrease in 50% of the abundance of collaterally-affected species – in a spilt-field experiment, it would be necessary to compare more than 50 fields to attain the required statistical power.
7 Perspectives for biodiversity observatories
Geo-Bon [53] is an initiative to obtain a general biodiversity observatory whose aim would be to understand the relationship between humans and biodiversity. To achieve this aim, it would be necessary to combine and develop different existing schemes in a complementary way.
Beyond “site-focused” approaches, extensive monitoring devices that document fine-grained spatial variation of biodiversity over a large territory will play a major role as a result of the scientific advantages outlined in this article (Figs. 1–3), in addition to the social advantages associated with the participatory processes necessary for this scientific approach [15,54].
7.1 Combining observations and modelling
Even when the information is collected and synthesized, it is still difficult to understand biodiversity dynamics in response to global change because biodiversity is complex and changes are numerous, take place at various spatial and temporal scales, and are strongly interdependent as well.
Integrating such complexity requires models that integrate observations and conceptual knowledge about ecosystem functioning, capable of formalising the mechanisms of organisation and functioning of ecological systems [2,53]. Beyond data analysis, an important step for Geo-Bon will be the use of observations to validate and calibrate different models, from population to species and community-based ones.
Coordination of observations and modelling should result in major progress in biodiversity forecasting based on an understanding of the relationship between biological diversity, ecosystem properties and human pressures, and their temporal and spatial variations. To assess the status of threatened species and their major threats, IUCN networks combine and model different monitoring data. This combination leads to the red-list index that summarizes the temporal variation of the conservation status of the species assessed (www.iucn.redlist.org), which provides a quite precise, although incomplete, view of biodiversity dynamics.
Disclosure of interest
The authors declare that they have no conflicts of interest concerning this article.
Acknowledgements
The authors wish to thank Jean-Dominique Lebreton who subjected the manuscript to rigorous scrutiny, and much improved its quality.
Vous devez vous connecter pour continuer.
S'authentifier