

1 Introduction
The roe deer (Capreolus capreolus) is the most abundant and widespread cervid in Europe. Its patterns of space use have been extensively described, in its traditional forest habitat, as well as in the agro-ecosystems, the Mediterranean and mountainous regions it has recently colonized. Adult males are known to be strongly territorial in spring and summer [1–4], and this seems to be the case whatever the habitat and all over the species range [5,6]. In contrast, adult females are not considered as territorial, with the possible exception of a short fawning-site defence period [5,7].
However, spatial relationships between females have never been thoroughly investigated, and some contradictory results have been reported. According to earlier studies based on direct observation [2,4], females are socially ‘tolerant’, sharing overlapping home ranges independent of the spacing system of males [3,6]. However, Vincent et al. [8] did not find any overlap between the home ranges of radio-collared females in a low-density population. In the same population, Bideau et al. [9] further found that the home ranges of young after dispersal did not or only partially overlap those of relatives. In another population, Chapman et al. [10] described overlapping home ranges, but exclusive core areas for both sexes, even between family members. Maublanc (unpublished data) and Marchal et al. [11] found a major decrease in the size and overlap of females’ home ranges from winter to spring in two different populations of field roe deer.
Comparison of the two sexes’ spatial behaviour in contrasting conditions did not clarify the question. In a population of increasing density, Vincent et al. [12] found a decrease in the annual home range size of males but not of females, attributing the difference between the sexes to male territoriality. However, Kjellander et al. [13] showed that both males’ and females’ seasonal ranges decreased as density increased in two contrasting study sites, suggesting the reduction to be a response to increasing social interactions. Finally, the results presented by Wahlström and Kjellander [14], consistent with the prediction of an ‘ideal free’ distribution of females, were not confirmed later: McLoughlin et al., Nilsen et al. and Pettorelli et al. [15–17] showed a relationship between females’ reproductive success and the habitat richness of their home ranges, which is more in agreement with a ‘despotic’ distribution.
Spatial intolerance between females, if any, should be more obvious for high population densities. Moreover, it is not easy to be certain that all the animals living in the same area are monitored in the wild. We therefore conducted an experiment by introducing seven roe deer (three males, four females) in a partly wooded 14.2-ha enclosure, to constitute a small, high-density population (49.3 adults/km2) of marked animals and investigate its spatial organisation. This density was high in comparison with figures published for natural roe deer populations, where density estimates rarely reach 30 deer/km2 [12,18,19]. However, roe deer populations are mostly underestimated and have high growth potential [20], which leads us to believe that such a density can be reached in the wild.
We hypothesized that at least one of the males would defend a territory during spring and summer, the movements of the others being socially restricted (prediction 1). Following the commonly accepted features of female ranging behaviour, we predicted that their home ranges would greatly overlap because of the small size of the enclosure (prediction 2), but that the distances between the females’ arithmetic centres would increase in late spring, because of the fawning-site defence reported in previous studies (prediction 3). Finally, we hypothesized the independence of the spacing systems of the two sexes (prediction 4).
2 Materials and methods
2.1 Study area
The study was carried out from January 2004 to August 2008 in a 14.2-hectare enclosure in the INRA (National Agronomy Research Institute) experimental station of Gardouch, in South-West France (43°22′N 1°40′E). The enclosure included an 8.9 ha area of deciduous woodland, and two fallows of 3.9 and 1.4 ha, which were cut twice a year to allow observation from towers. The commonest tree species in the woodland was the pubescent oak (Quercus pubescens). The other main trees and shrubs were the wild service-tree (Sorbus torminalis), field maple (Acer campestre), common hawthorn (Crataegus monogyna), blackthorn (Prunus spinosa), dog rose (Rosa canina), dogwood (Cornus sanguinea), and wayfaring tree (Viburnum lantana). The undergrowth mainly consisted of brambles (Rubus sp.), privet (Ligustrum vulgare), knee holly (Ruscus aculeatus) and ivy (Hedera helix).
2.2 Study population
In autumn 2003, the enclosure supported three roe deer: two adult females originating from the military area of ETBS (Establishment of Technical Experimentation) near Bourges (France), and a male fawn, born on the spot and son of one of the two females. In November, the three animals were caught and equipped with GPS collars (Lotek 3300), and four individuals similarly equipped were added: two male fawns born in a small enclosure of our experimental station, and two adult females originating from the Chizé Reserve (France). These seven individuals constituted the study population. All the animals of the same sex were unrelated, which a priori had little influence on the results, since in both sexes, the home ranges of young after dispersal do not or only partially overlap those of relatives [9].
From early 2004, the animals were caught with nets twice a year, in March and October, in order to inject them with an anthelmintic (ivomec-D®) [21], collect the locations recorded by the GPS collars, and change the batteries. The young produced each year were removed from the enclosure on these occasions, systematically before they were one year old. In 2004 a single female reared young, in 2005 three, in 2006 four, in 2007 three, and in 2008 four (mean: 1.93 young/litter). In March 2007, one of the three monitored males died accidentally during capture, and one month later a second was found dead, probably because of harassment by the third male (all were nearly four years old at that time).
2.3 Location sampling and accuracy
Each collar was scheduled to attempt a location every 4 h from January 2004 to March 2006, then every 6 h (in order to save batteries) from April 2006 to August 2008. After differential correction of the GPS locations [22], we retained all the 3-dimensional fixes, and the 2-dimensional fixes with ‘dilution of precision’ values < 5. In this way, we obtained 102 to 310 locations per individual and two-month period. Tests performed on fixed GPS collars, applying the same procedure of data selection, provided location errors < 20 m, 81.5% of the time.
2.4 Basic computations
The number of locations for each roe and two-month period was reduced to 102 by random draw. For each two-month period, we then computed, using ArcView 3.0, the 95% minimum convex polygon (MCP) of the locations of each individual, as well as the overlap percentage between the 95%-MCP ranges of the different pairs of individuals. More specifically, 95%-MCP ranges were obtained, removing the 5% of the fixes that had the greatest influence on polygon area, then excluding any polygon parts located outside the enclosure. Overlap percentage between ranges A and B was computed as 100 × S(A∩B)/S(A∪B), where S(A∩B) is the area common to the two ranges, and S(A∪B), the area of the union of the two ranges. In addition, for each two-month period, we computed the arithmetic centre of the locations of each individual, then the distance between this centre and that of its nearest same-sex neighbour, and the distance between this centre and that of its nearest neighbour of the other sex.
2.5 Analysis of seasonal patterns and long-term variations
In order to detect possible seasonal patterns and long-term variations in range size, range overlap, and distance between nearest neighbours’ arithmetic centres, we fitted a series of linear models to the data (Table 1) and compared them using Akaike Information Criterion corrected for small samples (AICc) as recommended by [23]. According to AIC theory, the fitted model giving the best estimates is that exhibiting the smallest value of AICc. However, when an alternative model has a lower degree of freedom, and an AICc within 2 units of the smallest, [23] recommend to retain this model rather than that exhibiting the smallest AICc value.
Fitted models, and difference between their Akaike Information Criterion corrected for small samples (AICc) and that of the model retained (ΔAICc). In each case, the retained model was that exhibiting the smallest AICc since none of the alternative models with a lower df had an AICc within two units of the smallest (see Methods).
| Males | Females | Male–Female | |||||
| Dependent variable (Y) | Models (fixed part) | df | ΔAICc | df | ΔAICc | df | ΔAICc |
| 95%-MCP area (ha) | Y ∼ season + phase | 11 | 4.43 | 11 | 0.00 | ||
| Y ∼ season | 8 | 84.13 | 8 | 29.25 | |||
| Y ∼ phase | 6 | 0.00 | 6 | 21.06 | |||
| Y ∼ 1 | 3 | 72.70 | 3 | 40.57 | |||
| Mean overlap (%) | Y ∼ season + phase | 9 | 11.43 | 10 | 0.00 | 10 | 0.00 |
| Y ∼ season | 7 | 56.15 | 7 | 12.77 | 7 | 34.89 | |
| Y ∼ phase | 4 | 0.00 | 5 | 4.45 | 5 | 3.69 | |
| Y ∼ 1 | 2 | 38.54 | 2 | 9.34 | 2 | 25.48 | |
| Mean dist. to nearest | |||||||
| Arithmetic centre (m) | Y ∼ season + phase | 9 | 18.37 | 10 | 0.00 | 10 | 0.00 |
| Y ∼ season | 7 | 45.04 | 7 | 8.09 | 7 | 3.53 | |
| Y ∼ phase | 4 | 0.00 | 5 | 22.43 | 5 | 13.54 | |
| Y ∼ 1 | 2 | 27.72 | 2 | 20.02 | 2 | 15.11 |
In the models considered, ‘season’ is a six-level factor (‘Jan–Feb’, ‘Mar–Apr’, ‘May–Jun’, ‘Jul–Aug’, ‘Sep–Oct’, and ‘Nov–Dec’), and ‘phase’ is a four-level factor dividing the whole study period into four a priori relevant phases A, B, C, and D, each phase corresponding to a whole year. At the start of phases B (Mar 2005–Feb 2006) and C (Mar 2006–Apr 2007) a shift in behaviour could be expected in at least one of the three monitored males. In roe deer, indeed, young males generally become territorial between two and four years of age, and in the course of the year males typically exhibit their territorial behaviour from March to August [3]. Phase D (May 2007–Aug 2008) is the period during which the study population included a single adult male.
For the analysis of range size, the ‘individual’ was added as a random variable to the models listed in Table 1, and the resulting mixed-effect models were fitted using maximum likelihood (and not restricted maximum likelihood) to allow AIC comparison. For the analysis of range overlap, as well as analysis of the distance to the nearest neighbour's arithmetic centre, we used purely fixed-effect models computed on the means per two-month period, because the different values taken by the considered variable within any two-month period were intrinsically linked to one another. All models were fitted using R software and more specifically the nlme package for mixed-effect models [24].
2.6 Expected distance between nearest arithmetic centres
In order to assess whether females tended to space out, we performed Monte Carlo simulation to obtain mean distances to the nearest arithmetic centre under the hypothesis that the females positioned their ranges independently of one another. We assumed that all the bimonthly arithmetic centres obtained for the different monitored females were possible arithmetic centres for each of them and any two-month period. On this basis, each elementary simulation began by drawing four of the centres at random. Assuming they were those of the four females for a given two-month period, we computed the mean distance between each of them and its nearest neighbour (as we did for real data). The operation was performed 1000 times, which gave us 1000 mean distances to the nearest arithmetic centre under the assumption that the four females positioned their ranges independently of one another. If the females tended to be spaced out (during any given two-month period), then the mean distance observed should be among the largest values obtained by simulation. The same procedure was performed for the males in order to verify that they did tend to be spaced out, at least during phases B or C.
3 Results
3.1 Home range size
The mean surface area of the males’ bimonthly ranges varied across phases, but did not exhibit any clear seasonal pattern (Table 1). It covered about 68% of the surface area of the enclosure during phase A, then decreased gradually to about 33% during phase C (Fig. 1a, Table 2). After the death of two of the three males at the end of phase C, the size of the remaining male's range rose again to a value similar to that of the three males’ ranges during phase A.
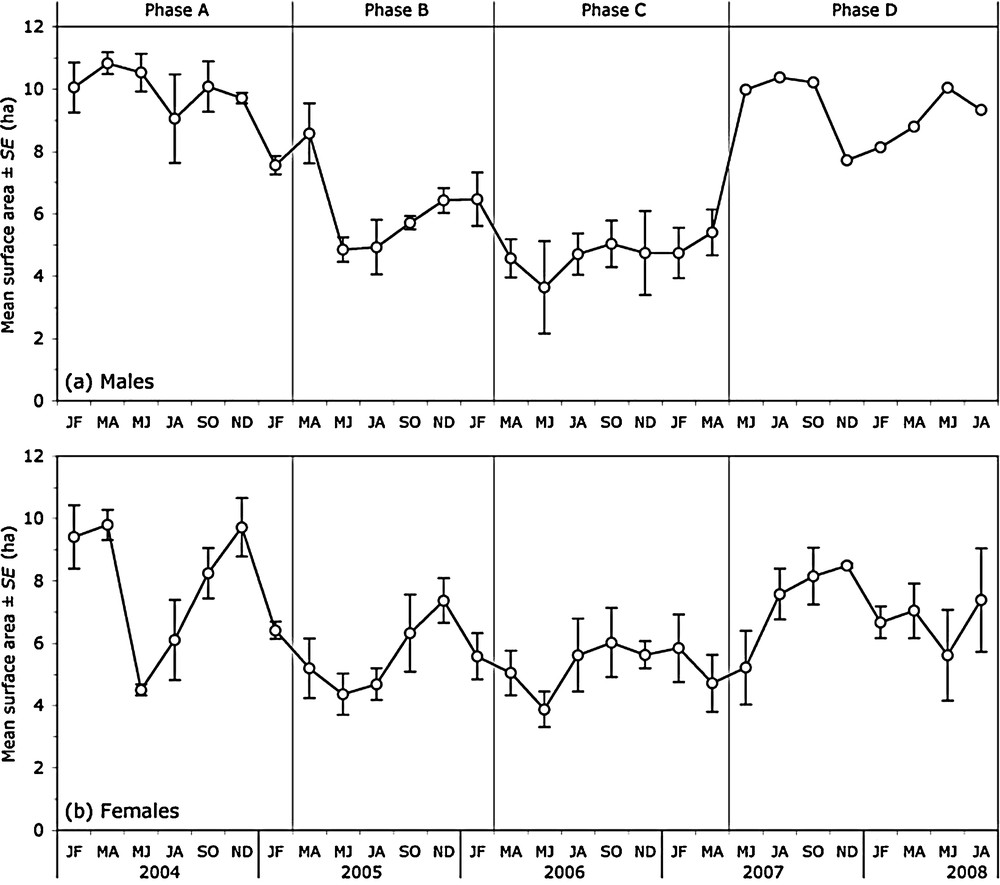
Empirical mean (± SE) of the surface area of the monitored roe deer's 95%-MCP bimonthly ranges.
Means (± SE) as estimated through the models retained (see Table 1).
| Phase A | Phase B | Phase C | Phase D | |
| 95%-MCP area (ha) | ||||
| Males | 9.69 ± 0.37 | 6.16 ± 0.39 | 4.66 ± 0.38 | 9.12 ± 0.58 |
| Females | ||||
| Jan–Feb | 7.79 ± 0.52 | 5.65 ± 0.57 | 5.29 ± 0.56 | 7.36 ± 0.56 |
| Mar–Apr | 7.87 ± 0.56 | 5.72 ± 0.57 | 5.37 ± 0.52 | 7.44 ± 0.56 |
| May–Jun | 5.81 ± 0.56 | 3.67 ± 0.57 | 3.31 ± 0.56 | 5.38 ± 0.52 |
| Jul–Aug | 7.37 ± 0.56 | 5.22 ± 0.57 | 4.87 ± 0.56 | 6.94 ± 0.52 |
| Sep–Oct | 8.46 ± 0.58 | 6.31 ± 0.59 | 5.95 ± 0.58 | 8.02 ± 0.58 |
| Nov–Dec | 9.06 ± 0.58 | 6.92 ± 0.59 | 6.56 ± 0.58 | 8.63 ± 0.58 |
| Mean overlap (%) | ||||
| Male–male | 74.8 ± 3.9 | 27.0 ± 4.2 | 11.8 ± 3.9 | – |
| Female–female | ||||
| Jan–Feb | 54.5 ± 5.1 | 31.4 ± 5.7 | 30.8 ± 5.6 | 47.7 ± 5.6 |
| Mar–Apr | 57.1 ± 5.6 | 34.0 ± 5.7 | 33.4 ± 5.1 | 50.3 ± 5.6 |
| May–Jun | 31.0 ± 5.6 | 7.9 ± 5.7 | 7.3 ± 5.6 | 24.1 ± 5.1 |
| Jul–Aug | 40.7 ± 5.6 | 17.6 ± 5.7 | 17.0 ± 5.6 | 33.8 ± 5.1 |
| Sep–Oct | 50.7 ± 5.9 | 27.6 ± 6.0 | 27.0 ± 5.9 | 43.9 ± 5.8 |
| Nov–Dec | 56.8 ± 5.9 | 33.8 ± 6.0 | 33.1 ± 5.9 | 50.0 ± 5.8 |
| Male–female | ||||
| Jan–Feb | 66.0 ± 4.1 | 38.4 ± 4.6 | 32.9 ± 4.6 | 61.4 ± 4.5 |
| Mar–Apr | 62.0 ± 4.6 | 34.4 ± 4.6 | 28.9 ± 4.1 | 57.4 ± 4.5 |
| May–Jun | 43.6 ± 4.6 | 16.0 ± 4.6 | 10.6 ± 4.6 | 39.0 ± 4.1 |
| Jul–Aug | 56.1 ± 4.6 | 28.5 ± 4.6 | 23.0 ± 4.6 | 51.5 ± 4.1 |
| Sep–Oct | 63.1 ± 4.8 | 35.5 ± 4.8 | 30.0 ± 4.8 | 58.5 ± 4.7 |
| Nov–Dec | 63.7 ± 4.8 | 36.0 ± 4.8 | 30.6 ± 4.8 | 59.1 ± 4.7 |
| Mean distance to nearest arithmetic centre (m) | ||||
| Male–male | 57.9 ± 8.1 | 108.4 ± 8.8 | 164.0 ± 8.8 | – |
| Female–female | ||||
| Jan–Feb | 32.5 ± 8.5 | 57.6 ± 9.5 | 71.3 ± 9.3 | 44.0 ± 9.2 |
| Mar–Apr | 23.9 ± 9.3 | 49.0 ± 9.5 | 62.7 ± 8.5 | 35.4 ± 9.2 |
| May–Jun | 87.3 ± 9.3 | 112.5 ± 9.5 | 126.2 ± 9.3 | 98.8 ± 8.4 |
| Jul–Aug | 84.3 ± 9.3 | 109.4 ± 9.5 | 123.1 ± 9.3 | 95.8 ± 8.4 |
| Sep–Oct | 68.0 ± 9.8 | 93.1 ± 9.9 | 106.8 ± 9.8 | 79.5 ± 9.7 |
| Nov–Dec | 38.0 ± 9.8 | 63.3 ± 9.9 | 76.9 ± 9.8 | 49.6 ± 9.7 |
| Male–female | ||||
| Jan–Feb | 25.1 ± 7.3 | 30.7 ± 8.1 | 28.7 ± 8.0 | 51.2 ± 7.9 |
| Mar–Apr | 46.3 ± 8.0 | 51.9 ± 8.1 | 49.9 ± 7.3 | 72.5 ± 7.9 |
| May–Jun | 71.6 ± 8.0 | 77.1 ± 8.1 | 75.1 ± 8.0 | 97.7 ± 7.2 |
| Jul–Aug | 61.0 ± 8.0 | 66.5 ± 8.1 | 64.5 ± 8.0 | 87.1 ± 7.2 |
| Sep–Oct | 49.2 ± 8.4 | 54.8 ± 8.5 | 52.8 ± 8.4 | 75.3 ± 8.3 |
| Nov–Dec | 22.0 ± 8.4 | 27.6 ± 8.5 | 25.6 ± 8.4 | 48.2 ± 8.3 |
The mean surface area of the females’ bimonthly ranges also varied across phases but, in contrast to males, exhibited a consistent seasonal pattern (Table 1). Long-term temporal variations were roughly similar to those observed in males (Fig. 1b, Table 2): mean range size decreased from phase A to phases B and C, then re-increased up to a level similar to that of phase A (comparison between estimated means for phases A and D: t100 = –0.922, P > 0.35). Besides, it consistently reached its smallest size in May to June and its largest size in November to December (Fig. 1b, Table 2). At its maximum (phase A: November–December), mean range size covered about 64% of the surface area of the enclosure. At its minimum (phase C: May–June), it covered about 23% of the enclosure.
3.2 Range overlap
The mean overlap between the males’ ranges varied strongly across phases without exhibiting any clear seasonal pattern (Table 1). Overall, like range size, it decreased from phases A to C (Fig. 2a, Table 2).
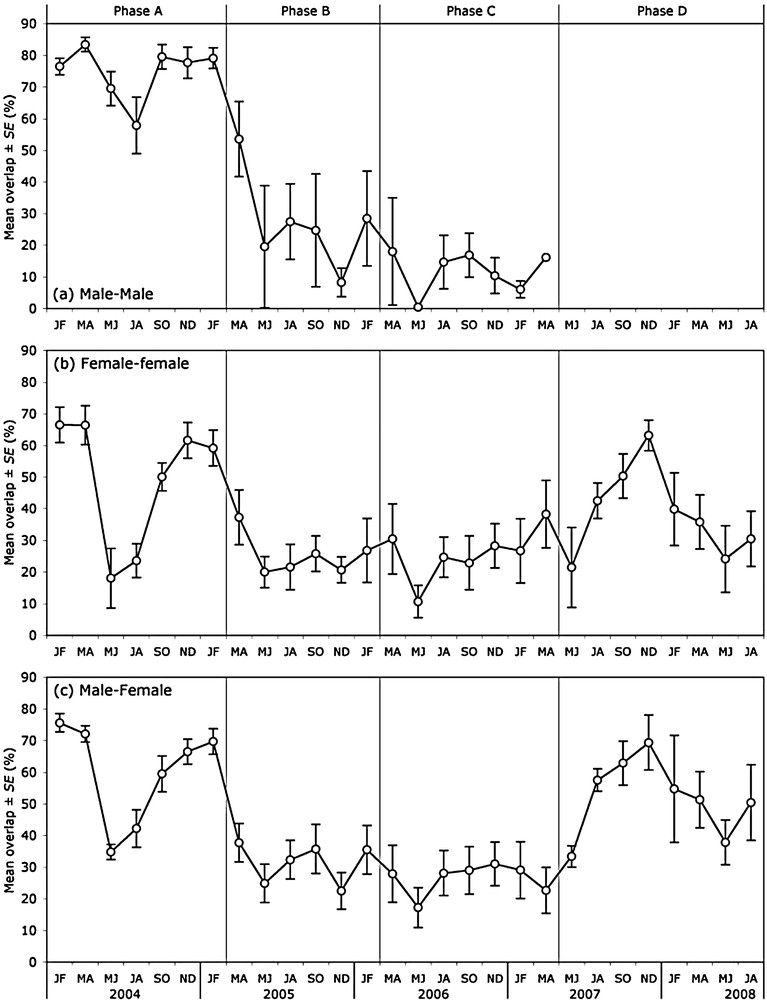
Empirical mean (± SE) of the overlap between the 95%-MCP bimonthly ranges of the monitored roe deer.
The mean overlap between the females’ ranges varied across phases but also according to season (Table 1). Declining from phases A to B, then increasing from phases C to D, it was consistently lower in May to June, and to a lesser extent in July to August, than in the remainder of the year (Fig. 2b, Table 2).
The mean overlap between the males’ and females’ ranges varied according to phase and season (Table 1). It varied in parallel to mean overlap between the females’ ranges (Fig. 2c), though it was on average higher (mean difference ± SE: 8.0 ± 1.4%).
3.3 Distance between nearest arithmetic centres
The mean distance between the arithmetic centre of a male's range and that of the nearest male did not exhibit any consistent seasonal pattern (Table 1), even though during phases A and B it peaked in July to August, i.e. in the rutting season (Fig. 3a). Overall, it increased from phases A to C (Table 2), and in phase C it exceeded the 95%-percentile of the distribution of the mean distance expected under the hypothesis that males positioned their ranges independently of one another (Fig. 3a).
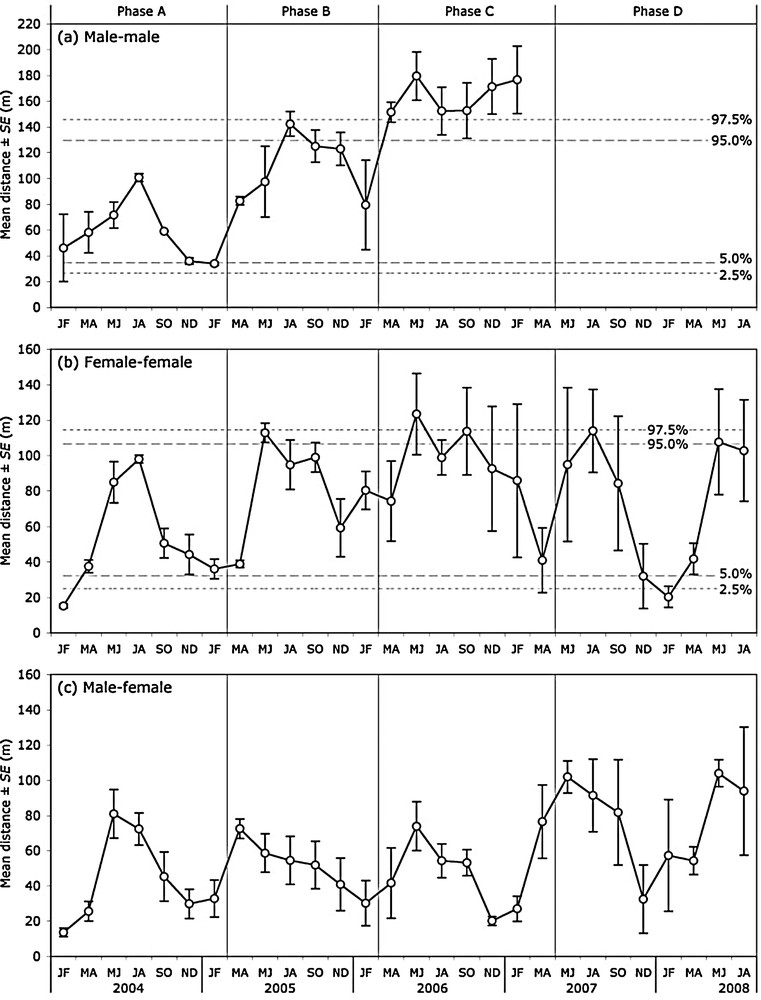
Empirical mean (± SE) of the distance between each individual's bimonthly arithmetic centre and that of its nearest same-sex neighbour (a, b), and between its bimonthly arithmetic centre and that of its nearest neighbour of the other sex (c). In (a) and (b), dashed lines are the 2.5, 5.0, 95.0, and 97.5 percentiles of the distribution obtained for the mean distance under the hypothesis that the monitored roe deer positioned their ranges independently of one another (Monte Carlo simulations; n = 1000).
The mean distance between the arithmetic centre of a female's range and that of the nearest female varied according to phase and season (Table 1). Higher during phases B and C than during phases A and D (Table 2), it peaked in May–June or July–August, often exceeding at that time the 95%-percentile of the distribution of the mean distance expected under the hypothesis that females positioned their ranges independently of one another (Fig. 3b). Mean distance between nearest females’ arithmetic centres was minimum in winter, its value falling during phases A and D under the 5%-percentile of the distribution of the mean distance expected under the hypothesis of independent positioning.
The mean distance between the arithmetic centre of an individual's range and that of its nearest neighbour of the other sex exhibited both a seasonal pattern and a variation across phases (Tables 1 and 2). Generally maximal in May to June and minimal in November to December (Fig. 3c, Table 2), it did not vary significantly from phases A to C (comparison between estimated means: F2,19 = 0.264, P > 0.75), but increased between phases C and D (t19 = 3.066, P = 0.0064) with the reduction of the number of males. During phase A, its value was on average a little lower than that of the mean distance between nearest females’ arithmetic centres (mean difference ± SE: –9.4 ± 3.2 m). During phases B and C, the difference was greater (–35.3 ± 9.3 m). During phase D, when there remained only one male in the enclosure, the two mean distances were similar but showed more interindividual variability (2.4 ± 6.2 m).
4 Discussion
As expected (prediction 1), the males tended to exclude one another through time: surface area and overlap of their bimonthly ranges decreased, and distance between their arithmetic centres increased, as their age increased from one to three years. This led to very small bimonthly ranges (4.66 ± 0.38 ha during phase C) each covering about 33% of the surface area of the enclosure. The surface area of bimonthly ranges increased once more as soon as there was a single male in the enclosure. The visual observations made in the enclosure confirm the increasing intolerance between males. On average (± SE), a male sighted was in company of another male in 15.1 ± 5.9% of the instances (n = 88) during phase A, 4.5 ± 2.6% (n = 68) during phase B, and 0.9 ± 0.9% (n = 78) during phase C. Furthermore, the interactions observed between the males (n = 15) showed that one of them chased one of the two others but tolerated the presence of the third during phase A, that the more aggressive male and the individual he tolerated became territorial from phase B, while the male already chased during phase A never became territorial before its death. This is consistent with the variability of age at territory establishment as reported in the literature [3,12].
Contrary to prediction 2, females did not share large overlapping home ranges. Their bimonthly ranges covered only part of the enclosure, and shrank with increasing age in males. Furthermore, overlap between females’ ranges were consistently lower than overlap between males and females’ ranges, or even between males’ ranges during phase A. Consistently with prediction (3), the surface area and overlap of the females’ ranges decreased in May–June, i.e. during the birth period, while the distances between females’ nearest arithmetic centres increased. These results are consistent with the females’ exclusive core areas found by [10] and with the decrease in females’ home range size in spring, found by most authors, in roe deer [8,25–28], as in other deer species (white-tailed deer [29,30], fallow deer [31,32], red deer [33], caribou [34]). Some authors associate this decrease with a reduction of movement before parturition, which persists during the first weeks of the hiding fawns [8,35]. We also found a decrease in females’ range size around parturition (May–June), despite their very small range sizes, which were already compatible with the low mobility of fawns, unlike the range sizes generally observed in natural conditions. Moreover, the distance between females’ nearest arithmetic centres remained high during the rut and even until late October in some years, i.e. when fawns have acquired high mobility and females’ range size increased.
Roe deer females are not supposed to be territorial: according to [2] and [4], their home ranges overlap. These studies were based on visual observations only, and their conclusions remained rarely questioned, despite:
- • the lack of overlap between the home ranges of radio-collared females [8], including relatives (mother or sister) after young dispersal [9];
- • the commonly observed breaking up of social groups in spring;
- • the similar dispersal patterns observed in both sexes [36];
- • the observations of agonistic interactions between reproducing females [7,37].
In our enclosure, females were associated in 12.1 ± 3.0% of the observations (n = 92) from November to April, vs. 1.1 ± 0.7% (n = 214) from May to October, and nearly all the agonistic interactions observed between females (including chases and butts) occurred from March to June (n = 8/10). [37] recorded 30 aggressions by mothers towards other females during the first four months of the fawns’ life, more than half (n = 17) being observed during the first 10 days. The rarity of interactions and the lack of spectacular behaviour probably led to an underestimation of intolerance between female roe deer under natural conditions. Females living in enclosures much smaller than that used for our experiment (0.5 ha) interacted more often (threat, chase and butt), particularly when rearing their young [38]. They have also been observed rubbing their forehead on stakes and seedlings [39].
Female territoriality is already reported in other cervids. In white-tailed deer (Odocoileus virginianus), some authors showed exclusive home ranges in some adult females [29,40], a lower tendency to associate in lactating than in non-lactating females in all seasons [30] and agonistic behaviour toward most other deer during the fawning period [40–42]. In Chinese, water deer (Hydropotes inermis) does tend to live solitary, and chases involving two does can be observed before and after giving birth [43]. In moose (Alces alces), females’ home ranges overlap only in winter and early spring, their core areas being a few kilometres apart [44]. Lactating females never associate with any other moose in summer [45]. Whether females are considered as territorial or not, their seasonal intolerance leads to a mosaic-like spatial organisation, similar to that of males. It is noteworthy that this is consistent with the observed decrease of their summer home ranges with increasing density [13], with the difference in fawn survival at high density between habitats of different qualities [17], and with the relation between lifetime reproductive success of females and the composition of their home ranges [15], results which all contradict earlier assumptions of an ideal free distribution in female roe deer [14].
Finally, in contrast to prediction 4, the spacing systems of the two sexes were not independent of each other: in the presence of three adult males, females’ ranges were smaller and overlapped less with each other and less with males’ ranges, than in the presence of the same, younger males, or in the presence of a lone adult male. We assume that the high reactivity of several adult males encouraged females to avoid any encounter with a conspecific.
Obviously, the specific conditions of our experimental situation have an effect on the values of the parameters studied (home range sizes, distances between ranges’ arithmetic centres), but we are confident in the generality of our conclusions, because this experimental situation (wooded and medium sized enclosure) allowed females, just like males, to space out, which would not be possible in an enclosure smaller or with no forest cover. We propose to take advantage of the new open project ‘European roe deer information system’ (EURODEER, a shared database of roe deer movement data), to further investigate the spatial organisation of female roe deer, and its relationships with the males’ spatial organisation, in various natural conditions. We agree with [46], when they argue that roe deer ‘will continue to offer us many more surprises in the years to come’.
Disclosure of interest
The authors declare that they have no conflicts of interest concerning this article.
Acknowledgements
We are grateful to the Midi-Pyrénées Region for financial support to the construction of the experimental station, as well as to the Establishment of technical experimentation at Bourges and to the Chizé reserve, which provided the roe deer. We thank Peter Winterton who checked the language of the manuscript, and two referees for their constructive comments on the manuscript. The authors declare that the experiments comply with the current laws of the country in which they were performed (France).