

1 Introduction
Ants are considered to be one of the most suitable taxa for assessing ecological integrity in terrestrial ecosystems [1–3]. Ant community characteristics are affected by a variety of environmental factors that act on habitats [4–7]. Furthermore, ants are typically relatively sedentary and are thus sensitive to small-scale spatiotemporal changes in the environment [8]. Ants are therefore efficient indicators of the impact of environmental changes in an integrative and continuous manner.
Although ant community characteristics reflect ecological integrity fairly well, these community data are highly complex and difficult to analyze, primarily because communities consist of numerous species and also because they respond in highly complex manners to natural and anthropogenic pressures in their environments. A variety of ordination analyses have therefore been employed to describe ant communities. Davis and Zigler [9] used detrended correspondence analysis (DCA) to show that ant communities differed significantly between different habitat types and that species composition over time. Sarty et al. [10] clarified the influence of invasion by Anoplolepis gracilipes on ant community composition and species abundance using non-metric multidimensional scaling (NMDS). Indeed, DCA and NMDS are used extensively for the analysis of community data, but the methods sometimes fail to show clear clustering and habitat preference of species [11,12].
Self-organizing maps (SOMs), which are another method used in ordination analysis to mine nonlinear data, have been used extensively to characterize patterns in communities since the 1990s [13,14]. The SOM method can efficiently classify a bi-dimensional projection of habitat characteristics; for example, SOMs can illustrate the community response to anthropogenic disturbance at a site and clarify how such disturbance affects species occurrence [15–17].
This study aimed to:
- • characterize the distributional patterns of ant communities in various habitats;
- • compare SOM and DCA ordination methods;
- • visualize distribution patterns of ant species;
- • quantitatively estimate the relative importance of each ant species in each habitat.
We applied the SOM and DCA methods to characterize ant community structure and distribution patterns according to land use type. In addition, we employed an indicator value (IndVal) to quantify the importance of each species identified using the SOM map. This approach was proposed by Park et al. [18] and has recently been employed to better explain ecological data [19,20].
2 Materials and methods
2.1 Study site
Habitat and ant surveys were carried out at 12 study sites in Fukuoka City, Kyushu, Japan, from 1998 to 2012 (Fig. 1). The 12 study sites were classified into nine land use types, which were grouped into one of two categories: open areas (open urban parks, coastal areas, and agricultural fields) and forested areas (evergreen forests, shrine forests, urban park forests, deciduous forests, bamboo forests, and cedar forests) (Table 1). Each land use type presents ants with a variety of structurally different habitats and biotic factors. In addition, the characteristics of each habitat have been maintained by surrounding environmental conditions and/or continuous management. For instance, the management of open urban parks is directed at preventing the free growth of planted trees, which limits the provision of habitats containing large quantities of decaying nesting material. We resampled two sites (S05 and S06, Table 1) to clarify whether ant communities were influenced by land use type or time.
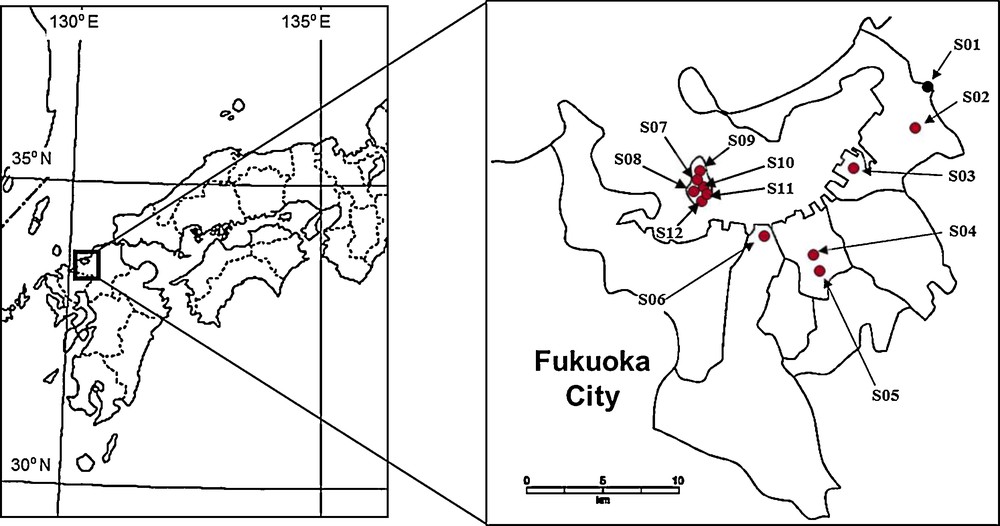
Map of the location at the 12 study sites in Fukuoka city, Japan.
Description of site codes used in Fig. 1.
| Site code | Data code | Locality | Land use type | Vegetation type | Repetition of TUS | Reference |
| S01 | A | Mt. Tachibana | Natural forest | Evergreen forest | 15 min × 10 times | [21] |
| S02 | B | Kashii-gu Shrine | Shrine | Evergreen forest | 15 min × 10 times | [21] |
| S03 | C | Hakozaki Futuo Kouen | Urban open park | Ornamental plant | 15 min × 8 times | [21] |
| S04 | D | Gokoku Jinja Shrine | Shrine | Evergreen forest | 15 min × 8 times | [21] |
| S05 | E | Minami Kouen | Urban forest park (1998) | Evergreen forest | 30 min × 8 times | [22] |
| F | Minami Kouen | Urban forest park (2012) | Evergreen forest | 30 min × 8 times | [23] | |
| S06 | G | Momochi Chuou Kouen | Urban open park (1998) | Ornamental plant | 30 min × 8 times | [22] |
| H | Momochi Chuou Kouen | Urban open park (2012) | Ornamental plant | 30 min × 8 times | [23] | |
| S07 | I | Nokonoshima | Seacoast | Grass land | 15 min × 16 times | [24] |
| S08 | J | Nokonoshima | Secondary forest | Deciduous forest | 15 min × 16 times | [24] |
| S09 | K | Nokonoshima | Agricultural land | Paddy | 15 min × 16 times | [24] |
| S10 | L | Nokonoshima | Secondary forest | Evergreen forest | 15 min × 16 times | [24] |
| S11 | M | Nokonoshima | Secondary forest | Bamboo forest | 15 min × 16 times | [24] |
| S12 | N | Nokonoshima | Secondary forest | Cedar forest | 15 min × 16 times | [24] |
2.2 Sampling method
We used time-unit sampling (TUS), which is a direct sampling method that is well suited for making a comprehensive inventory of species at different study sites. TUS involves collecting as many species as possible by visually and manually searching for ants on the ground surface, under stones or under wood bark, and around the bases of tree trunks. Although direct sampling methods are effective for capturing the majority of species at a site [25], such methods are not well suited for studies involving quantitative comparisons between sites [26]. TUS is designed to address this weakness by repeatedly sampling sites over a fixed period of time. The tools employed to capture the ants were aspirators, sifters, pans, and vials containing 70% ethanol [27].
The time unit and the number of TUS times were considered based on the conditions at each study site. Of the 12 study sites identified, 2 were sampled 10 times, 6 were sampled 8 times, and 6 were sampled 16 times (Table 1). These 164 samples were used to analyze ant community and occurrence patterns of indigenous ant species according to land use type. In this study, we defined unique and duplicate species as those that were only recorded once or twice among the 164 samples.
2.3 Data analysis
We used the SOM algorithm described by Kohonen to characterize the distribution patterns of ant communities [28]. SOMs are used to approximate the probability density function of input data, and have frequently been used for clustering, visualization, and abstraction of ecological data [29]. The structure of a SOM consists of an input data layer and an output layer, with each layer connected by connection intensities (or weights). The input layer is composed of 52 neurons (one per ant species) connected to the 14 sampling datasets. We employed a batch training algorithm as it is considerably faster and does not require learning factor rates to be specified [30]. Two approaches were employed to define the map size [29,31]. According to Vesanto's heuristic rule, the actual neuron numbers should be close to
Since SOM analysis does not generate any statistical information that each species is responsible for the obtained clusters [36], we employed indicator species analysis to identify the most important indicator species in the clusters generated by the SOM analysis [37]. Indicator species were selected by calculating their IndVal, which is the product of the relative abundance of a species and the relative frequency of that species at a site; IndVal ranges from 0 (no indication) to 100 (perfect indication). We considered indicator species to be those for which IndVal > 25 (i.e., individuals of a particular species that were present in more than 50% of the samples in one cluster, with the relative abundance of that indicator species in the cluster exceeding 50%) [37]. The significance of the indicator values for each species was tested using a Monte Carlo permutation test (999 random permutations).
In addition, we performed a DCA on the same dataset to compare the results obtained using the two methods. DCA is a multivariate statistical technique that is widely used in ecological studies to identify patterns in ecological community data [9,38] and it is also an eigenvector ordination technique based on a correspondence analysis that displays both species and sample units simultaneously [39]. In this study, we used the PC-ORD package to generate DCA scatter plots where each transect was represented by a single point, and then was displayed for clusters of points as an indication of similar ant communities [35].
3 Results
3.1 Patterning ant assemblages
Using 14 datasets containing the occurrence and distribution data for 52 ant species collected from 12 study sites, we trained the SOM to cluster this information according to similarities in community composition (Table 2, Fig. 2). After training the model, SOM units were separated into two main clusters, X (five datasets) and Y (nine datasets). These clusters were classified based on the dendrogram generated using Ward's linkage method (Fig. 2(B)), which showed that the community composition of the two clusters was significantly different (MRPP, A = 0.19, P < 0.001).
Ants collected by TUS at the 12 sample sites.
| Code | Species | Sampling sites | |||||||||||||
| S01 | S02 | S03 | S04 | S05 | S06 | S07 | S08 | S09 | S10 | S11 | S12 | ||||
| A | B | C | D | E | F | G | H | I | J | K | L | M | N | ||
| Amblyoponinae | |||||||||||||||
| 01 | Amblyopone silvestrii | 0 | 1 | 0 | 0 | 1 | 0 | 0 | 0 | 0 | 1 | 0 | 0 | 0 | 1 |
| Dolichoderinae | |||||||||||||||
| 02 | Ochetellus glaber | 0 | 1 | 0 | 0 | 0 | 0 | 4 | 1 | 8 | 0 | 6 | 0 | 0 | 0 |
| Formicinae | |||||||||||||||
| 03 | Camponotus japonicus | 0 | 1 | 3 | 0 | 0 | 1 | 7 | 6 | 0 | 1 | 1 | 0 | 1 | 0 |
| 04 | Camponotus keihitoi | 0 | 3 | 0 | 0 | 0 | 1 | 0 | 0 | 0 | 2 | 0 | 0 | 0 | 0 |
| 05 | Camponotus nipponicus | 0 | 0 | 0 | 2 | 0 | 0 | 0 | 0 | 0 | 0 | 0 | 0 | 0 | 0 |
| 06 | Camponotus quadrinotatus | 0 | 0 | 0 | 0 | 0 | 0 | 0 | 0 | 0 | 6 | 0 | 0 | 7 | 0 |
| 07 | Camponotus vitiosus | 0 | 5 | 5 | 0 | 1 | 7 | 4 | 3 | 5 | 3 | 5 | 1 | 0 | 0 |
| 08 | Formica hayashi | 2 | 4 | 0 | 0 | 3 | 4 | 0 | 0 | 0 | 0 | 0 | 0 | 4 | 0 |
| 09 | Formica japonica | 0 | 0 | 3 | 0 | 0 | 0 | 3 | 0 | 0 | 0 | 0 | 0 | 0 | 0 |
| 10 | Lasius alienus | 0 | 0 | 0 | 0 | 3 | 0 | 0 | 0 | 0 | 0 | 0 | 0 | 0 | 0 |
| 11 | Lasius japonicus | 6 | 4 | 2 | 0 | 3 | 4 | 7 | 5 | 4 | 8 | 3 | 0 | 4 | 0 |
| 12 | Lasius spathepus | 0 | 0 | 0 | 0 | 0 | 0 | 0 | 0 | 0 | 0 | 0 | 1 | 0 | 0 |
| 13 | Nylanderia amia | 0 | 0 | 0 | 0 | 0 | 0 | 8 | 3 | 0 | 0 | 0 | 0 | 0 | 0 |
| 14 | Nylanderia flavipes | 8 | 10 | 3 | 5 | 8 | 4 | 1 | 0 | 0 | 3 | 3 | 10 | 10 | 5 |
| 15 | Nylanderia sakurae | 0 | 0 | 5 | 0 | 0 | 0 | 7 | 6 | 4 | 0 | 1 | 0 | 0 | 0 |
| 16 | Polyrhachis lamellidens | 0 | 0 | 0 | 0 | 0 | 0 | 0 | 0 | 0 | 0 | 0 | 1 | 0 | 0 |
| 17 | Polyrhachis moesta | 0 | 0 | 0 | 0 | 0 | 0 | 0 | 0 | 0 | 0 | 0 | 0 | 1 | 0 |
| Myrmicinae | |||||||||||||||
| 18 | Aphaenogaster famelica | 4 | 1 | 0 | 0 | 8 | 6 | 0 | 0 | 0 | 5 | 0 | 6 | 0 | 6 |
| 19 | Carebara yamatonis | 2 | 1 | 0 | 2 | 0 | 0 | 0 | 0 | 0 | 2 | 0 | 1 | 3 | 0 |
| 20 | Crematogaster matsumurai | 0 | 0 | 4 | 2 | 0 | 4 | 6 | 6 | 3 | 5 | 5 | 0 | 0 | 0 |
| 21 | Crematogaster nawai | 0 | 0 | 0 | 4 | 0 | 0 | 0 | 0 | 0 | 0 | 0 | 0 | 0 | 0 |
| 22 | Crematogaster osakensis | 2 | 8 | 0 | 0 | 8 | 6 | 0 | 0 | 0 | 4 | 2 | 2 | 0 | 1 |
| 23 | Crematogaster teranishii | 0 | 0 | 0 | 0 | 0 | 2 | 0 | 0 | 0 | 0 | 0 | 2 | 0 | 1 |
| 24 | Crematogaster vagula | 0 | 2 | 0 | 0 | 0 | 0 | 0 | 0 | 0 | 6 | 2 | 0 | 0 | 1 |
| 25 | Monomorium chinense | 0 | 0 | 7 | 0 | 0 | 2 | 7 | 6 | 5 | 0 | 6 | 0 | 0 | 0 |
| 26 | Monomorium intrudens | 0 | 0 | 0 | 0 | 5 | 5 | 0 | 2 | 0 | 1 | 2 | 0 | 9 | 1 |
| 27 | Solenopsis japonica | 0 | 0 | 1 | 0 | 0 | 0 | 5 | 1 | 2 | 0 | 1 | 0 | 2 | 0 |
| 28 | Strumigenys lewisi | 5 | 5 | 0 | 6 | 1 | 4 | 0 | 0 | 0 | 8 | 0 | 10 | 5 | 10 |
| 29 | Temnothorax congruus | 0 | 0 | 1 | 0 | 0 | 0 | 0 | 2 | 0 | 2 | 0 | 0 | 0 | 0 |
| 30 | Temnothorax koreanus | 0 | 0 | 0 | 0 | 0 | 1 | 0 | 0 | 0 | 0 | 0 | 0 | 0 | 0 |
| 31 | Temnothorax spinosior | 0 | 0 | 0 | 0 | 0 | 0 | 0 | 1 | 0 | 0 | 0 | 0 | 0 | 0 |
| 32 | Tetramorium bicarinatum | 0 | 0 | 0 | 0 | 0 | 0 | 8 | 2 | 0 | 0 | 1 | 0 | 0 | 0 |
| 33 | Tetramorium nipponense | 0 | 8 | 0 | 1 | 3 | 3 | 0 | 0 | 0 | 2 | 0 | 0 | 3 | 0 |
| 34 | Tetramorium tsushimae | 0 | 0 | 5 | 0 | 0 | 0 | 8 | 8 | 8 | 1 | 8 | 0 | 0 | 0 |
| 35 | Pheidole fervida | 10 | 0 | 0 | 0 | 0 | 0 | 0 | 0 | 0 | 0 | 0 | 0 | 0 | 0 |
| 36 | Pheidole noda | 0 | 6 | 7 | 0 | 7 | 7 | 5 | 3 | 7 | 5 | 6 | 1 | 6 | 3 |
| 37 | Pheidole pieli | 0 | 0 | 0 | 3 | 0 | 4 | 0 | 0 | 0 | 0 | 0 | 0 | 0 | 1 |
| 38 | Pristomyrmex punctatus | 3 | 10 | 6 | 2 | 4 | 4 | 6 | 4 | 2 | 6 | 2 | 2 | 4 | 1 |
| 39 | Pyramica benten | 0 | 0 | 0 | 0 | 0 | 1 | 0 | 0 | 0 | 1 | 0 | 1 | 0 | 0 |
| 40 | Pyramica canina | 0 | 0 | 0 | 0 | 1 | 0 | 0 | 0 | 0 | 4 | 0 | 3 | 0 | 0 |
| 41 | Pyramica hexamera | 0 | 0 | 0 | 2 | 0 | 0 | 0 | 0 | 0 | 1 | 0 | 0 | 1 | 0 |
| 42 | Pyramica membranifera | 0 | 1 | 1 | 0 | 0 | 0 | 2 | 0 | 1 | 0 | 0 | 0 | 0 | 0 |
| 43 | Vollenhovia benzai | 0 | 5 | 0 | 0 | 6 | 1 | 0 | 0 | 0 | 2 | 0 | 0 | 0 | 3 |
| 44 | Vollenhovia emeryi | 0 | 1 | 0 | 0 | 0 | 0 | 0 | 0 | 0 | 1 | 0 | 9 | 1 | 2 |
| Ponerinae | |||||||||||||||
| 45 | Cryptopone sauteri | 1 | 0 | 0 | 2 | 0 | 0 | 0 | 0 | 0 | 0 | 0 | 0 | 0 | 0 |
| 46 | Discothyrea sauteri | 1 | 1 | 0 | 0 | 0 | 0 | 0 | 0 | 0 | 0 | 0 | 0 | 0 | 0 |
| 47 | Hypoponera beppin | 1 | 0 | 0 | 0 | 0 | 0 | 0 | 0 | 0 | 0 | 1 | 0 | 0 | 0 |
| 48 | Hypoponera sauteri | 1 | 4 | 0 | 0 | 2 | 1 | 0 | 0 | 0 | 1 | 1 | 8 | 1 | 2 |
| 49 | Pachycondyla chinensis | 6 | 5 | 3 | 5 | 6 | 3 | 1 | 6 | 0 | 7 | 0 | 4 | 3 | 5 |
| 50 | Ponera scabra | 5 | 0 | 0 | 1 | 1 | 0 | 0 | 0 | 0 | 2 | 0 | 5 | 2 | 2 |
| Proceratiinae | |||||||||||||||
| 51 | Proceratium itoi | 4 | 3 | 0 | 1 | 1 | 0 | 0 | 0 | 0 | 2 | 0 | 3 | 0 | 0 |
| 52 | Proceratium watasei | 0 | 0 | 0 | 0 | 2 | 1 | 0 | 0 | 0 | 0 | 0 | 1 | 0 | 1 |
| Total | 61 | 89 | 56 | 38 | 74 | 76 | 88 | 65 | 49 | 92 | 56 | 71 | 67 | 46 |
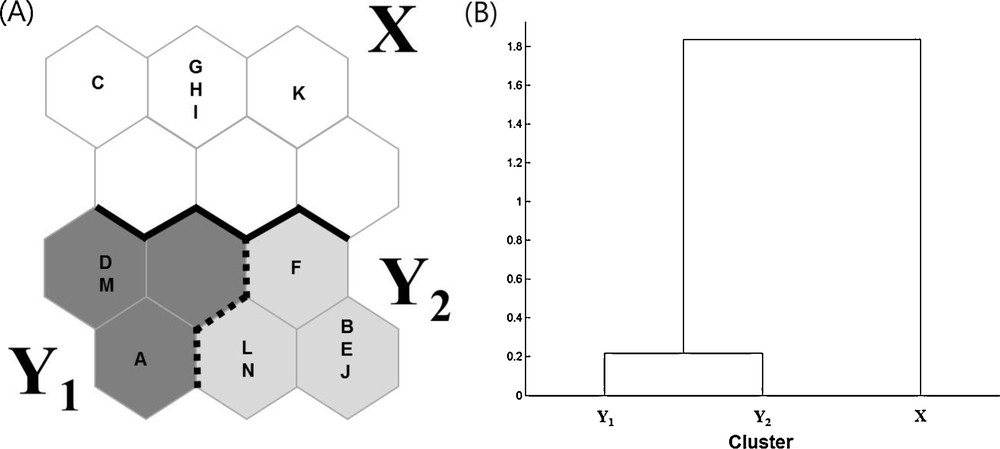
A. Distribution of the 14 sampled sites on SOM based on the occurrence of 52 ant species. B. Dendrogram for three clusters based on the Ward's linkage method.
These clusters reflected the land use types at each of the sampling sites. For example, land use types in cluster X corresponded to open land such as coastal areas, agricultural land and urban parks, while the datasets in cluster Y corresponded to different forest types. Cluster Y could further be subdivided into two sub-clusters, Y1 and Y2, each of which contained three and six datasets, respectively. The communities collected from evergreen forests and shrine forests were occurred in both sub-clusters Y1 and Y2 (Fig. 2A). In addition, the community compositions of some study sites (e.g., S05 and S06) did not change over time.
DCA scatter plots also revealed three distinct groups of sampling sites that could be correlated with land use types (Fig. 3), corroborating the findings obtained by the SOM. However, because unique and duplicate species were occasionally collected during the 164 collection times, we re-analyzed the data after removing these samples from our analysis. The results showed that the clusters generated by the DCA changed, whereas those generated by the SOM remained unaffected (Fig. 4).
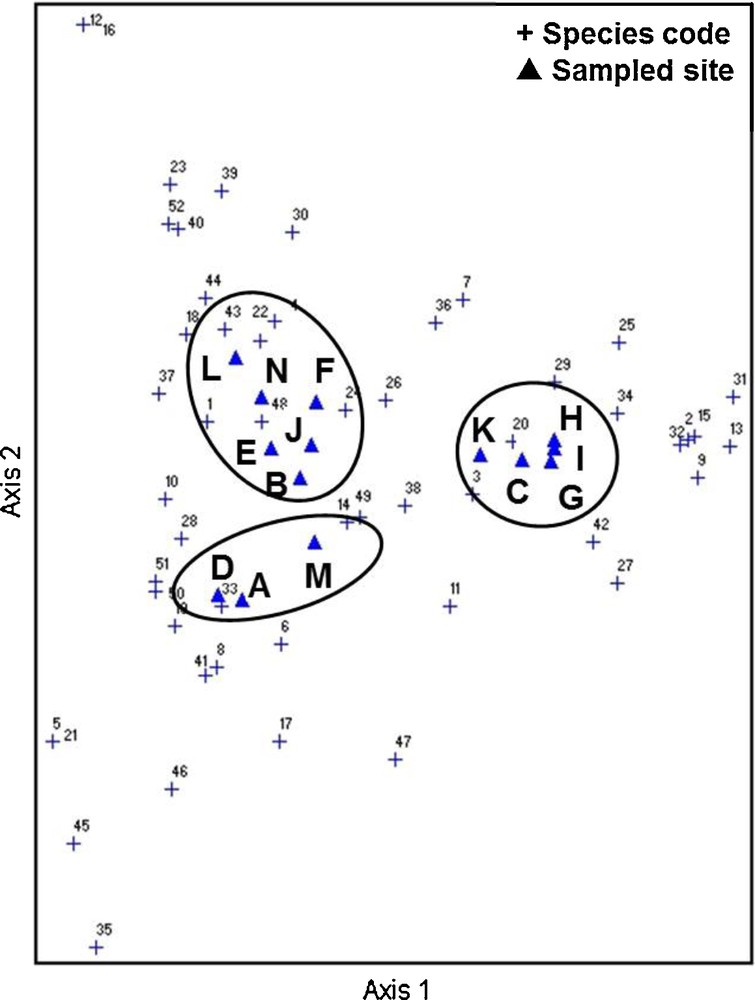
Distribution of the 14 sampled sites based on DCA of occurrence of 52 ant species.
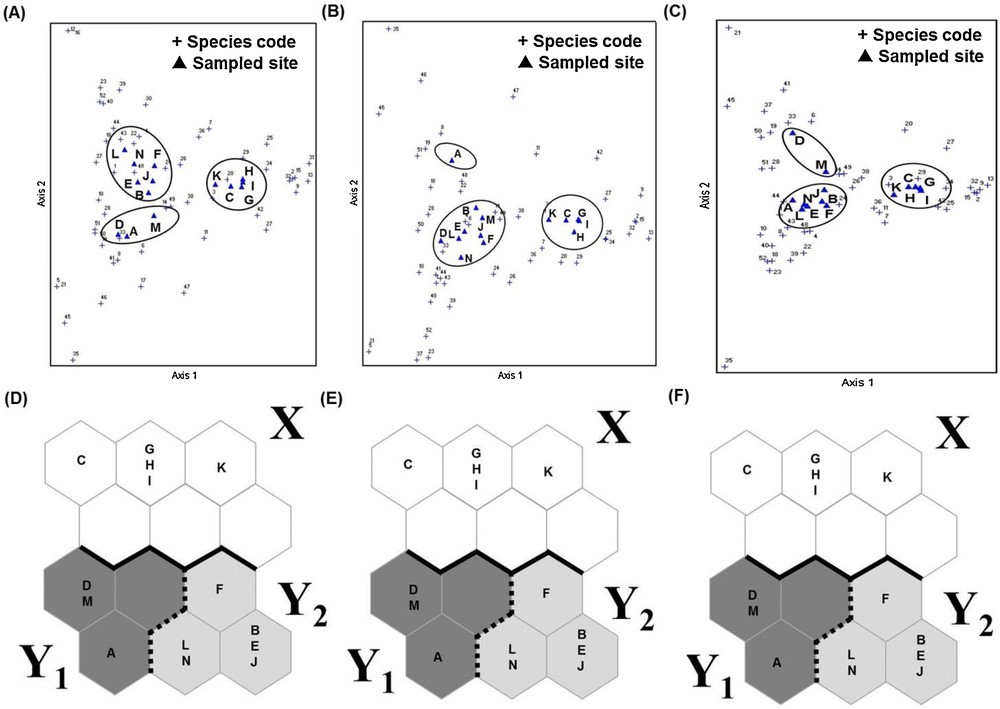
Comparison of SOM and DCA after removal of the unique and duplicate species. A. DCA of all species. B. DCA after removal of unique species. C. DCA after removal of unique and duplicate species. D. SOM analysis of all species. E. SOM analysis after removal of unique species. F. SOM analysis after removal unique and duplicate species.
3.2 Distribution of species
The probability of occurrence for each indicator species (i.e., species with significant IndVal values) illustrates how the distribution of ant species contributed to each cluster on SOM map (Fig. 5). Among 52 species identified in total, 17 were selected as indicator species (P < 0.05). In cluster X, seven species (Ochetellus glaber, Nylanderia sakurae, Crematogaster matsumurai, Monomorium chinense, Solenopsis japonica, Tetramorium bicarinatum, and Tetramorium tsushimae) were selected as indicator species. Of the seven species in sub-cluster Y1, two species (Carebara yamatonis and Cryptopone sauteri) were indicator species. In sub-cluster Y2, Amblyopone silvestrii, Aphaenogaster famelica, Crematogaster osakensis, Vollenhovia benzai, and Proceratium watasei were indicator species. Ponera scabra was represented as an indicator species in both sub-clusters Y1 and Y2. Camponotus vitiosus and Pheidole noda were represented in both cluster X and sub-cluster Y2.
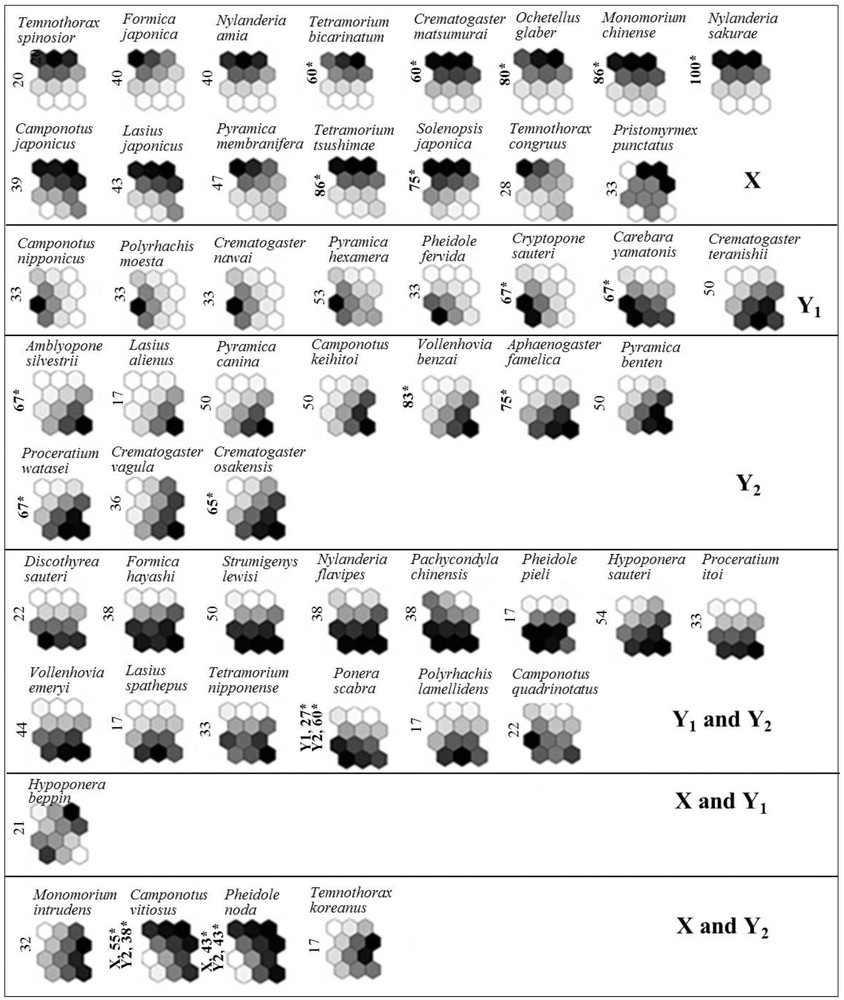
Probability of occurrence of each species on the trained SOM, visualized by a shaded scale (dark = high probability of occurrence, light = low probability of occurrence). IndVal and significance level (*P < 0.05) obtained from Monte Carlo permutations for each ant species for the three different clusters defined in the SOM.
4 Discussion
According to the similarity of community compositions, the 14 sampling sites examined in this study were divided into three clusters by training the SOM. The different clusters not only reflected differences in species composition, but also differences in land use types between sampling sites (Table 1, Fig. 2). Based on the obtained clusters, the differences between cluster X (open environments) and cluster Y (forested environments) were intuitive within the context of land use type (Fig. 2). However, at higher levels of resolution (e.g., the different forest types contained within sub-cluster Y1 and Y2), the effect of land use type was less apparent as there was some overlap between species in areas of evergreen and shrine forest (Fig. 2A). Although sub-clusters Y1 and Y2 were characterized as having the same land use type and similar vegetation type, the environmental conditions in these areas were different. We therefore examined instances in which land use type was the same but the samples were split between sub-clusters Y1 and Y2 in greater detail. The findings showed that, for example, study site S01 was located in the saddle of a mountain ridge while site S04 was located on topographically flat ground in the center of an urban area, and site S11 had no weeds on the forest floor. Compared to the forested sites in sub-cluster Y2, all three of these sites were relatively dry. It therefore seems likely that the differences between sub-clusters Y1 and Y2 may be related to microhabitat conditions in forests.
The results of the SOM analysis corroborated the findings of the DCA based on the same data. However, given the likelihood that unique and duplicate species could easily be overlooked in the total inventory for each sampling site, we re-analyzed the data after excluding such species. The clustering produced by DCA changed, while that produce by the SOM method remained unaffected. We therefore consider that SOM clustering is more robust than DCA clustering.
In addition, DCA scatterplots of species clusters were less well defined, with the data for species being highly dispersed in the multivariate state space of the scatterplot. It was therefore difficult to understand the relationship between the obtained clusters and distinct species [12]. However, the SOM method with IndVal values clearly distinguished between the different species in each cluster displaying statistical values (Fig. 5).
Among the indicator species in cluster X, Tetramorium tsushimae was shown to prefer open land [Fig. 5], which has been reported previously [40]. Similarly, Tetramorium bicarinatum, an invasive species with a global distribution, has been reported to be particularly common in open habitats, such as farmland, urban parks, and coastal areas [Fig. 5] [41,42]. In addition, Pheidole noda, an indicator species in cluster X and sub-cluster Y2, has been recorded in open areas and woodland [Fig. 5] [40]. Thus, previous reports corroborated our results based on IndVal values and SOM clusters [40–42]. Other indicator species, such as N. sakurae, V. benzai, and C. sauteri, were present in all habitats, albeit in limited numbers. Taken together, these results indicated that ant species were not randomly distributed and that the distribution patterns of ant species were related to habitat suitability [43].
In conclusion, the SOM was found to be an effective analytical tool for understanding the responses of ant communities and individual species to different habitat characteristics, particularly given the consistency of SOM results and the ability to assess the relative importance of each species in each habitat. Finally, the ant community structure in a habitat within the same land use type was not affected by different collectors or collection times, indicating that ants are particularly well suited for monitoring ecosystem conditions. The application of SOM methods to analyze ant communities could therefore be used as an ecological map with which to illustrate changes in community distribution in response to environmental stressors and to develop a general strategy for conserving biodiversity in urban environments.