

1 Introduction
Worldwide freshwater ecosystems face a range of anthropogenic pressures, including pollution, flow regime alterations, overfishing, habitat destruction, and biological invasions. In particular, many lowland regions concentrate agricultural and/or industrial activities, which adversely affect biological diversity in rivers [1]. Important sources of agriculture-derived pollution are the inflow of nutrients, pesticides, and heavy metals [2–4]. Industrial activities can be a source of a variety of other xenobiotic substances that, through run-off and/or precipitation, affect the water bodies [5]. Because river sediments have a strong adsorption capacity for pollutants [6–8], contamination is often greater within sediments than within the water column [9]. Also, sediments can behave as reservoirs of heavy metals that are then released into the water column and/or accumulate in plant and animal tissues before entering food chains [10–13]. The consequences of elevated nutrient concentrations on freshwater diversity are well known [14], but the effects of heavy metals on the composition of biological communities and species abundance patterns are widely understudied [15–17]. Moreover, whilst heavy metals have obvious impacts on individuals and populations (e.g., mouthpart deformities in aquatic insects [18]), such effects do not necessarily echo at the community level [19], thus complicating the assessment of ecosystem health through routine biological surveys. Therefore, in light of both economic development and current water policies schemes (e.g., the US Clean Water Act or Europe's Water Framework Directive 2000/60/EC), characterizing the impacts of nutrient and heavy metal pollution on ecosystem health through Biological Quality Elements (BQEs, either fish, macroinvertebrates, aquatic plants or microalgae) is of major relevance to identify threats to freshwater ecosystems, and to design local-to regional-scale management plans.
Macroinvertebrates constitute an important component of secondary production within freshwater ecosystems, and are tightly integrated into the structure and function of their habitats (organic matter processing, nutrient retention, food resource for amphibians, fish, or birds) [20]. Hence, they are widely used as biological indicators of ecosystem health [21,22], because the structure of macroinvertebrate communities is expected to vary consistently in relation to the intensity of any given disturbance type in any given area. In running waters, most taxa are benthic and therefore related to the sediment, making them potential bioindicators of sediment quality where heavy-metal pollutions are identified or suspected [23–26]. Identifying the (combined) effects of various types of contaminants on macroinvertebrate community structure is however challenging, because of the spatial covariance in different physicochemical factors that independently account for community diversity patterns. In addition, ecological data such as macroinvertebrate and environmental variables often vary and co-vary in a nonlinear fashion. Thus, nonlinear modelling methods should theoretically be preferred to illustrate relationships between physicochemical gradients and community patterns [27].
To be effective, environmental management efforts must rely on explicit distribution schemes that “map” the patterns of biological and physicochemical quality indicators in a readily interpretable manner. In this study, we assessed the influence of a set of water chemistry parameters (including heavy metal concentrations) on the community composition and abundance patterns of macroinvertebrates at the river catchment scale, using Artificial Neural Networks (ANNs). Neural networks have been successfully implemented in various aspects of ecological modeling such as classifying groups, patterning complex relationships, predicting population and community development, modeling habitat suitability, and assessment of water quality [28]. Combining clustering and ordering abilities, the Self-Organizing Map algorithm (SOM, unsupervised ANN [29]) has shown particular relevance to pattern detection in biological communities in relation to environmental data, because the gradient distribution of some environmental variables (here heavy metals and water chemistry) can be visualized in a SOM previously trained with biological variables [30,31]. The Nestore River basin (Central Italy) provides a suitable context to examine how macroinvertebrate communities respond to chemical (nutrient) and heavy metal contamination in space and time, because it is affected by numerous sources of pollution resulting from urbanization, industry, agriculture, and extensive livestock production. In addition, sewage systems in the area are either inefficient or absent. We sampled macroinvertebrate communities in a range of undisturbed to contaminated sites (according to the site classification by the Regional Environmental Agency [32]) at various seasons, and used SOM, in order to:
- • relate community diversity to gradients of pollution;
- • bring out either congruent or differing patterns between particular chemical and/or heavy metal contaminants.
2 Methods
2.1 Study area
This study was conducted in the Nestore River basin, Umbria, Central Italy (Fig. 1). The drainage basin area is 1116 km2, and the length of the main stream is 48 km [33]. The Nestore River is a right tributary of the Tiber River. It originates in southwestern Umbria, from multiple localized springs [34]. Economy within the basin consists in industrial and agricultural activities, as well as livestock production.
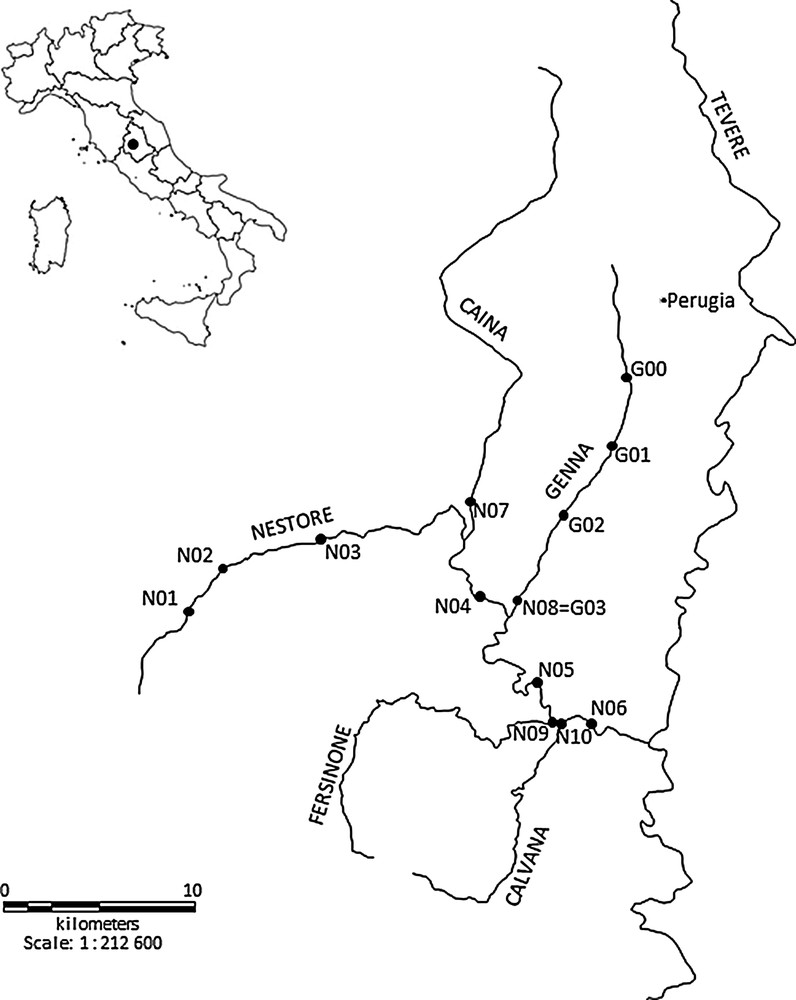
The drainage basin of the Nestore River (Central Italy) and location of the sampling stations.
The main left tributaries of the Nestore River are the Genna (23 km) and Caina streams (31 km) (central-eastern and northern parts of the basin). These streams drain urbanized areas, with industrial, agricultural and livestock activities. The main right tributaries are the Fersinone (25 km) and Calvana streams (18 km) (southwestern part of the basin), which flow through sparsely populated areas. Both the Nestore River and its tributaries are characterized by variable hydraulic regimes [32].
2.2 Sampling stations and schedule
The sampling plan consisted of two different surveys, one covering the whole Nestore River basin (N), and a second one covering the Genna Stream (G, left tributary) (Fig. 1). The first survey (N) extended from March 2010 to October 2010 and consisted of four seasonal sampling sessions (March, June, August, October). Ten sampling stations were selected, six along the Nestore River (N01–N06) and four in its main tributaries, just before their confluence with the Nestore River (N07 = Caina Stream; N08 = Genna Stream; N09 = Fersinone Stream; N10 = Calvana Stream). The second survey (G) lasted from March 2012 to October 2012 and consisted of three seasonal samplings (March, June, October). Four sampling stations were identified along the Genna Stream (G00–G03; G03 = N08). Stations N09 and N10 from the first survey were not sampled in October, and in August and October respectively due to dryness. For the same reason, station G00 from the second survey was not sampled in March and October. The main characteristics of the sampling stations are given in Table 1. In each station, macroinvertebrate samples were collected with a dragnet (kick method) equipped with a 335 μm mesh. The sampling time was standardized at 10 min, from bank to bank, considering all the microhabitats present [35]. The samples were fixed in 70% alcohol. In the laboratory, macroinvertebrates were identified to species, genus or family level using various taxonomic keys [36] and enumerated.
Main characteristics of the sampling stations.
| Code | River | Elevation | Width | Average depth |
| N01 | Nestore | 303 | 3 | 0.15 |
| N02 | Nestore | 263 | 7 | 0.50 |
| N03 | Nestore | 232 | 6 | 0.20 |
| N04 | Nestore | 203 | 13 | 0.25 |
| N05 | Nestore | 182 | 15 | 0.55 |
| N06 | Nestore | 174 | 21 | 0.50 |
| N07 | Caina | 215 | 8 | 0.20 |
| N08 = G03 | Genna | 199 | 7 | 0.35 |
| N09 | Fersinone | 179 | 11 | 0.30 |
| N10 | Calvana | 185 | 11 | 0.20 |
| G00 | Genna | 243 | 4 | 0.15 |
| G01 | Genna | 225 | 5 | 0.35 |
| G02 | Genna | 209 | 5 | 0.25 |
| G03 = N08 | Genna | 199 | 7 | 0.35 |
2.3 Chemical and physicochemical characterization of surface water
The following four physicochemical water parameters were measured seasonally in situ, always at the same daytime: temperature and dissolved oxygen (DO; Oximeter F-Simplair Syland Scientific, accuracy 1% of the scale value, measuring range: 0.0–20.0 O2 mg·L−1), pH (pH-meter Hanna Instruments HI-98150, range: –4.00–19.99, resolution 0.01 pH, precision ± 0.02 pH); conductivity (HI8733-Hanna Instruments, range: 0–1999 μS·cm−1, accuracy 1%, resolution 1 μS·cm−1).
Seasonal water samples were also collected in 500-mL polyethylene bottles, and then stored at 5 °C in the refrigerator for subsequent anionic and cationic characterization and COD determination.
Chemical oxygen demand (COD) determination was performed by colorimetric method (Smart 2 Colorimeter La Motte Company, COD Low Range Reagent Kit, 0–150 mg·L−1 COD, detection limit 0.5 mg·L−1). The concentrations of anion and cation species (anions = F–, Cl–, NO2–, Br–, NO3–, PO43–and SO42–; cations = Li+, Na+, NH4+, K+, Mg2+ and Ca2+) were determined by suppressed ion chromatography with a conductivity detector using a Dionex Series 4500i chromatograph. Commercially produced standard solutions (Fluka-TraceCERT® Standard Solutions, 1000 mg·L−1 ± 4 mg·L−1) in ultrapure water (18.2 MΩ at 25 °C) were used to prepare appropriate calibration standards. The analyses were operated after filtration of samples with cellulose filters (0.2 μm) [37]. Li+ was excluded in subsequent analyses because it was below detection limits in every sample.
2.4 Heavy metals in sediments
Samples of bottom sediments were taken at each sampling date for heavy metal analyses. Sediment samples were obtained by dredging the superficial layer (about 5 cm) of the bottom sediments with a hand dredge. The samples (500 g) were preserved in Pyrex glass bottles and kept refrigerated at –18 °C [38].
Concentrations of heavy metals in sediments (Cr, Cd, Cu, Ni, Zn and Pb), for the first survey (N), were determined by flame Atomic Absorption Spectrometry (AAS, PerkinElmer 3300, instrumental detection limit 0.01–0.20 mg·L−1) after sample acid digestion. Commercially produced standard solutions (Fluka-TraceCERT® Standard Solutions, 1000 mg·L−1 ± 4 mg·L−1) in 2% nitric acid, were used to prepare appropriate elemental calibration standards [38,39]. Concentrations of heavy metals (Cr, Cd, Cu, Ni, Zn and Pb) in sediments samples, for the second survey (G), were determined by Inductively Coupled Plasma Optical Emission Spectrometry (ICP-OES, Ultima 2, HORIBA Scientific) equipped with ultrasonic nebulizer (CETAC Technologies, U-5000AT) after sample acid digestion. Instrumental detection limits were in the range 0.14–1.58 μg·L−1. Commercially produced (ICP multi-element standard solution IV CertiPUR®, VWR Merck Chemicals and Reagents) standard solutions (1000 mg·L−1) in nitric acid were used to prepare appropriate elemental calibration standards [18,38].
The sediment samples from both surveys were air-dried, disaggregated using a mortar and pestle to pass through a 2-mm mesh sieve, dried at 105 °C for 24 h and digested as follows: 15 mL of concentrated ultrapure nitric acid (Fluka, TraceSELECT®, for trace analysis ≥ 69%) were added to the sample (2.0 g) and heated to 160 °C for 1 h; then, the vessel was cooled to room temperature and 10 mL ultrapure concentrated hydrochloric acid (Fluka, TraceSELECT®, for trace analysis ≥ 37%) were added and the flask was heated to 160 °C for 1 h. The mixture was cooled, filtered (Whatman Grade No. 42, particle retention 2.5 μm) and diluted with ultrapure water to 50 mL.
2.5 Modeling procedure
To sort the 47 samples (2010 survey (N): 37 seasonal samples at ten stations; 2012 survey (G): 10 seasonal samples at four stations), we used the Self-Organizing Map algorithm (SOM Toolbox version 2 for Matlab®, see [40] for practical instructions). The strengths of the SOM in comparison with conventional multivariate analyses were discussed in [41]. Combining ordination and gradient analysis functions, the SOM is convenient to visualize high-dimensional data in a readily interpretable manner without prior transformation. The SOM algorithm is an unsupervised learning procedure that transforms multi-dimensional input data into a two-dimensional map subject to a topological (neighbourhood preserving) constraint (detailed in [42]). The SOM thus plots the similarities of the data by grouping similar data items together onto a 2D-space (visualized as a grid) using an iterative learning process that was detailed in [30]. The SOM algorithm is specifically relevant for analyzing sets of variables that vary and co-vary in non-linear fashions, and/or that have skewed distributions. Additionally, the SOM algorithm averages the input dataset using weight vectors through the learning process and thus removes noise. A full description of the modeling procedure employed here (training, map size selection, number of iterations, map quality measurements) was detailed in [30,31].
The structure of the SOM for this analysis consisted of two layers of neurons connected by weights (or connection intensities): the input layer was composed of 78 neurons (one per invertebrate taxon) connected to the 47 samples, and the output layer was composed of 35 neurons visualized as hexagonal cells organized on an array with seven rows and five columns. The number of 35 output neurons was retained after testing quantization and topographic errors (QE and TE, see [31]). We note in passing that the map size, based on local minimum values for QE and TE, matched well the heuristic rule by [43] reporting that the optimal number of output neurons is close to 5√n, with n the number of samples. At the end of the training, each sample is set in a hexagon of the SOM map. Samples appearing distant in the modeling space (according to the invertebrate abundance data used during the training) represent the expected chemical differences for real environmental characteristics. A k-means algorithm was applied to cluster the trained map [44]. The SOM units (hexagons) were divided into 2–8 clusters according to the weight vectors of the neurons, and the final number of clusters (3) was justified according to the lowest Davis Bouldin Index, i.e. for a solution with low variance within clusters and high variance between clusters [45]. In order to analyze the contribution of each macroinvertebrate taxon to cluster structures of the trained SOM, each input variable calculated during the training process was visualized in each neuron (hexagon) of the trained SOM in grey scale. This visualization method directly describes the discriminatory powers of input variables in mapping [42].
Finally, in order to bring out relationships between abiotic and biotic variables, we introduced the 23 chemical, physicochemical and heavy metal variables into the SOM, which was previously trained with the abundance data for the 78 macroinvertebrate taxa. During training, we used a mask function to give a null weight to the 23 chemical, physicochemical and heavy metal variables, whereas the biological ones were given a weight of 1 so that the ordination process was based on the 78 macroinvertebrate taxa only [1]. Setting mask value to 0 for a given component removes the effect of that component on organization [46].
In order to further highlight macroinvertebrate community and environmental patterns among clusters, the distributions of taxonomic richness, number of individuals, community evenness (Simpson index) [47], community entropy (Shannon index) [48], Chao index [49,50], physicochemical and heavy metals variables were compared among clusters using Mann-Whitney tests. These statistical tests were performed using the Past software (version 3.02) [51].
3 Results
3.1 Classification of samples and invertebrate distribution patterns
Based on minimum quantization and topographic errors, the map size was selected as 7 × 5 neurons. The 35-unit map trained with macroinvertebrate abundance data had a quantization error of 0.117 and a topographic error of 0.0001. This map thus preserved well the typology of the input data [42], and was relevant for subsequent interpretations. After training the SOM algorithm with the macroinvertebrate abundance data, the k-means algorithm helped to delineate three clusters of samples (clusters A–C) according to the quantitative structure of macroinvertebrate assemblages (Fig. 2a). The SOM clustering revealed both spatial and seasonal variation in the macroinvertebrate community structure. Cluster A grouped four samples from the most upstream, headwater stations N01-N02. Cluster B grouped all samples from stations N09-N10 (right tributaries of Nestore River), and mostly spring (March) samples from N01-N08. Cluster C grouped all seasonal samples from Genna stream (except N08 in March) and almost all summer to autumn samples of stations N03–N07 also grouped in cluster C.
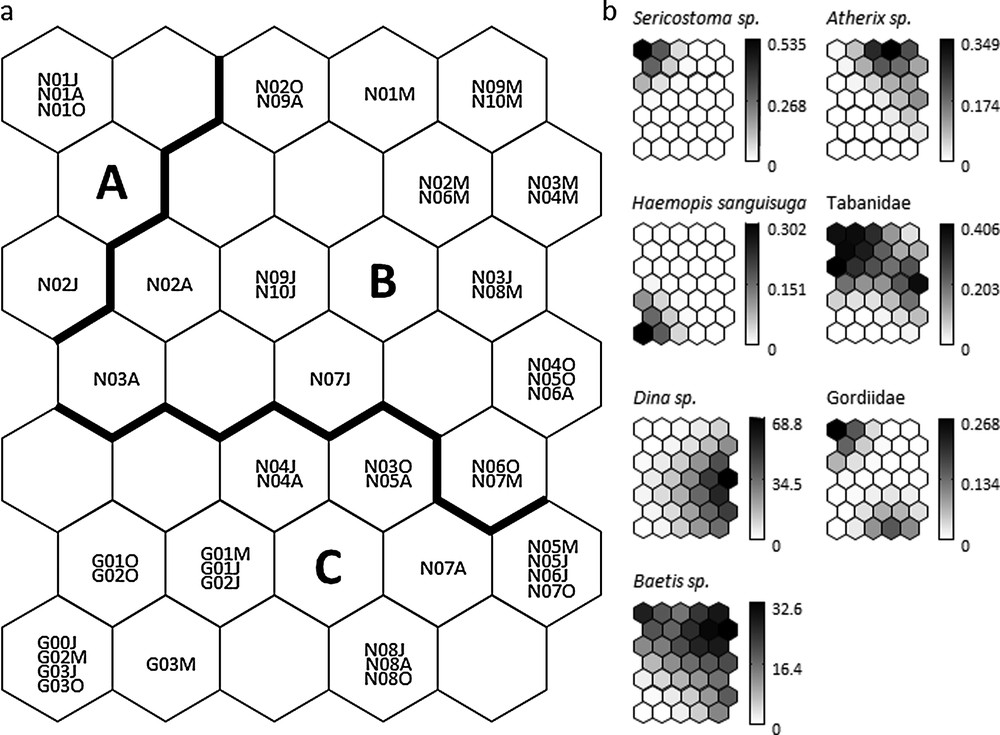
a: distribution and clustering of samples on the self-organizing map (SOM) according to the abundance of 78 macroinvertebrate taxa. Codes within each hexagon (e.g., N01M, G03J) correspond to individual samples (see also Table 1): N (Nestore survey, 2010), G (Genna survey, 2012), 00-10 sampling stations, M = March, J = June, A = August, O = October. Clusters A–C (separated by the bold line) were derived from the k-means algorithm applied to the weights of the 78 taxa in the 35 output neurons of the SOM; b: gradient analysis of the abundance (number of individuals) for selected taxa (exclusive of each cluster: Sericostoma, cluster A; Atherix, cluster B; Haemopis sanguisuga, cluster C; and shared between clusters: Tabanidae, cluster A and B, Dina, cluster B and C; Gordiidae, cluster A and C; Baetis, cluster A, B and C) on the trained SOM represented by a shaded scale (dark = high abundance, light = low abundance).
When the distribution of each macroinvertebrate taxon was visualized on the trained SOM using a shading scale (see Fig. 2b for selected taxa), cluster A had eight taxa that were not found in other clusters (Deronectes moestus (Fairmaire), Elmis, Gyrinus, Halesus, Haliplus, Helophorus, Mystacides azurea (Linnaeus), Sericostoma); cluster B had 10 specific taxa (Atherix, Choroterpes picteti (Eaton), Gyraulus, Muscidae, Nemoura, Paraleptophlebia, Pisidium, Potamon fluviatile (Herbst), Potamopyrgus antipodarum (Gray), Siphonoperla torrentium (Pictet)); and cluster C had four taxa that were not found in other clusters (Culicinae, Haemopis sanguisuga (Linnaeus), Procambarus clarkii (Girard), Trocheta). Hence, these taxa contributed most to the delineation of the three clusters, and can be considered as indicators of environmental conditions associated with the corresponding samples.
3.2 Environmental gradients
Chemical, physicochemical and heavy metal variables were introduced into the SOM previously trained with macroinvertebrate data, thus forming explanatory variables (Fig. 3); in particular, the ordinate on the SOM showed a gradient of pH, DO and Ni, from low (bottom) to high (top of the map), and a reverse gradient of Pb and NO2–. Values for Cl–, PO43–, Na+, NH4+, K+, Cd, Cu, COD and conductivity increased from right-top to left-bottom areas of the map. We also noted gradients of F– and NO3– from left-top to right-bottom areas of the SOM.
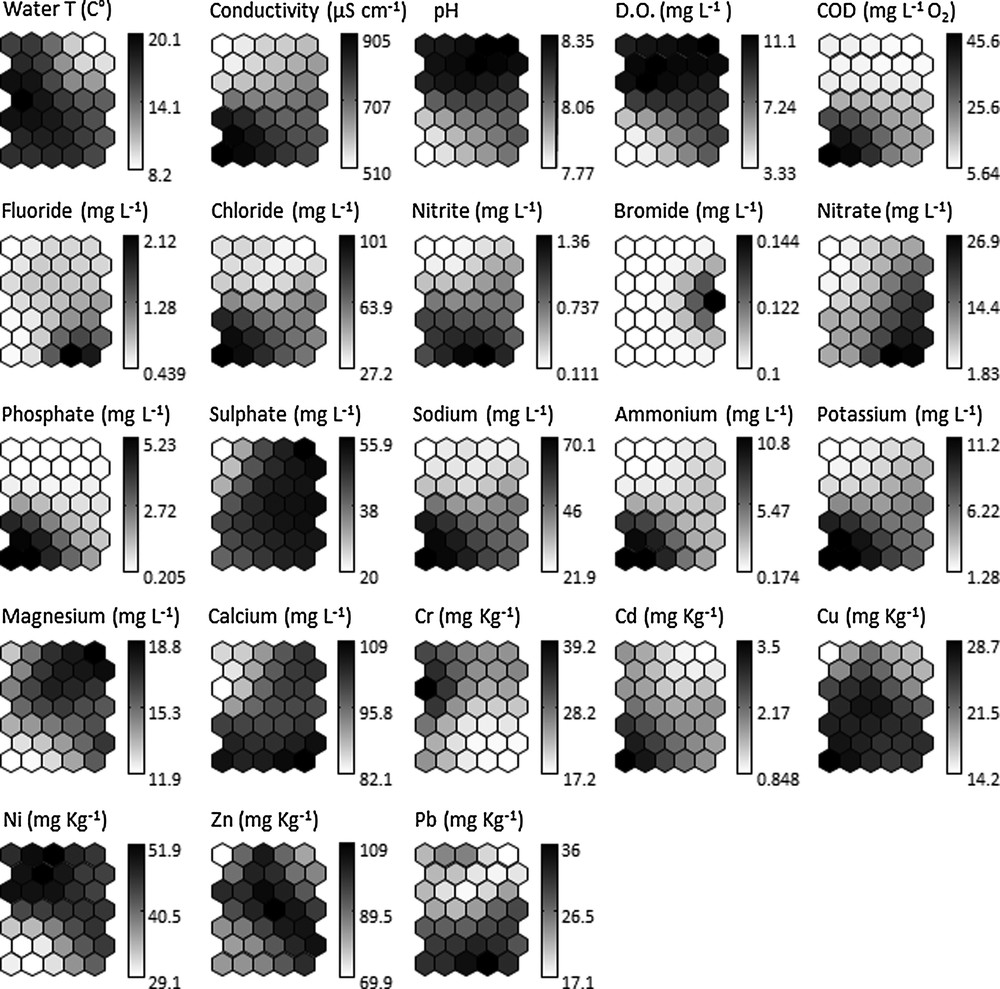
Visualization of physicochemical parameters of water and heavy metals of sediments (shades of gray). The mean value for each variable was calculated in each output neuron of the SOM previously trained with macroinvertebrate data. Darker/lighter tones represent higher/lower values.
3.3 Between-cluster variability
Box-plots of diversity metrics (Fig. 4) showed a trend for decreasing community diversity from cluster A to cluster C. Specifically, taxonomic richness and the Chao index differed significantly among clusters (Mann-Whitney tests, P < 0.05), Simpson's evenness differed between clusters A and C, and Shannon's entropy was significantly different between cluster C and other clusters. Last, there was no significant difference in terms of number of individuals among clusters. Clusters A and B were characterized by higher values for pH, DO and Ni, and cluster C was characterized by higher values for F–, Cl–, PO43–, Na+, NH4+, K+, Cd, Cu, Pb, NO2–, NO3–, COD and conductivity. Only conductivity and K+ differed significantly among all three clusters (Mann-Whitney tests, P < 0.05). Values for pH, DO, COD, Cl–, PO43–, Na+, NH4+, Cr and Ni differed significantly between cluster C and other clusters. NO3– and SO42– were significantly different between clusters A and other clusters. Mg+2 was significantly different between clusters B and other ones. Water temperature and Cd differed between clusters B and C, and Ca+2 differed between clusters C and A. Finally, F–, NO2–, Br–, Cu, Zn and Pb showed no significant differences among clusters.
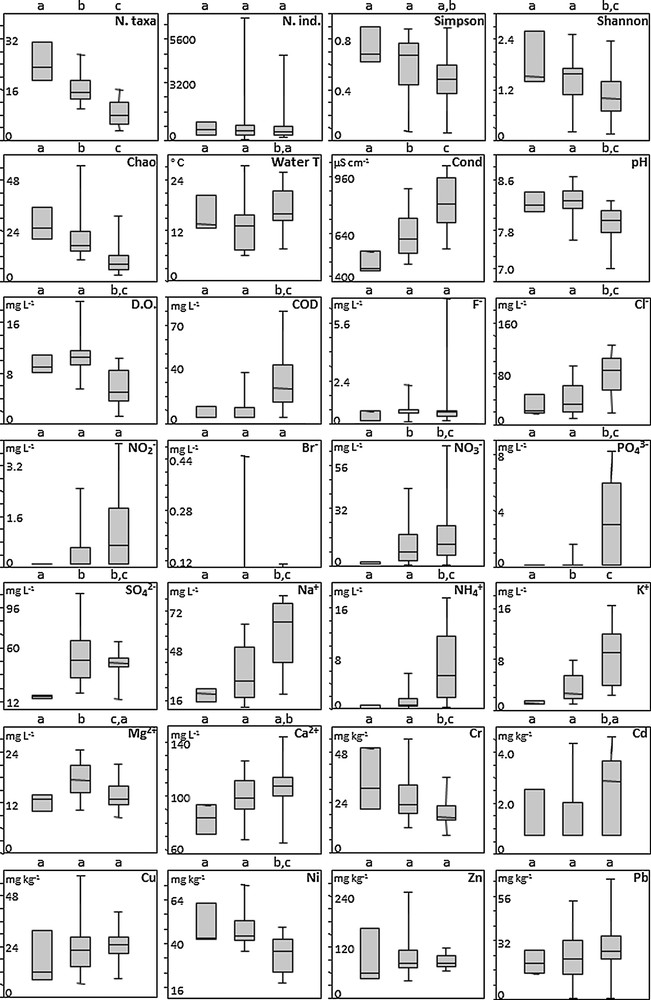
Boxplots of diversity metrics (taxonomic richness, number of individuals, Simpson, Shannon and Chao indices) and environmental variables (physicochemical parameters of water, heavy metals in sediments) for the three clusters. Significant differences between clusters were tested with Mann-Whitney tests; lowercase letters above boxes indicate significant differences at P < 0.05.
4 Discussion
Environmental management planning requires explicit schemes such as distribution patterns of biological diversity in relation to geomorphological, physical, and/or chemical attributes of ecosystems, to subsequently evaluate the deviation from a reference state, define quality objectives, and eventually anticipate ecological risk. Among the questions that are asked of the scientific experts, the most common ones are probably the following:
- • which areas within a regional system are most impacted by industrial or agricultural activities?
- • which physical and/or chemical stressors are detrimental to the biological quality of recipient ecosystems?
Additionally, if threats associated with current activities and future development plans align with zones of conservation interest (e.g., presence of flagship species), this could add new impetus to freshwater management policies. Given these settings, the SOM visualization has proven an efficient analytical tool to illustrate relationships between sample locations, biological and environmental variables [31]. Through its iterative learning process, the SOM also minimizes the problem of outliers (e.g., presence of singletons) where each outlier is assigned to one unit of the map, and only the weights of that unit and its nearest neighbours are affected. Finally, by overlapping species and or explanatory variable maps, any spatial overlap or segregation on the output map becomes clear and can be interpreted in a straightforward manner.
SOM clusters revealed spatial, and to a lesser extent seasonal patterns of macroinvertebrate communities in relation to environmental quality and land use in the Nestore drainage basin. Among different taxa, Trichoptera and Coleoptera particularly declined from cluster A to cluster C both in terms of number of taxa and abundance of individuals, while Annelida (Tubificidae and Hirudinea) showed increasing numbers of taxa and individuals. However, based on macroinvertebrate community structure, some stations could shift from one cluster to another according to the season. Interestingly, Nestore stations N03–N08 tend to shift from cluster B (intermediate pollution) to cluster C (heavier pollution) in summer–autumn, although these seasons theoretically correspond to the renewal of populations through reproduction and egg hatching, and are therefore supposedly species-rich periods for stream invertebrates [52]. Further data on agricultural–industrial practices would be needed to properly assess whether temporal shifts in local biodiversity are mostly related to invertebrate seasonality (life cycle patterns) or to seasonal patterns in water pollution (e.g. intensified agricultural practices in summer).
With regard to spatial patterns, land use influences the chemical and biological characteristics of river ecosystems [53] and the structure of lotic macroinvertebrate communities may be subsequently influenced by economic activities within catchments [54]. Here, the introduction of explanatory variables into the SOM trained with macroinvertebrate data provided additional insights into our understanding of community patterns in relation to human activities. Several chemicals and heavy metals showed congruent patterns, although the latter variables were given a null weight during the ordination and classification process (i.e. they did not influence the grouping of samples); in particular, higher Cr and Ni concentrations were associated with higher pH and DO in clusters A and B. Headwater reaches of the Nestore (stations N01 and N02, cluster A) are only surrounded by sparse habitation. Economic activity in the area is limited to a glass factory, located upstream of station N02. Stations in cluster B are either surrounded by intensively farmed landscapes and urban/industrial lands. Ni and Cr could thus be waste products of different types of industries. Stations in cluster C showed higher concentrations of Pb, Cd and Cu matched to the increasing gradients of conductivity, COD, nitrate, nitrite, ammonium, phosphates, chloride, sodium, and potassium. Accordingly, all stations in cluster C are surrounded by intensive agricultural activities and livestock (80 farms recorded in the area). Lower values for DO (oxygenation of the water) for this cluster (Genna Stream and the lower Nestore River) suggest a high level of organic pollution. Higher Cu concentrations can be related to livestock as it is used in food for animals, and contaminated sludges are then used in agriculture as soil fertilizers [55]. In addition, Cu is present in pesticides and fertilizers, but can also be waste product in industry.
Whilst the SOM illustrated co-variation in community structure and a series of nutrients and heavy metals, it remains difficult to establish the specific effect of the various stressors upon macroinvertebrate community composition. This is however inherent to observational field studies where anthropogenic disturbance subjects biological communities to mixtures of pollutants. Nevertheless, the SOM analysis of the biological data did well at revealing the extent of pollution among stations, to assess water quality at the drainage basin level. Further studies under experimental conditions would be needed to examine how heavy metals act and interact in nature to the detriment of certain taxa, either in terms of occurrence and abundance patterns. On an empirical basis, however, a common and efficient way to assess environmental quality remains to interpret the distribution of biological indicators across gradients of environmental conditions.
In conclusion, qualitative and quantitative changes in macroinvertebrate communities in space (sites) and time (seasons) can be expected in relation to anthropogenic disturbance that affect water chemistry at local to stream-system levels, together with potential changes in terms of biological traits. Whilst biological indices are a universal tool to rate river health, spatial schemes of community organization still provide the explicit models against which deviation from reference conditions, in the form of scores or water quality classes, are assessed [56]. Owing to the limited size of our dataset, we did not attempt to design a biotic index that would fit, for instance, the well-known guidelines of the EU Water Framework Directive. Still, through the SOM clustering, the ecological health of river ecosystems can be mapped in a readily interpretable manner, taking into account gradients of chemical pollution sensu lato.
Disclosure of interest
The authors declare that they have no conflicts of interest concerning this article.
Acknowledgements
The Foundation “Cassa di Risparmio di Perugia” (Italy) provided financial support for this research. Two anonymous reviewers provided insightful comments on an earlier version of this paper.