

1 Introduction
The term Sepsis refers to a complex clinical syndrome observed in patients who exhibit a systemic inflammatory response syndrome (SIRS) along with an infection [1]. It may progress to a severe sepsis if acute organ dysfunction occurs. A septic shock is the combination of a severe sepsis with an acute fall in blood pressure that does not respond to treatments.
Septic syndromes represent approximately 750,000 cases per year in the United States [2] and it remains the first cause of mortality in intensive care units (ICUs). Although in the last 10 years an improvement has been observed, commonly ascribed to the Surviving Sepsis Campaign [3], the mortality of severe septic syndromes remains high, reaching in some settings 50% for septic shock [2,4,5]. The incidence of septic syndromes increased during the last decade [6–9], which implies a considerable burden for healthcare systems. As recently evidenced by the National Center for Health Statistics, septic syndromes were, with an estimated annual cost of 1.8 billion dollars, the most expensive reason for hospitalization in the United States in 2011 [10].
Despite extensive research, no specific treatment exists for septic syndromes. One of the most recent cases of failure was AstraZeneca's AZD9773 [11], a polyclonal antibody against the major inflammatory mediator TNF-α, whose development was stopped in August 2012, while still in phase II. The withdrawal of activated protein C (Xigris) from the market, in October 2011, constitutes another example of failure in this field [12].
In light of the complexity of the underlying mechanisms and taking into account the high number of entities and mediators involved during a SIRS, we believe that a systems biology approach could be an alternative for analyzing the innate immune system responses during septic syndromes. Based on the assumption that most severe sepsis cases ultimately stem from the loss of natural control over the initial inflammatory response, we employed bioinformatics in order to pinpoint the mechanisms potentially involved in the loss of such control.
Several studies have been published in the last few years, in which microarray-based techniques are used to obtain genome-wide transcription snapshots of the immune function in several clinical setups related to SIRS and sepsis [13]. Among those, the highly cited 2005 Calvano's study [14] continues to be considered seminal work, for it was the first to focus on the resolution of an artificially induced SIRS in healthy individuals. Also based on microarray experiments, Sutherland et al. [15] conducted a multi-centre and prospective clinical trial in order to establish a novel molecular biomarker diagnostic test for the early detection of sepsis.
To our knowledge, no transcriptomic comparative study exists between healthy individuals, in whom a SIRS is rapidly controlled, and septic patients, in whom such control has been lost. Based on previously published gene expression raw datasets, we compared the pathological to the non-pathological cases, through the analysis of the most relevant biochemical mechanisms involved.
2 Materials and methods
2.1 Datasets
The number of original articles based on microarray experiments published yearly passed from a couple of hundreds in the year 2000 to more than 5000 by the end of the decade. Notwithstanding the high degree of heterogeneity that characterizes microarray experiments, a systematic review of literature [13] and public gene expression repositories (e.g., gene expression omnibus) enabled us to find two relevant datasets in order to compare the pathological and the non-pathological systemic inflammatory responses.
We used the openly shared raw datasets from both Calvano's et al. [14] and Sutherlands's et al. [15] studies (data accessible at NCBI GEO database [16] with the references GSE3284 and GSE28750, respectively).
In the first study, the researchers analyzed the inflammatory response dynamically. Data from Calvano's et al. study originally comprises two subsets: the first one, obtained in a group of 8 healthy volunteers was used by the authors to conduct functional analyses; the second one, obtained in an independent group of 6 healthy volunteers was used for validation purposes. At a glance, the first subset, composed of 8 healthy individuals, 18- to 40-years-old, was divided into two groups to receive either intravenous LPS (i.e. lipopolysaccharide) or placebo. Blood samples were collected at t = 0 (i.e. just before the injection), and at t = 2, 4, 6, 9 and 24 h. Leukocytes were separated and a genome-wide transcriptomic analysis was conducted onto oligonucleotide arrays (Affymetrix Hu133A and Hu133B). The second subset was drawn from the experience conducted in six healthy individuals, also divided into two groups to recieve either intravenous LPS or placebo. Blood samples were taken at t = 0 hours (i.e. just before the injection), then at t = 2 hours and at t = 6 hours. Affymetrix Human Genome U133 Plus 2.0 chips were used to get a genome-wide transcriptomic picture of the biochemical processes induced by the LPS stimulus.
In Sutherland's study [15], the main objective was to identify biomarkers for the early detection of sepsis. For that, the authors conducted a prospective study in four intensive care units in Australia between 2007 and 2009. Data from this study comprises three subsets: a sepsis group (n = 10), a post-surgery group (n = 11) and finally a control group (n = 20). The main inclusion criteria for the sepsis group were patients over 18 years, enrolled within 24 h of admission, presenting clinical suspicion of sepsis as defined by the ACCP consensus/SCCM 1992 [1] and whose infection had been confirmed a posteriori. The second subset consists of patients recruited before a surgery and that had developed a systemic inflammatory response (not infectious) within the 24 h following the intervention. The last subset consisted in adults from the medical staff of the hospital, without any concurrent illnesses at the time of blood collection nor any past history of immunological dysfunction. Blood tests were performed for the three subgroups, leukocytes were isolated and hybridization was then performed using Affymetrix Human Genome U133 Plus 2.0.
2.2 Microarray data pretreatment
Because we had to handle data sets produced by different research groups, we started from collected raw data sets and applied to them the same standardized pretreatment procedures. Raw data expression files were loaded and analyzed with R (v3.1.1) and Bioconductor [17]. The CEL files were imported into R environment. Before any differential expression analysis, all raw datasets were preprocessed using both the affy library [18] and the liwong probe summary method [19].
2.3 Microarray data analysis
This part of the work was conducted in two stages. The first phase was based on the first subset of the database produced during Calvano's et al. study. We analyzed the kinetics of SIRS focusing on the times during which major changes in gene expression were observed. The aim was to confirm, as reported by Calvano et al. that the main immune regulatory processes occur between 0 and 2 h and between 6 and 9 h. We used the maSigPro algorithm developped by Conesa et al. [20] for the analysis of single and multi-series time-course microarray data. An ascending hierarchical classification was then applied and completed with a principal component analysis (unsupervised method) in order to explore differential expression results, minimizing the dimensionality of the data while preserving most of the variation.
The second phase was based on the rest of subsets included in this study. The second subset from Calvano's et al. study was used in order to compare LPS-injected with placebo-injected healthy subjects gene expression values. Differential expression analysis was performed using LIMMA linear models with least squares regression and empirical Bayes moderated t-statistics [21,22]. P-values were adjusted for multiple comparisons using the Benjamini–Hochberg false discovery rate correction (FDR). A corrected P-value of 0.001 was chosen as significance level. Since a list of genes is hardly exploitable as such, genes that were identified as significantly differentially expressed for each time point from the experimental data were exported onto Ingenuity Pathway Analysis software (IPA). This platform was selected for the high quality of Ingenuity's knowledge base and the efficient web-based functional analysis tool that was provided. Specificity of connections for each gene of interest was calculated, allowing us to determine the corresponding expressed canonical pathways. Pathways of higly interconnected genes were identified by statistical likelihood. The same modus operandi was scrupulously applied to the transcriptomic database extracted from Sutherland's et al. study. Ingenuity's software was then employed to compare canonical pathways differentially expressed between the pathological and the non-pathological systemic inflammatory responses.
3 Results and discussion
3.1 Kinetics of an induced systemic inflammatory response
We started by conducting an exploratory analysis of the kinetics of an induced SIRS based on the first subset of the database extracted from Calvano's et al. study.
For this, we realized a temporal analysis using the maSigPro Bioconductor library. With a P-value fixed at 0.001 and a threshold error rate FDR fixed at 0.001, a total of 4601 probe sets were identified as differentially expressed for the six time points, compared with the 5093 initially found in the study conducted by Calvano et al. [14]. Although the algorithms are very similar, in particular those used for normalization and standardization of raw data, there is a fluctuation that can be explained by the use of different software tools (Calvano and his colleagues used dChip).
As presented in Fig. 1, the 4601 probesets previously identified as differentially expressed were displayed as a heatmap graph in order to provide a trend of the kinetics of inflammatory response induced by endotoxin injection. Each line in the graph corresponds to the level of expression of a given probe set; each column represents the results of an array. A color gradient was applied and ranging from dark blue to yellow for under-expressed to over-expressed genes. Firstly, if we focus on the control group, we do not distinguish any fluctuation in the gene expression patterns throughout the 24-h interval. With regard to the LPS group, three distinct phases can be observed. At t = 0 h, that is to say, before the infusion of endotoxin, we can observe that the expression of genes is comparable to that of the 24-h interval in the control group. Between t = 2 h and t = 9 h, we can observe a complete change of gene expression patterns. Finally, between t = 9 h and t = 24 h, the level of regulation of genes gets back into a quasi-steady state as observed at t = 0 h. This graph highlights two interesting phenomena that are a first and rather rapid activation of the immune system during an inflammatory reaction (before t = 2 h) and the regulation of such inflammatory reaction that takes place between t = 2 h and t = 9 h after the first contact with an antigen.

(Color online.) Heatmap graph and hierarchical clustering of significant probesets that were differentially expressed following endotoxin (or saline solution) infusion. The heatmap cell color ranges from blue, i.e. down-regulated, to yellow, i.e. up-regulated, according to the probeset expression level (normalized by Z-score). Columns represent arrays with time points indicated in hours before (0 h) and after infusion (2 h, 4 h, 6 h, 9 h, 24 h); rows represent probe sets.
As a confirmation, a principal components analysis was carried out and presented in Fig. 2. As previously observed, three groups appeared. The first group consists of all microarrays from the control group (represented by hollow dots). Also included in this first group are all microarrays corresponding to time t = 0 h and t = 24 h from the LPS group (solid dots, black and purple respectively). The second group consists in microarrays corresponding to time t = 2 h. Finally, the last group consists in gene expression data for times t = 4 h, t = 6 h, and t = 9 h. This second analysis confirms the previous observations, but also demonstrates that at t = 2 h, expression of genes was significantly different from t = 4 h and t = 9 h.
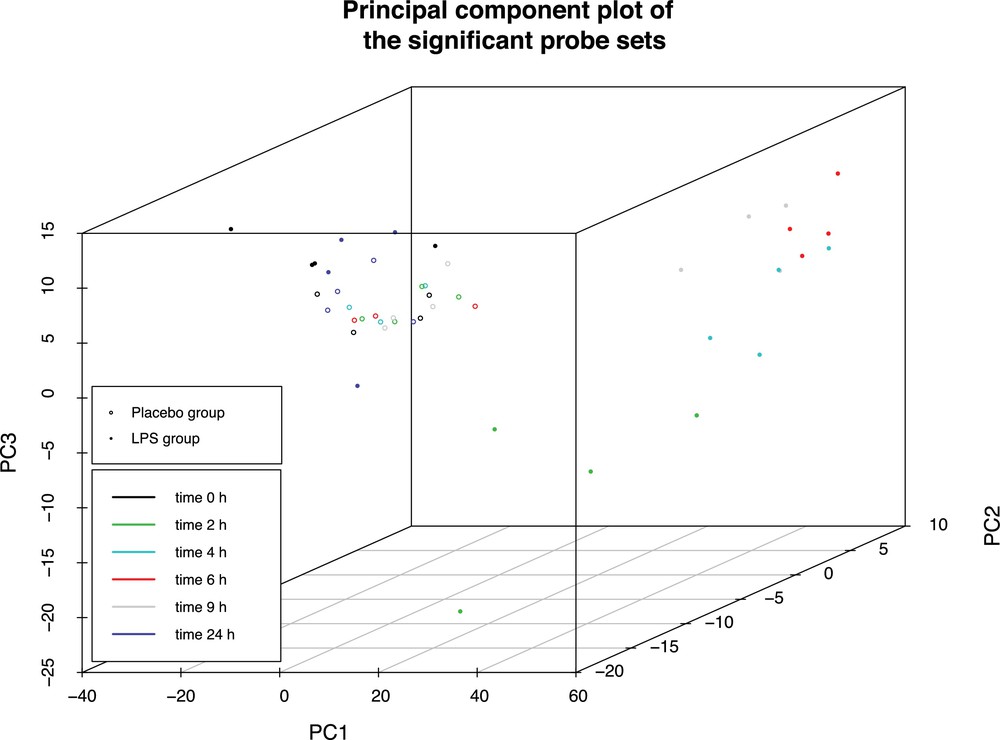
(Color online.) Principal component analysis of the kinetics of an inflammatory response induced by lipopolysaccharide (LPS) infusion. Hollow dots represent expression data of control group, solid dots represent expression of LPS group. A different color is given for each time points, black: t = 0 h, green: t = 2 h, blue: t = 4 h, red: t = 6 h, gray: t = 9 h, purple: t = 24 h.
In order to study more closely what happened between t = 4 h and t = 9 h in the LPS infusion group, maSigPro library was used on the previous dataset to group genes according to their expression level (agglomerative hierarchical clustering based on Ward's method and using correlation distance). It allowed us to analyse the average level of expression of genes in clusters over time (Fig. 3). The graph shows the average gene expression by clusters as a function of time. First we can observe that the red curve (corresponding to control group) remains relatively stable over time, while the green curve (corresponding to the endotoxin infused group) undergoes significant fluctuations. Two phases can be distinguished as a function of these fluctuations. A first intense phase occurs between t = 0 h and t = 2 h, and then it goes slightly up until t = 4 h. A reverse phase then begins between 4–6 h up to 24 h.
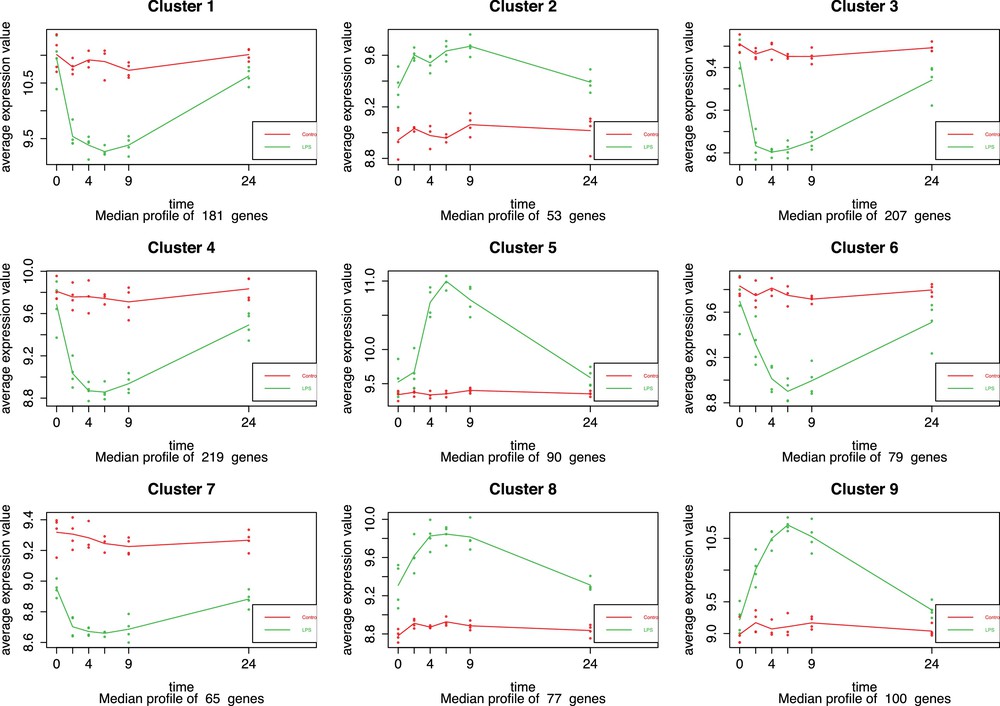
(Color online.) Representation of gene expression profiles by cluster for each experimental group (control group in red and systemic inflammatory response syndrome [SIRS] group in green). Average gene expression profiles are presented according to time points: t = 0 h, t = 2 h, t = 4 h, t = 6 h, t = 9 h, and t = 24 h. Cluster analysis was based on Ward's method (correlation distance) with a hierarchical classification.
3.2 Gene expression during an induced and controlled SIRS, an observed post-chirurgical SIRS and a diagnosed sepsis
The second part of this study is structured around the results obtained with the Limma package for the four observational conditions: SIRS 2 h and 6 h after the injection of lipopolysaccharide, spontaneous SIRS after a surgery and Sepsis. For the first conditions, at t = 2 h after endotoxin infusion, 3099 probe sets were significantly identified, corresponding to 2745 genes. For the second conditions, 6 h after the endotoxin injection, 7779 probe sets were identified, corresponding to 6666 genes. Finally, for the last conditions, 4436 genes (5302 probe sets) on the one hand and 5033 genes (5965 probe sets) on the other hand were identified as differentially expressed in the cases of post-surgical SIRS and septic SIRS respectively. By contrast with the previous part, this analysis was focused on the identification of genes differently expressed according to the context of an induced SIRS by administration of a low dose of LPS. Detailed results of microarray experiment analysis were presented in supplementary material, Appendix S1.
3.3 Functional analysis and comparison between the pathologic and the non-pathologic cases
The purpose of this study was to identify any regulatory mechanisms of the inflammatory response behaving in a different way during a sepsis. We therefore carried out a functional analysis with the use of Ingenuity Pathway Analysis (IPA). The first two sets of Limma exported data are those concerning the expression of genes two hours and six hours after the injection of endotoxin.
As a first step, we were interested in transcription regulators. Those that were identified as playing a significant role (Fisher's exact test, P-value threshold 0.05), are referenced in Table 1. As regards to the SIRS induced group, the regulators of transcription significantly expressed at two hours after LPS infusion were RELA, STAT3 and HMGB2 while those that were expressed at t = 6 h are SATB1, EP300 and FOXP3. RELA and STAT3 are two transcription regulators with a central role for an effective host defense without excessive inflammatory response [23], while HMGB2 plays a central role in nucleic acid-mediated TLR responses [24,25]. At t = 6 h following endotoxin injection, RELA gives way to STATB1, which is known to be involved in the regulation of the differentiation of naive T cells [26]. EP300 and FOXP3 are involved in the regulation of autoimmunity [27]. Regarding the post-chirurgical and sepsis groups, significantly expressed regulators of transcription are SATB1, NFATC2, TCFL5, USF1 and EGR1 on the one hand, and SATB1, FOXP3, TAL1, NFATC2 on the other hand. It should be noted that NFATC2 was significantly expressed in post-chirurgical and sepsis groups, which is a calcium-dependent transcription factor implicated in the activation of diverse cell types of immune system [28].
Transcription regulators identified and classified with IPA according to their statistical significance at 2 h and at 6 h after endotoxin infusion, during a post-surgical SIRS and during a sepsis. P-values were adjusted using the Benjamini–Hochberg correction. A threshold value was set at 0.05.
| 2 hours after LPS infusion | 6 hours after LPS infusion | Post-chirurgical SIRS | Sepsis | ||||
| Transcription regulators | P-value | Transcription regulators | P-value | Transcription regulators | P-value | Transcription regulators | P-value |
| RELA | 9.09e–4 | SATB1 | 1.82e–2 | SATB1 | 1.43e–3 | SATB1 | 4.31e–4 |
| STAT3 | 1.59e–3 | EP300 | 2.54e–2 | NFATC2 | 1.61e–2 | FOXP3 | 1.72e–2 |
| HMGB2 | 1.17e–2 | FOXP3 | 3.09e–2 | TCFL5 | 4.19e–2 | TAL1 | 2.32e–2 |
| USF1 | 4.19e–2 | NFATC2 | 3.70e–2 | ||||
| EGR1 | 4.19e–2 |
Using Ingenuity Pathway Analysis (IPA), we identified canonical pathways involved in the inflammatory response processes. We first analyzed gene expression tables during an induced and controlled SIRS and we identified 18 canonical pathways at t = 2 h after endotoxin infusion and 15 canonical pathways at t = 6 h (Table 2). This process was repeated for both the post-chirurgical SIRS and the diagnosed sepsis gene expression tables. Thus, 19 canonical pathways have been identified for sepsis and 20 pathways for post-surgical SIRS cases (Table 3). Among all the identified pathways, nine are shared by all the conditions. Three of these are related to the regulation of apoptosis of immune cells during an inflammatory response (calcium-induced T lymphocyte apoptosis, cytotoxic T lymphocyte-mediated apoptosis, Nur77 signaling). The other six pathways (iCOS-iCOSL signaling, CD28 signaling, B Cell development, CTLA4 signaling, T Helper Cell differentiation, PCKØ signaling) are involved in the regulation of the activity and proliferation processes of immune cells. Focusing on the regulation of the inflammatory response and considering the differently expressed canonical pathways between non-pathologic and pathologic cases, two canonical pathways drew our attention: the eIF4/p70S6K regulatory pathway and the mTOR signaling pathway. Despite the fact that they are presented separately, eIF4 and p70S6K are both downstream components of mTOR signaling pathway. Particularly studied over the last decade because of his involvement in the regulation of the immune response [29–31], mTOR signaling pathway was detected at t = 6 h after LPS infusion as well as the eIF4/p70S6K canonical pathway, that was also identified for post-chirurgical SIRS subjects. Although those pathways were not identified at t = 2 h after endotoxin stimulation and namely during a prevailing acute pro-inflammatory response, the regulatory role played by the mTOR signaling pathway during a systemic inflammatory response certainly commands further investigation.
Canonical pathways identified and classified with IPA according to their statistical significance 2 h after endotoxin infusion (left) and 6 h after endotoxin enfusion (right). P-value were adjusted using the Benjamini–Hochberg correction. A threshold value was set at 0.01.
| 2 hours after LPS infusion | 6 hours after LPS infusion | ||
| Canonical pathways | BH P-value | Canonical pathways | BH P-value |
| OX40 Signaling pathway | 5.01e–7 | EIF2 Signaling | 5.15e–32 |
| Cytotoxic T lymphocyte-mediated apoptosis of target cells | 5.01e–7 | Regulation of eIF4 and p70S6K | 1.79e–9 |
| Calcium-induced T lymphocyte apoptosis | 7.62e–5 | Calcium-induced T lymphocyte apoptosis | 7.74e–7 |
| Nur77 Signaling in T lymphocytes | 8.43e–5 | mTOR Signaling | 2.52e–6 |
| CD28 Signaling in T helper cells | 4.37e–4 | iCOS-iCOSL Signaling in T helper cells | 1.31e–5 |
| PKC θ Signaling in T lymphocytes | 4.37e–4 | CD28 Signaling in T helper cells | 5.49e–4 |
| iCOS-iCOSL Signaling in T helper cells | 1.08e–3 | Role of NFAT in regulation of the immune response | 7.85e–4 |
| TREM1 Signaling | 1.72e–3 | CTLA4 Signaling in Cytotoxic T lymphocytes | 7.99e–4 |
| CCR5 Signaling in macrophages | 3.90e–3 | Nur77 Signaling in T lymphocytes | 1.13e–3 |
| Cdc42 Signaling | 4.44e–3 | Cytotoxic T lymphocyte–mediated apoptosis of target Cells | 2.07e–3 |
| T Helper cell differentiation | 4.73e–3 | T Cell receptor signaling | 2.09e–3 |
| Tumoricidal function of hepatic natural killer cells | 5.17e–3 | B Cell development | 2.85e–3 |
| Dendritic cell maturation | 6.94e–3 | Phospholipase C signaling | 3.44e–3 |
| IL-6 Signaling | 8.79e–3 | T Helper cell differentiation | 6.52e–3 |
| CTLA4 Signaling in cytotoxic T lymphocytes | 8.79e–3 | PKCθ Signaling in T lymphocytes | 8.92e–3 |
| B cell development | 8.79e–3 | ||
| iNOS signaling | 8.89e–3 | ||
| Natural killer cell signaling | 9.92e–3 |
Canonical pathways identified and classified with IPA according to their statistical significance during a post-surgical SIRS (left) and during sepsis (right). P-values were adjusted using the Benjamini–Hochberg correction. A threshold value was set at 0.01.
| Post-chirurgical SIRS | Sepsis | ||
| Canonical pathways | BH P-value | Canonical pathways | BH P-value |
| EIF2 Signaling | 7.84e–10 | Cytotoxic T lymphocyte–mediated apoptosis of target cells | 3.26e–8 |
| Calcium-induced T lymphocyte apoptosis | 2.44e–8 | Calcium-induced T lymphocyte apoptosis | 3.26e–8 |
| iCOS-iCOSL Signaling in T helper cells | 5.01e–7 | EIF2 Signaling | 2.40e–7 |
| Role of NFAT in regulation of the immune response | 3.49e–6 | Role of NFAT in regulation of the immune response | 2.54e–7 |
| OX40 Signaling pathway | 1.21e–5 | OX40 Signaling pathway | 5.57e–7 |
| Nur77 Signaling in T lymphocytes | 1.70e–5 | Nur77 Signaling in T lymphocytes | 9.30e–7 |
| Cytotoxic T lymphocyte–mediated apoptosis of target cells | 3.12e–5 | iCOS-iCOSL Signaling in T helper cells | 3.12e–6 |
| CD28 Signaling in T helper cells | 3.12e–5 | T Helper cell differentiation | 9.24e–6 |
| B Cell development | 5.47e–5 | Phospholipase C signaling | 1.29e–5 |
| CTLA4 Signaling in cytotoxic T Lymphocytes | 7.22e–5 | B Cell development | 2.01e–5 |
| Communication between innate and adaptative immune cells | 7.39e–5 | T Cell receptor signaling | 9.03e–5 |
| T Cell receptor signaling | 8.96e–5 | CTLA4 Signaling in cytotoxic T lymphocytes | 1.33e–5 |
| T Helper cell differentiation | 1.71e–4 | CD28 Signaling in T helper cells | 1.61e–4 |
| Hematopoiesis from pluripotent stem cells | 3.22e–4 | Cdc42 Signaling | 2.00e–3 |
| CCR5 Signaling in macrophages | 6.89e–4 | CCR5 Signaling in macrophages | 4.28e–4 |
| iNOS Signaling | 1.39e–3 | PKCθ Signaling in T lymphocytes | 4.80e–4 |
| Cdc42 Signaling | 1.64e–3 | Hematopoiesis from pluripotent stem cells | 1.30e–3 |
| p38 MAPK Signaling | 1.82e–3 | p38 MAPK Signaling | 4.50e–3 |
| Regulation of eIF4 and p70S6K | 3.55e–3 | Antigen presentation pathway | 4.58e–3 |
| PKCθ Signaling in T lymphocytes | 4.50e–3 |
4 Conclusion
Assuming that severe septic cases are partially caused by a loss of control in the inflammatory response, we decided to investigate and compare the physiologic mechanisms involved in the regulation of inflammation between pathological and non-pathological cases.
The dynamic analysis of an induced systemic inflammatory response led us to reach similar conclusions from what was established by Calvano et al. in their seminal work. From a transcriptomic point of view, the systemic inflammatory response goes through two stages; one is predominantly pro-inflammatory and occurs around 2 h after endotoxin infusion and the other one is predominantly anti-inflammatory and occurs around 6 h after the first contact with LPS.
Many mechanisms are common between the pathological and the non-pathological cases. There are nevertheless some differences in the processes involved in the regulation of the inflammatory response as it could be observed for the mTOR signaling pathway. The results obtained following the functional analysis are consistent with what has been recently observed in the field of inflammation and its regulation [32–34].
Although it cannot be established with certainty, owing to the limited number of patients included in Calvano's study and the disparate blood collection conditions between the two included transcriptomic databases, the detection of a different activity of the mTOR signaling pathway during the inflammation regulatory stages in non-pathological subjects in contrast to what was observed in the pathological cases could represent an interesting avenue to explore.
While encouraging, these results need to be confirmed by time series experiments including a significant number of ICU septic patients and in controlled blood collection conditions.
Disclosure of interest
The authors declare that they have no conflicts of interest concerning this article.
Acknowledgments
The authors thank the reviewers for their valuable comments and suggestions. This study has been funded by Novadiscovery SAS.