

1 Introduction
Microsatellites are a ubiquitous class of simple, repetitive DNA sequences present in both eukaryotic and prokaryotic organisms [1] The abundance, distribution throughout the genome, multiallelic nature, high reproducibility and the inherent prospect of variation and ease of assay using PCR SSRs has made these microsatellites an important source of genetic markers [2–4]. Over 2500 microsatellite markers have been genetically mapped in rice, and each of about 157 kb [5–11]. These SSR markers belong to Class I (di-, tri-, tetra-repeats), which were released after the completion of the Nipponbare genome sequence in 2005 [12]. The hypervariability of SSRs among related organisms and simple, reproducible assay makes them worthy for a wide range of applications, such as genotype identification, mapping of genes and quantitative trait loci, genetic diversity analysis and marker-assisted selection (MAS) [13,14]. SSRs have been widely used in cereal research, and the use of these sequences in MAS has increased the speed and efficiency of germplasm and disease improvement in rice [4].
Rice blast caused by the Magnaporthe oryzae is the most devastating disease of rice in nearly all rice growing areas of the world [15–17], including Malaysia. Several microsatellite markers with publicly available databases (http://www.gramene.org) closely linked to the blast resistance genes in rice have also been identified [18–24]. To date, over 100 blast resistance genes (Pi gene) on the rice genome have been mapped [25,26], and the SSR markers linked to the Pi gene are useful for selection of resistance genes in rice germplasm [4,23]. Therefore, to develop rice cultivars with durable blast resistance and characterisation of resistance genes in local cultivars, the information generated about these markers is very important.
SSRs have the advantage of being based on simple PCR assays and multiple SSR alleles may be detected at a single locus using a simple polymerase chain reaction (PCR) [27]. To increase the information per SSR assay, multiplex SSR–PCR approaches have been developed and combined with fluorescence-based DNA detection and semi-automated fragment analysis [28–32]. Multiplexing involves the simultaneous amplification of several loci in a single PCR reaction and the subsequent analysis of multiple molecular markers in a single gel lane. It may increases the information about each PCR reaction and also lowers the cost barriers for the large-scale use of SSRs as genetic markers. SSRs are easily detected via automated systems and capillary electrophoresis. The use of capillary electrophoresis with fluorescently labelled primers provides high detection sensitivity of amplified DNA fragments [33–35]. This procedure is an effective, economical and accurate approach for genotyping, germplasm evaluation and enhances the visualisation of polymorphic DNA fragments, representing multiple loci from across the genome [36–38].
Nowadays, this method has been developed and used for several plant species, such as Oryza sativa [39–41]. Helianthus annuus [42], Arabidopsis thaliana [43], Brassica napus [44,45], Zea mays [46], Glycine max [47,48], Gossypium hirsutum [49,50], Lycopersicon esculentum [51], and Phaseolus vulgaris [52]. An advantage of fluorescence-based SSR genotyping or the automated fluorescent detection of microsatellites is that several SSRs can be simultaneously separated in a single capillary tube or gel lane, providing that the SSR fragments have non-overlapping sizes.
Two approaches are commonly used for multiplex SSR genotyping, i.e. post-PCR multiplexing and PCR multiplexing. Post-PCR multiplexing (also called multi-pooling) involves the pooling of individual PCR assays for two or more SSRs prior to electrophoresis [53]. PCR multiplexing involves the simultaneous amplification of two or more SSRs in a single PCR reaction [54], and this approach is typically used to repetitively genotype a small number of markers. Thus, several microsatellites can be pooled post-amplification or amplified together in a common PCR reaction [45]. In multiplex panels, the markers labelled with the same fluorophore dye must be of different sizes, while the markers that overlap in size must be distinguished using different fluorescent dyes with different emission wavelengths to label the individual markers [36]. The combined use of these approaches can be used to achieve highly parallel SSR genotyping through the flexible fluorescence labelling of SSRs [42,43].
In the present study, multiplex PCR and automated fluorescence-based SSR detection methods were used for genotyping rice plants. The aim of the present study was to evaluate the multiplex SSR–PCR approach using a 5′ dye-labelled marker set for the genotypic analysis of a rice F3 population derived from crosses of Malaysian local rice varieties. The linkage maps using sixty-three polymorphic SSR markers linked to rice blast disease resistance genes was constructed. The segregation distortion of SSR markers was analysed and the distorted loci were localised on linkage map. In this research, we developed a new multiplex SSR panel to determine the progeny genotypes and the range of alleles in segregating F3 populations of rice. In addition, various parameters of multiplex PCR, to determine optimal conditions, were examined, and the technical aspects of the application were also described. Panels of microsatellites for multiplex fluorescent detection would be useful for studies of cultivar diversity, high-throughput genotyping, and to evaluate the potential of this technique for fingerprinting and clustering of genotypes in this important crop species.
2 Materials and methods
2.1 Plant materials
Approximately 188 F3 progenies obtained from a self-pollinated F2 population (derived from crosses between the Pongsu Seribu 2 and Mahsuri) were used for genetic analysis and to evaluate allelic variation. The F3 plants were cultivated in a greenhouse in the Malaysian Agricultural Research and Development Institute (MARDI), Seberang Perai. The SSR marker panels were tested in parental varieties and entire F3 families.
2.2 DNA extraction
Total genomic DNA was extracted from the leaves of selected rice families, according to the methods of Gawel and Jarret [55]. Approximately 2 cm of young leaf tissue was harvested from 4-week-old seedlings. After grinding to a fine powder in liquid nitrogen, the samples were transferred to 1.5 mL centrifuge Eppendorf tubes and mixed with 600 μL of pre-heated extraction buffer [2% CTAB, 1.4 M NaCl, 20 mM EDTA (pH 8.0), 0.1 M Tris–Hcl (pH 8.0), 1% polyvinylpyrrolidone and 0.6 μL 2-merceptoethanol]. The tubes were subsequently incubated at 60 °C in an Eppendorf thermo-mixer comfort machine for 60 min with occasional swirling. The mixture was emulsified with an equal volume of chloroform:isoamyl alcohol 24:1 (v/v) and gently inverted to homogenise the mixture at room temperature for 2 min prior to centrifugation at 12,000 rpm for 5 min. The supernatant was collected into fresh Eppendorf tubes, and the DNA was precipitated with 0.6 volumes of cold (–20 °C) isopropanol. The mixture was gently inverted and incubated on ice for 30 min, and the supernatant was discarded and transferred to a new microcentrifuge tube and centrifuged at 12,000 rpm for 2 min. Subsequently, 50 μL of 70% ethanol was added to the DNA pellet, followed by centrifugation at 12,000 rpm. The supernatant was gently removed, and the dried DNA pellet (30 min) was resuspended in 50–100 μL of 1× TE buffer (10 mM Tris–HCl, pH 8.0 and 1 mM EDTA, pH 8.0) according to the size of the pellet and stored overnight at 4 °C to dissolve the DNA. The DNA was re-precipitated with 1/10 V 3 M sodium acetate (pH 6.8), followed by 2 volumes of absolute ethanol. The mixture was gently inverted and incubated on ice for 30 min, followed by centrifugation at 13,000 rpm for 5 min. Subsequently, the supernatant was discarded, and the pellet was washed with 70% ethanol, air-dried and resuspended in 1× TE buffer. Approximately, 2 μL (10 g/mL) of RNAse was added to the dissolved DNA from each sample and incubated for 30 min at 37 °C. The DNA concentration was spectrophotometrically determined using NanoDrop-ND-1000 Spectrophotometer (NanoDrop-Technologies, USA). The quality of the DNA was determined using 1% agarose gel electrophoresis, followed by staining with 0.1 μg/mL ethidium bromide using 1× TAE buffer at a constant 72 V for 30 min and visualised under UV light. The DNA samples were diluted to 20 ng/μL and stored at –20 °C until further PCR analysis.
2.3 PCR primers for SSRs
Primer sets for 125 microsatellites, related to previously mapped and published blast resistance gene (Pi-Genes) [5,6,9,11], were selected from the Gramene database (www.gramene.org). Parental varieties were used to identify SSR polymorphisms. The genetic polymorphisms were assessed according to the separation of PCR products using 3% agarose gel electrophoresis or the analysis of fluorochrome-labelled PCR products through automated capillary electrophoresis (genetic analyser). Polymorphic markers were used to develop SSR multiplex sets. Thirteen multiplex panels were designed for genotyping and evaluating the F3 germplasm (Table 1). The forward primers for SSR loci were fluorescently labelled with either 6-carboxyfluorescein (FAM) or hexachloro-6-carboxyfluorescein (HEX) dye from the G5 set (Applied Biosystems) and used for marker amplification in a different panel. Some markers were individually amplified because of the different PCR profiles required by markers in a panel. After amplification, the concentration of the amplicons was determined on 2% agarose gels stained with ethidium bromide.
Microsatellite marker panel used for multiplex PCR assay.
| Panel | Locus name | Chromosome No. | Dye/fluorescent label | Size range (bp) | Annealing temperature | Repeat motif |
| 1 | RM1 | 1 | FAM | 113 | 54 | (GA)26 |
| RM104 | 1 | FAM | 222 | 54 | (GA)9 | |
| RM1233 | 11 | FAM | 175 | 54 | (AG)15 | |
| RM272 | 1 | HEX | 119 | 54 | (GA)9 | |
| 2 | RM462 | 1 | FAM | 243 | 55 | (GA)12 |
| RM6293 | 11 | FAM | 198 | 55 | (CTT)8 | |
| RM148 | 3 | HEX | 129 | 55 | (TG)12 | |
| RM495 | 1 | HEX | 159 | 55 | (CTG)7 | |
| 3 | RM340 | 6 | FAM | 63 | 57 | (CTT)8T3(CTT)14 |
| RM228 | 10 | FAM | 154 | 57 | (CA)6-(GA)36 | |
| RM564-C | 6 | HEX | 228 | 57 | (GT)14 | |
| RM16 | 3 | HEX | 181 | 57 | (TCG)5(GA)16 | |
| RM557 | 6 | FAM | 211 | 55 | (AC)13 | |
| 4 | RM224 | 11 | FAM | 157 | 57 | (AAG)8(AG)13 |
| RM229 | 11 | HEX | 116 | 57 | (TC)11(CT)5C3(CT)5 | |
| RM441 | 11 | HEX | 189 | 57 | (AG)13 | |
| RM8226 | 6 | HEX | 251 | 57 | (AAG)14 | |
| RM5961 | 11 | FAM | 129 | 57 | (CAG)8 | |
| RM166 | 2 | FAM | 321 | 57 | (T)12 | |
| 5 | RM287 | 11 | FAM | 118 | 55 | (GA)21 |
| RM168 | 3 | HEX | 116 | 54 | T15(GT)14 | |
| RM169 | 5 | HEX | 167 | 55 | (GA)12 | |
| RM38 | 8 | FAM | 250 | 55 | (GA)16 | |
| RM120 | 8 | FAM | 173 | 55 | (GA)9TAG(ATC)4 | |
| 6 | RM8225 | 6 | HEXa | 221 | 57 | A11N(AAG)14 |
| RM153 | 5 | FAMb | 201 | 57 | (GAA)9 | |
| RM244 | 10 | FAM | 163 | 57 | (CT)4(CG)3C(CT)6 | |
| RM543 | 1 | FAM | 98 | 54 | (GCG)10 | |
| RM13 | 5 | HEX | 141 | 57 | (GA)6-(GA)16 | |
| 7 | RM6836 | 6 | FAM | 240 | 57 | (TCT)14 |
| RM413 | 5 | FAM | 79 | 55 | (AG)11 | |
| RM8 | 2 | HEX | 252 | 57 | (GA)14C(GA)2 | |
| RM136 | 6 | HEX | 101 | 57 | (AGG)7 | |
| RM247 | 12 | FAM | 131 | 57 | (CT)16 | |
| RM304 | 10 | HEX | 160 | 55 | (GT)2(AT)10(GT)33 | |
| 8 | RM428 | 1 | HEX | 266 | 57 | (AG)15 |
| RM527 | 6 | FAM | 233 | 57 | (GA)17 | |
| RM21 | 11 | HEX | 157 | 57 | (GA)18 | |
| RM332 | 11 | FAM | 183 | 57 | (CTT)5-12-(CTT)14 | |
| 9 | RM512 | 12 | FAM | 214 | 57 | (TTTA)5 |
| RM25 | 8 | FAM | 146 | 57 | (GA)18 | |
| RM44 | 8 | FAM | 99 | 57 | (GA)16 | |
| RM263 | 2 | HEX | 199 | 57 | (CT)34 | |
| RM106 | 2 | FAM | 297 | 57 | (GAA)5 | |
| RM206 | 11 | HEX | 147 | 57 | (CT)21 | |
| 10 | RM177 | 4 | FAM | 195 | 57 | (AG)8 |
| RM482 | 2 | HEX | 188 | 55 | (AT)9 | |
| RM101 | 12 | FAM | 324 | 55 | (CT)37 | |
| RM250 | 2 | FAM | 153 | 57 | (CT)17 | |
| RM312 | 1 | FAM | 97 | 55 | (ATTT)4(GT)9 | |
| 11 | RM72 | 8 | FAM | 166 | 57 | (TAT)5C(ATT)15 |
| RM465 | 12 | FAM | 212 | 57 | (CAT)12 | |
| RM208 | 2 | HEX | 173 | 57 | (CT)17 | |
| RM498 | 2 | HEX | 213 | 57 | (CA)10 | |
| 12 | RM179 | 12 | FAM | 190 | 57 | (TG)7 |
| RM213 | 2 | HEX | 139 | 57 | (CT)17 | |
| RM350 | 8 | HEX | 208 | 57 | (CT)10 | |
| RM331 | 8 | FAM | 176 | 57 | [(CTT)4GTT]2(CTT)11 | |
| RM142 | 4 | FAM | 240 | 55 | (CGG)7 | |
| 13 | RM451 | 4 | FAM | 207 | 55 | (GAT)8 |
| RM511 | 12 | FAM | 130 | 55 | (GAC)7 | |
| RM1359 | 4 | HEX | 170 | 55 | (AG)25 | |
| RM185 | 4 | HEX | 197 | 55 | (AGG)9 |
a Hex: hexachloro-6-carboxyfluorescein.
b FAM: 6-carboxyfluorescein.
2.4 Primer annealing optimisation
Length of time and temperature required for primer annealing were optimised using PTC-200 DNA Engine Peltier Thermal Cycler at seven different temperatures (43, 45, 48, 51, 55, 57 and 60 °C). The PCR samples were mixed with bromophenol blue, loaded onto 3% agarose gels (Pharmacia model EPS-200) containing ethidium bromide and run at 5.3 V/cm (Bio-Rad Power Pac 300) for 1 h. The gels were photographed using a gel documentation system (Bio-Rad Molecular Imager Gel Doc XR System).
2.5 Optimisation of reaction components
Factors that alter PCR amplification, such as template DNA, dNTPs, DNA polymerase, Mg2+ concentration, etc., were optimised. Two types of PCR assays were performed: uniplex (simplex) and multiplex PCR. For uniplex PCR, the PCR reactions contained 20 ng genomic DNA, 1.5 mM MgCl2, 0.2 μM of each 3′- and 5′-end primer, 25 mM of dNTPs (0.25 mM each of dATP, dTTP, dGTP and dCTP), 1× PCR reaction buffer and 0.5 units of Taq DNA polymerase in a total volume of 12.5 μL. The uniplex PCR amplification was performed on a thermocycler (PTC-200 Peltier Thermal Cycler DNA Engine) using the following temperature profile: initial denaturation at 94 °C for 5 min, followed by 35 cycles at 94 °C for 30 s, 55 °C for 30 s, and 72 °C for 30 s, with a final extension at 72 °C for 5 min and rapid cooling to 4 °C prior to analysis. For multiplex PCR, the reaction mixture (10 μL) contained 10 ng of template DNA, 0.5 U AmpliTaq Gold DNA Polymerase (Applied Biosystems), 800 μM dNTPs, 2 mM MgCl2 and 0.1 to 0.3 μM each of forward and reverse primers. The multiplex PCR amplifications were performed in 96-well microtitre plates using a Gene Amp PCR 9700 system (Applied Biosystems). The following PCR profile was used: 94 °C for 5 min, followed by 35 cycles of 94 °C for 30 s, 54 °C, 55 °C or 57 °C (three different annealing temperatures) for 30 s, and 72 °C for 30 s, with a final extension at 72 °C for 5 min. Three different cycling conditions were initially tested, and the most effective condition (programme C) was used for multiplex PCR.
2.6 Pooling of PCR products: preparing and running the samples in the genetic analyser (sequencer)
The PCR products were pooled by combining 1.0 μL of each amplified product and adding water, when necessary, to bring the products to a uniform dilution of 1:12. The samples were prepared for gel loading by combining 1 μL of the pooled PCR products with 0.13 μL of LIZ-500 internal size standard and adjusted to a final volume of 10 μL with formamide (98% formamide, 10 mM EDTA, blue dextran). The samples were placed in a 96-well microplate, after denaturing at 95 °C for 5 min, and immediately cooled to 4 °C. Electrophoresis was performed using a capillary electrophoresis instrument (3100 Genetic Analyzer, ABI). The samples were run on a POP4 polymer matrix using the GeneScan 36 POP4 Default Module, with run conditions of 60 °C, 15 kV, and 25 min.
2.7 SSR genotyping (fragment size determination) and marker analysis
The genotyping assays were performed on a capillary-based ABI PRISM 3100 genetic analyser (Applied Biosystems) according to the manufacturer's instructions. Fluorescent DNA fragments for each individual were scored using Gene Mapper version 4.0, and the allele size and peak-area of the true peaks was determined using Genotyper version 3.7. The software provided an allele size (fragment length) and a chromatograph for each individual. The chromatograph showed the peak height and position of each individual. Individuals with peak heights and positions similar to Pongsu Seribu 2 (male parent) were designated as A, and those similar to Mahsuri (female parent) were designated as B. Individuals with peak heights and positions similar to both parents were designated as AB or H.
2.8 Detection of segregation distortion for SSR markers
The marker data generated for 188 lines using 63 SSR primers were subjected to χ2 analysis. The Chi2 analysis of the genotypic data was calculated using the formula, χ2 = (O – E)2/E, where O is the observed value and E is the expected value. The observed ratios were tested for deviation from the expected values using a Chi2 goodness-of-fit test (P < 0.05) for each marker. The expected genotypic ratio (AA:AB:BB) ratio for individuals in each genotypic class was 1:2:1 in the F3 population. Individuals with a missing genotype at a locus were excluded from the analysis for that locus. In addition, the presence of a segregation distortion region (SDR) was identified when closely linked markers exhibited significant segregation distortion in the F3 population.
2.9 Molecular linkage map construction
An SSR linkage map for the sixty-three polymorphic loci was constructed using QTL IciMapping [56]. The markers revealed significant segregation distortion in the F3 population as shown on the map. The most skewed markers in an SDR were considered the most likely location of a distorting factor.
3 Results
3.1 Optimisation of the primer annealing temperature
Determining the optimal annealing temperature is a prerequisite for primer pairs of microsatellite loci. Once the annealing conditions have been optimised, it will be easier to study DNA polymorphisms for genome analysis. Thermal cyclers that generate a uniform temperature gradient across the heating block greatly simplify the determination of the optimal annealing temperature. The applicable annealing temperature in PCR is 5 °C below the actual melting temperature [Tm = 4(G + C) + 2(A + T)] of the particular primers. A single-base mismatch lowers the Tm ∼ 5 °C. The temperature and duration of primer annealing rely on the base composition and length of the primers. Although more complex formulas could also be used [57,58], in practice the Tm is variously affected by the individual buffer components and even the primer and template concentrations, therefore any calculated Tm value should be regarded as an approximation. In the present study, 7 different temperatures (43, 45, 48, 51, 55, 57, and 60 °C) were investigated for primer pair annealing using a PTC-200 DNA Engine Peltier Thermal Cycler. Gradient PCR facilitates the empirical determination of an optimal annealing heat range in a minimum number of steps. Using the gradient function of the universal block, a gradient of 43 to 60 °C was set. We also examined a number of possible concentration parameters during the same run. The results revealed that annealing temperatures ranging from 48 to 57 °C typically generate the best outcomes, and at distinct primer concentrations, annealing requires only a few seconds. Fig. 1 shows an agarose gel with the 7 samples loaded across the block. The majority of the microsatellites marker in the designated panels generated single bands at 55 °C and 57 °C (Fig. 2) and were selected as best primers based on clear DNA amplification products. Notably, 10 microsatellites produced double or multiple banding patterns, suggesting that some primers are refractory to optimisation [59]. Increasing the quantity of cycles might result in anaemic PCR reactions, but this specific modification might generate false bands and smears from high molecular weight products containing more single-stranded DNA [60].
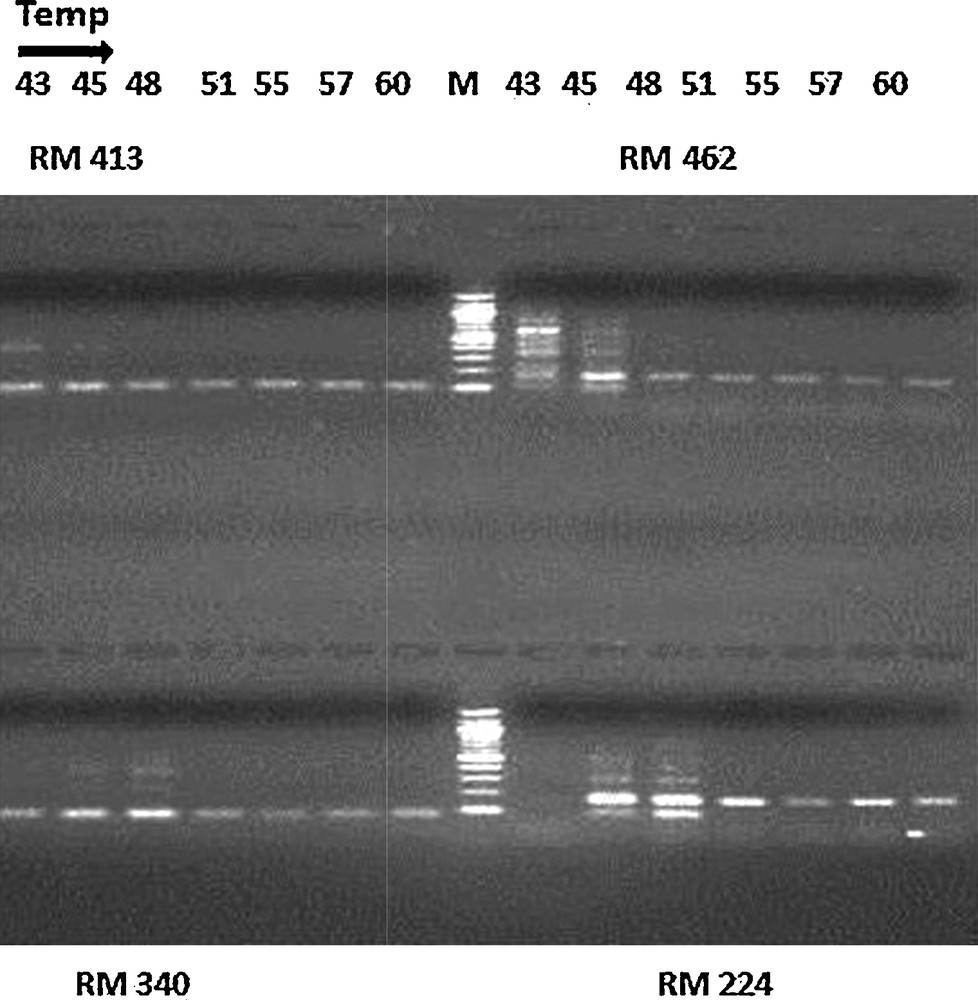
Optimization of the annealing temperature for markers RM 413, RM 462, RM340 and RM 224 at seven different temperatures (43, 45, 48, 51, 55, 57 and 60 °C). The PCR samples were mixed with bromophenol blue, loaded onto 3% agarose gels (Pharmacia model EPS-200) containing ethidium bromide and run at 5.3 V/cm (Bio-Rad Power Pac 300) for 1 h. The gels were photographed using a gel documentation system (Bio-Rad Molecular Imager Gel Doc XR System).
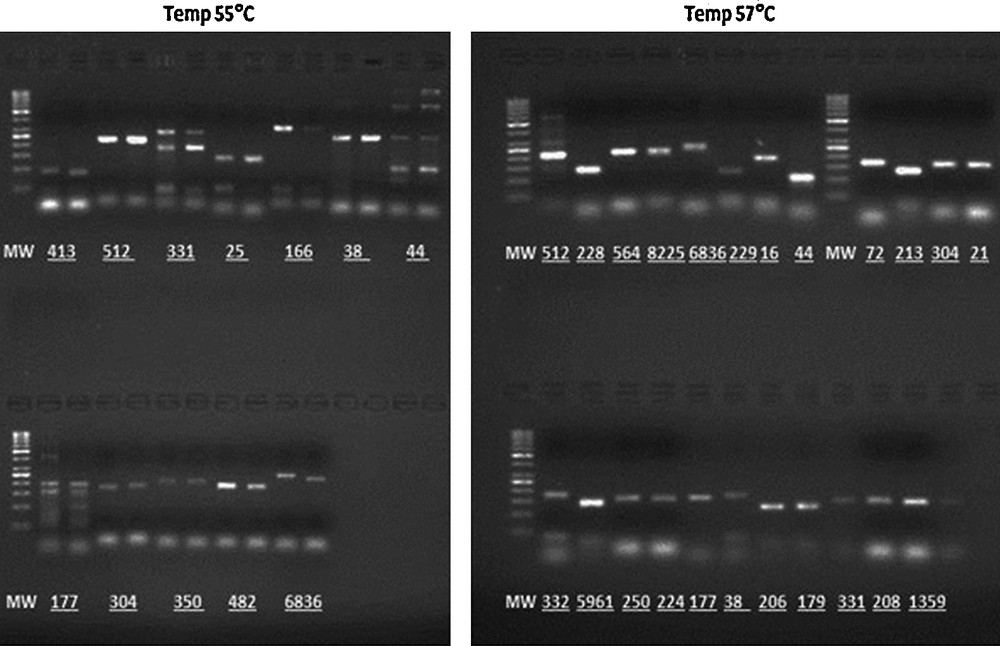
Experimental determination of the optimal annealing temperature for SSR markers at two different temperatures, 55 and 57 °C, on 2% agarose gels containing ethidium bromide run at 5.3 V/cm for 1 h.
3.2 To optimise the SSR–PCR conditions
In the present study, to optimise the multiplex sets, different concentrations of MgCl2, Taq DNA polymerase, DNA and PCR conditions were optimised for basic simplex PCR and multiplex SSR–PCR. We observed that the following PCR component concentrations were optimal for most microsatellite analyses: 1× PCR buffer, 25 mM dNTPs, 5 μM of each primer, 5 U/μL Taq polymerase, 2 mM MgCl2 and ∼ 20 ng template DNA (Table 2). For all the markers examined, the PCR conditions were uniform, except annealing temperature. The results showed that all reagents in the PCR mix influenced the outcome of SSR loci amplification. In this context, the amount and quality of template DNA strongly influenced the PCR results. The template volume cannot be too high; otherwise, non-specific PCR products might be obtained. Previous studies have also shown that, in practice, SSR–PCR fails for various reasons, reflecting many factors that could alter PCR amplification, such as different types/brands of thermocyclers, reaction components (template DNA, dNTPs, DNA polymerase, Mg2+ concentration, etc.), or even minor differences in the thickness of the walls of the PCR tubes [61]. The concentrations of template DNA range from 50–100 ng per 25 μL reaction volumes [62]. The MgCl2 concentration can have an enormous influence on the success of the PCR reaction. Increasing the Mg2+ ions enhances Taq activity to an optimum, above which these ions might act as inhibitors of Taq activity [63]. The concentration of MgCl2 ranges from 1.0–2.5 mM. As substrates of the PCR reaction, dNTP content directly affects the output of PCR amplification. An excess of dNTPs will compete with polymerase binding to Mg2+ and thereby inhibit the PCR reaction. The dNTP concentrations range from 0.1 to 0.5 mM [62]. The amount of Taq DNA polymerase affects the amplification efficiency, and when used in excess, this enzyme will generate a high mismatch rate, while, the low amount of Taq will affect the efficiency of enzyme and primer binding [62,64]. The Taq DNA polymerase concentration ranges from 0.5 to 1.0 unit per 25 μL reaction volumes [65]. Although the primer concentration is not as important for the PCR reaction as other parameters, the optimisation of this component is economically important to avoid unnecessary waste. Variable concentrations of forward and reverse primers of different markers have been reported [61,66,67]. In general, the primer concentration ranges from 0.1 to 0.5 μM [65]. Varying the concentration of primers for one locus might affect amplification at the other loci in the multiplex. Differences in the DNA sequences of the loci could also lead to variations in the efficiency of primer binding. Therefore, it is essential to optimise the primer concentrations to obtain not only the best signal intensities, but also balanced peak heights for a multiplex set. Therefore, the results suggest that the concentrations of all PCR components must be optimal for successful amplification.
Components of PCR amplification.
| Uniplex PCR | Multiplex PCR | ||||
| Uniplex master mix | Final conc. in PCR | Volume (μL) | Multiplex master mix | Final conc. in PCR | Volume |
| ddH2O | – | 7.775 | ddH2O | – | 2 μL |
| 10 × PCR buffer | 1 × | 1.25 | 10 × PCR buffer | 1 × | 2.5 μL |
| MgCl2 (25 mM) | 1.5 mM | 0.75 | MgCl2 (25 mM) | 2 mM | 1.5 μL |
| 1.25 μL | |||||
| 100 mM DNTP mix (25 mM of each dNTP) | 0.25 mM each | 0.625 | dNTP (25 mM of each dNTP) | 800 μM | 0.4 L |
| 5 μM primer (F) | 0.2 μM | 0.5 | 5 μM primer (F) | 0.1–0.3 μM | 0.1–0.3 μL |
| 5 μM primer (R) | 0.2 μM | 0.5 | 5 μM primer (R) | 0.1–0.3 μM | 0.1–0.3 μL |
| 5 U/μLTaq | 0.5 U/μL | 0.1 | 5 U/μLAmpliTaq Gold | 0.5 U/μL | 0.2–0.5 μL |
| DNA template (ng/μL) | 20 ng/μL | 1 | DNA (ng/μL) | 10 ng/μL | 2 μL |
| Total | 12.5 | 10 μL |
3.3 Multiplex PCR programmes
To amplify the targeted amplicons using multiplex PCR, the extensive optimisation of the cycling conditions is typically required. In the present study, the PCR cycling programme was successfully optimised for the amplification of the selected SSRs (Table 3). The latest programme had a higher extension temperature (72 °C) and three different annealing temperatures with longer extension times. The results suggested that the higher extension temperature decreased amplification. With programmes A and B, some PCR products were missing. Because we anticipated that an entire plate of PCR samples would be amplified for a given marker at one temperature, some samples were not amplified at one latter time with programme C, which should not decrease the overall efficiency of the protocol. However, changes in the annealing temperature increased or decreased the specificity and yield of the PCR products. Fig. 3 shows the results of multiplex PCR reactions using different primers sets from panel 7 with programme C. A thermal cycler with a lower capacity block might be used for fewer samples. Notably, primer integrity is a critical factor for successful SSR–PCR. The problems encountered in SSR–PCR typically reflect the use of incorrect primer concentrations, low-quality primers, or degraded primers (old primer solutions and multiple freeze-thawing cycles). Moreover, the primer extension time is determined based on the length and concentration of the target sequence and temperature applied. In the present study, a two-minute extension time at 72 °C was adequate to yield products of approximately 2 kb in length. These results suggest that, although the cycling conditions might vary depending upon the locus tested and the polymerase used, longer annealing times and higher and therefore more stringent annealing temperatures dramatically improve the efficiency of microsatellite loci amplification. Variations among PCR products might reflect a number of factors, such as well-to-well variation across the thermal cycler, pipetting errors, and inconsistent quality among template DNA samples. These factors might contribute to variations in the efficiency of PCR amplification, exhibited as differences in the peak height among electropherograms.
PCR cycling conditions.
| Step | Program A | Program B | Program Ca |
| First denaturing | 94 °C, 5 min | 94 °C, 10 min | 94 °C, 5 min |
| Denaturing | 94 °C, 30 s | 94 °C, 1 min | 94 °C, 1 min |
| Anneal | 55 °C, 30 s | 57 °C, 30 s | 54 °C, 55 °C, 57 °C, 1 min |
| Extend (elongation) | 65 °C, 30 s | 70 °C, 1 min | 72 °C, 2 min |
| Number of cycles | 40 | 35 | 30 |
| Final extension (final elongation) | 72 °C, 5 min | 72 °C, 10 min | 72 °C, 7 min |
| Storage | 4 °C until use | 4 °C until use | 4 °C until use |
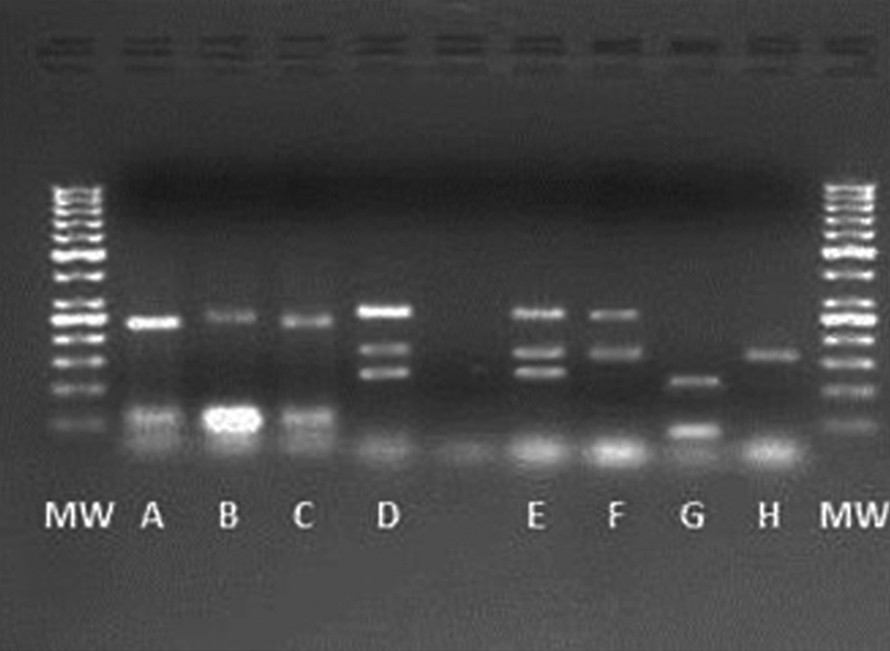
Agarose gel electrophoresis of multiplex PCR products for primers sets of panel 7 under programme C (See in Table 3). Lane MW, 50-bp DNA ladder marker; lane A = RM413, RM6836; lane B = RM413, RM8; lane C = RM413, RM6836; lanes D, E = RM247, RM304, RM8; lane F = RM304, RM8; lane G = RM413, RM136; and lane H = RM304.
3.4 Genotyping and allele scoring using fluorescent-labelled microsatellites
All SSR loci surveyed on the population were unambiguous and easily scorable. The genotype (sizes of the PCR products) of each sample, based on the pattern of peaks or bands on the electropherogram, was determined for 13 established SSR panels. The genotypic data was obtained from the analysis using GeneMapper version 4.0. The software calls the peaks observed within each sample into bins, consistent with individual previously designated alleles. The software generates an allele size (fragment length) and chromatograph for each microsatellite. The individual microsatellites have a typical fragment pattern with a characteristic number of stutter peaks and an easily distinguished signal peak width, slope and spread. A few stutter peaks on the ABI were observed, and because only the most intense fragments were evaluated for molecular weight, the stuttering did not interfere with allele calling. The individual allele sizes were compared with allele sizes of the parents for a specific marker. Allele binning was performed after rounding off the assigned values to the nearest whole base pair integer to generate a base pair estimate for a given allele. The allele sizes among the F3 lines showed the allele sizes of parental varieties. The parental varieties in the germplasm are considered as standard genotypes for evaluating allelic diversity and have been previously analysed for all 63 polymorphic microsatellites. Multiple alleles were not frequently observed in the germplasm, and these individuals were genotyped based on DNA samples extracted from single plants. Rice is a self-pollinating diploid crop; thus, microsatellite markers typically reveal single-copy, homozygous loci, and allelic heterogeneity are rare in pure line varieties. This fact simplified the microsatellite work for the analysis of rice varieties. A plant was assigned a null allele for an SSR locus when an amplification product was not generated. For loci with di-nucleotide motifs, the binning process occasionally generated intermediate values for the assigned alleles. A correction was performed to ensure that all values followed the expected sizes for di-nucleotide motif loci, as no previous knowledge concerning microvariants for the selected loci was available. In this case, the most frequent allele was considered as a reference for the expected values. Rice is a naturally inbred crop, therefore multiple alleles in a variety typically indicate mixed pure lines or seed mixtures (heterogeneity), rather than genetic heterozygosity, and this phenomenon is particularly common in landrace varieties [68]. Figs. 4 and 5 show the peak height and the fluorescence intensity of the 500 LIZ size standard (Applied Biosystems) and plant genotyping using the RM104 and RM495 microsatellites from panels 1 and 2, respectively, in the F3 families. The size standard was effective for estimating the molecular weights of all the PCR products amplified across the multiplex panels, ranging from 73 to 277 bp in length. The peak heights were consistent with those from PCR products with FAM/HEX-labelled primers. The germplasm set examined in the present study was adequate for microsatellite analysis. The results suggested that a useful set of markers should also provide whole genome coverage, with even distribution on each chromosome and high potentiality for multiplexing.
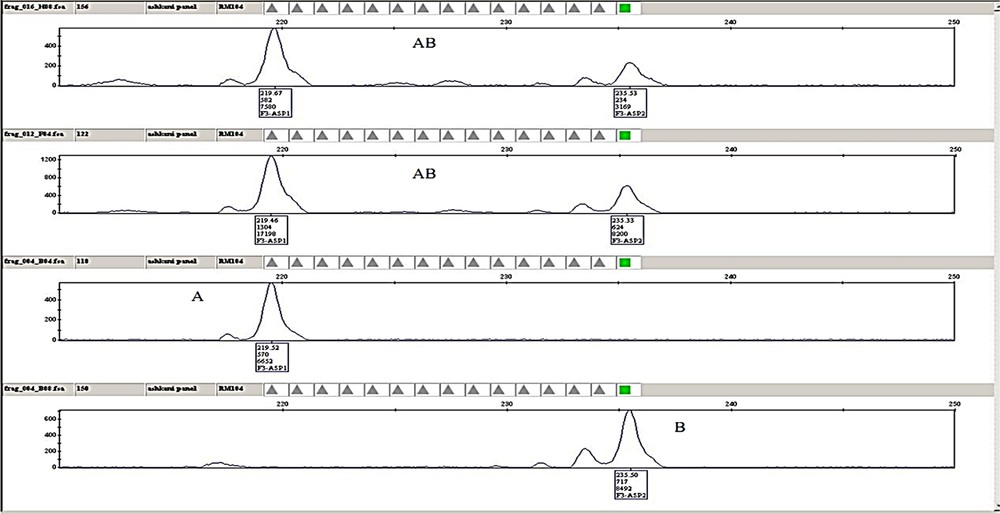
(Colour online.) Example of plant genotyping and chromatographic analysis for the RM104 marker, labelled with 6-carboxyfluorescein (FAM) dye from the G5 set (Applied Biosystems) with an expected size of 222 (bp) from panel 1 in four samples of F3 families. The chromatograph indicates the peak height and position of the individuals for a given marker. A. The individuals with allele sizes (fragment lengths) similar to Pongsu Seribu 2. B. Individuals with allele sizes (fragment lengths) of Mahsuri. AB. Individuals with allele sizes similar to those of both parents. Masquer
(Colour online.) Example of plant genotyping and chromatographic analysis for the RM104 marker, labelled with 6-carboxyfluorescein (FAM) dye from the G5 set (Applied Biosystems) with an expected size of 222 (bp) from panel 1 in four samples of F3 families. ... Lire la suite
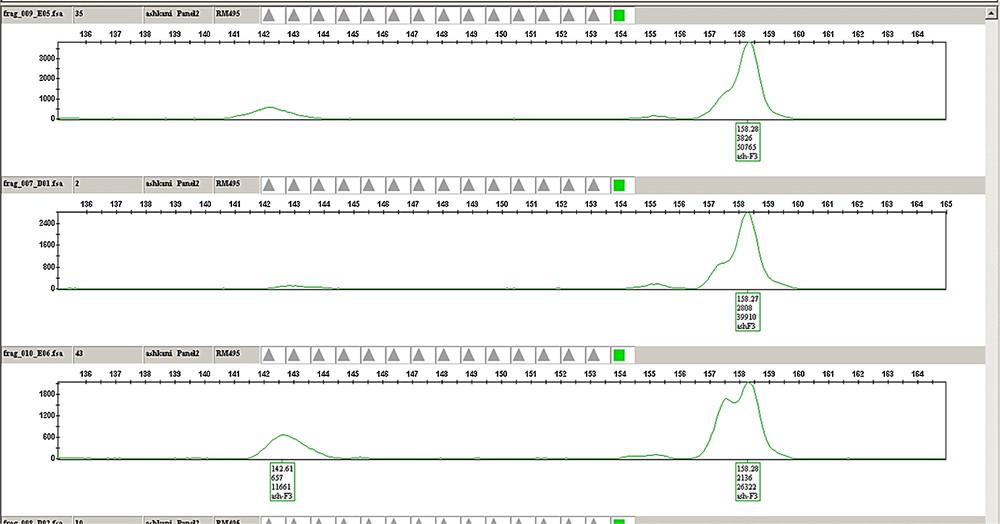
(Colour online.) Example of the plant genotyping and chromatographic analysis for the RM495 marker, labelled with hexachloro-6-carboxyfluorescein (HEX) dye from the G5 set (Applied Biosystems), with an expected size of 159 (bp) from panel 2 in three samples of F3 families. The chromatograph indicates the peak height and position of the individuals for a given marker. A. Individuals with allele sizes (fragment lengths) similar to Pongsu Seribu 2. B. Individuals with allele sizes (fragment lengths) of Mahsuri. AB. Individuals with allele sizes similar to both parents. Masquer
(Colour online.) Example of the plant genotyping and chromatographic analysis for the RM495 marker, labelled with hexachloro-6-carboxyfluorescein (HEX) dye from the G5 set (Applied Biosystems), with an expected size of 159 (bp) from panel 2 in three samples of F3 ... Lire la suite
3.5 Analysis of SSR markers segregation
Marker segregation distortion was detected for deviating from the expected Mendelian ratio (1:2:1) of each locus in the F3 population using the Chi2 (χ2) test. In the population studied, among the 41 (65%) markers that deviated from Mendelian segregation (at the 0.05 and 0.01 level of significance), 12 markers (30%) exhibited segregation distortion towards the female parent Mahsuri, whereas 24 markers (58%) deviated towards the male parent, Pongsu Seribu 2. In addition, 5 markers (12%) were distorted towards heterozygote individuals. The marker loci associated with skewed allele frequencies were distributed on all eight chromosomes. These results indicated that genetic factors for segregation distortion present on these chromosomes. A total of 22 (35%) SSR markers fit the expected segregation ratio of 1:2:1 based on a χ2 test at 0.05 percent probability. Segregation distortions for 63 polymorphic loci are shown in Table 4.
Chi2 (χ2) test for the segregation distortion of SSR markers.
| Marker Name | Chromosome | Genotype in the F3 population | Chi2 (χ2) |
Direction of skewing | ||
| AA | H | BB | ||||
| RM462 | 1 | 52 | 79 | 57 | 5.05 | H |
| RM495 | 1 | 62 | 70 | 56 | 12.64** | PS2 |
| RM428 | 1 | 81 | 50 | 57 | 47.32** | PS2 |
| RM11 | 1 | 92 | 47 | 44 | 68.46** | PS2 |
| RM272 | 1 | 54 | 86 | 48 | 1.74 | H |
| RM312 | 1 | 45 | 80 | 58 | 4.74 | Mh |
| RM543 | 1 | 95 | 52 | 36 | 72.15** | PS2 |
| RM104 | 1 | 51 | 79 | 58 | 5.31 | H |
| RM106 | 2 | 82 | 54 | 46 | 44.33** | PS2 |
| RM263 | 2 | 90 | 50 | 48 | 59.96** | PS2 |
| RM8 | 2 | 80 | 72 | 36 | 30.89** | PS2 |
| RM250 | 2 | 88 | 54 | 40 | 55.41** | PS2 |
| RM166 | 2 | 92 | 45 | 45 | 70.78** | PS2 |
| RM208 | 2 | 43 | 87 | 58 | 3.44 | H |
| RM213 | 2 | 86 | 53 | 42 | 52.47** | PS2 |
| RM482 | 2 | 98 | 40 | 43 | 89.78** | PS2 |
| RM498 | 2 | 50 | 76 | 62 | 8.43* | Mh |
| RM16 | 3 | 92 | 54 | 35 | 65.34** | H |
| RM148 | 3 | 92 | 36 | 54 | 82.35** | PS2 |
| RM168 | 3 | 54 | 85 | 49 | 1.99 | H |
| RM185 | 4 | 80 | 63 | 41 | 34.82** | H |
| RM1,359 | 4 | 80 | 57 | 51 | 38.07** | Mh |
| RM177 | 4 | 94 | 48 | 39 | 73.34** | PS2 |
| RM142 | 4 | 98 | 50 | 32 | 83.96** | PS2 |
| RM451 | 4 | 90 | 54 | 43 | 57.00** | H |
| RM153 | 5 | 34 | 81 | 68 | 15.04** | Mh |
| RM413 | 5 | 58 | 86 | 44 | 3.45 | Mh |
| RM13 | 5 | 47 | 81 | 60 | 5.39 | H |
| RM169 | 5 | 44 | 54 | 84 | 47.67** | Mh |
| RM557 | 6 | 51 | 56 | 73 | 31.07** | Mh |
| RM136 | 6 | 47 | 79 | 62 | 7.18* | Mh |
| RM8,225 | 6 | 58 | 86 | 45 | 3.32 | PS2 |
| RM8,226 | 6 | 48 | 60 | 70 | 24.34** | Mh |
| RM6,836 | 6 | 59 | 82 | 47 | 4.60 | PS2 |
| RM527 | 6 | 43 | 44 | 96 | 80.02** | Mh |
| RM564 | 6 | 45 | 80 | 58 | 4.74 | H |
| RM340 | 6 | 40 | 51 | 98 | 75.65** | Mh |
| RM38 | 8 | 85 | 58 | 39 | 47.19** | H |
| RM120 | 8 | 84 | 50 | 44 | 52.16** | PS2 |
| RM25 | 8 | 80 | 37 | 70 | 69.35** | Mh |
| RM331 | 8 | 56 | 91 | 34 | 5.35 | PS2 |
| RM44 | 8 | 58 | 78 | 44 | 5.38 | H |
| RM72 | 8 | 60 | 83 | 45 | 4.97 | PS2 |
| RM350 | 8 | 86 | 52 | 50 | 51.32** | PS2 |
| RM244 | 10 | 58 | 51 | 79 | 44.03** | Mh |
| RM304 | 10 | 70 | 56 | 57 | 29.39** | PS2 |
| RM228 | 10 | 56 | 86 | 38 | 3.96 | PS2 |
| RM332 | 11 | 89 | 54 | 39 | 57.56** | PS2 |
| RM441 | 11 | 48 | 81 | 59 | 4.88 | Mh |
| RM287 | 11 | 52 | 80 | 56 | 4.34 | H |
| RM229 | 11 | 97 | 48 | 41 | 77.27** | PS2 |
| RM5,961 | 11 | 57 | 79 | 54 | 5.48 | Mh |
| RM21 | 11 | 59 | 80 | 50 | 5.31 | H |
| RM206 | 11 | 59 | 81 | 48 | 4.88 | PS2 |
| RM1,233 | 11 | 60 | 84 | 44 | 4.85 | PS2 |
| RM6,293 | 11 | 71 | 63 | 45 | 23.25** | PS2 |
| RM224 | 11 | 100 | 45 | 50 | 82.18** | PS2 |
| RM247 | 12 | 75 | 55 | 57 | 35.17** | H |
| RM512 | 12 | 60 | 86 | 42 | 4.81 | PS2 |
| RM101 | 12 | 59 | 68 | 61 | 14.43** | Mh |
| RM179 | 12 | 76 | 56 | 56 | 34.98** | PS2 |
| RM511 | 12 | 88 | 52 | 43 | 56.23** | PS2 |
| RM465 | 12 | 86 | 52 | 42 | 53.60** | PS2 |
3.6 Map construction and localisation of loci showing distorted segregation
We surveyed 188 F3 individuals using primer pairs for 63 polymorphic SSR loci (out of 125), distributed across 10 linkage groups (rice chromosomes). Linkage maps for 63 polymorphic SSR markers were constructed for the F3 families using the QTL IciMapping programme. The number of polymorphic SSR loci evaluated ranged from 3 (chromosomes 3 and 10) to 10 (chromosome 11). Thus, polymorphic markers were primarily distributed on 11 chromosomes, leading to an expansion of these chromosomes. Ten linkage groups contained an average of seven loci, with a minimum of three (e.g., Ch.3 and Ch.10) and a maximum of ten loci (e.g., Ch.11). All 41 distorted loci (P < 0.05 and P < 0.01) were mapped onto these linkage groups (Fig. 6).
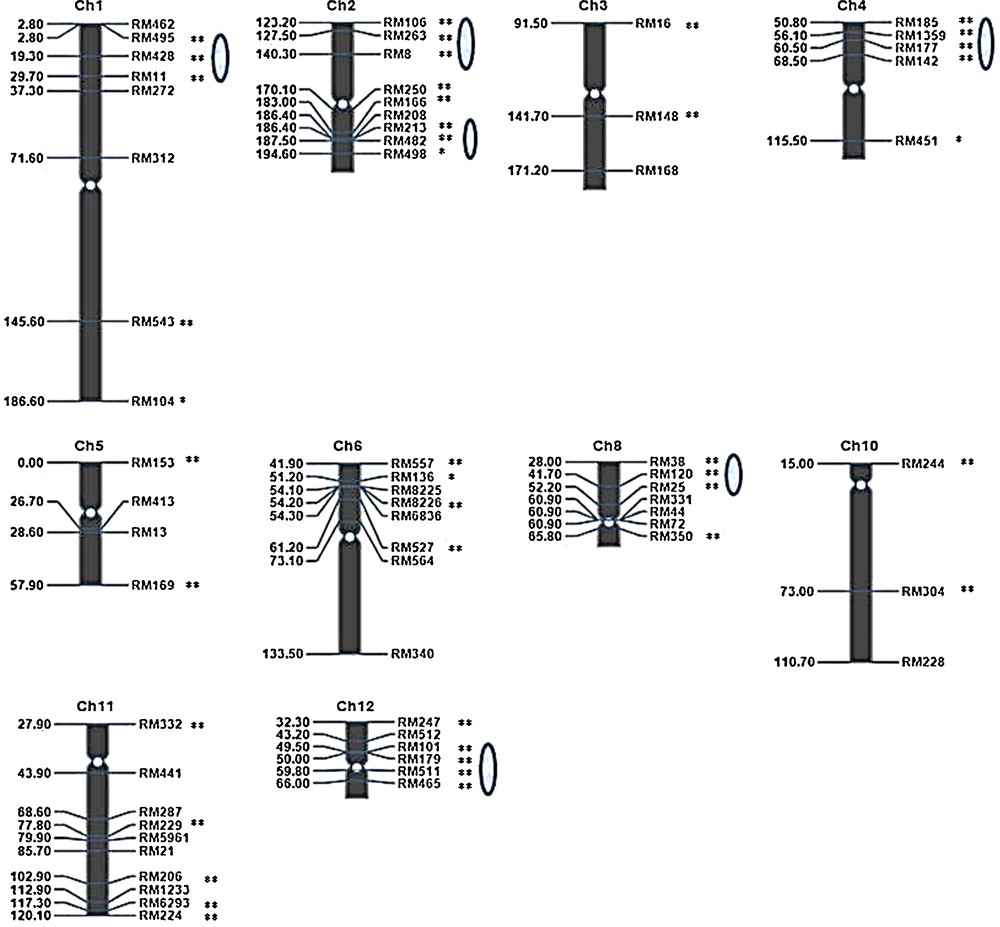
(Colour online.) Genetic linkage map for the rice F3 population and the distribution of markers with segregation distortion in the map. The numbers on the left are the marker positions and marker names are indicated on the right. The oval shapes on the chromosomes indicate the segregation distortion regions (SDRs). Symbols * and ** indicate significance levels of distorted segregation at 5% and 1%, respectively.
The segregation distortion region (SDR) was declared when three or more closely linked markers presented significant segregation distortion in the F3 populations (Fig. 6). The map showed that most distorted markers clustered in special regions on chromosomes. Six SDRs were identified on chromosomes 1, 2, 4, 8 and 12. Two SDRs were identified on chromosome 2. The SDRs on chromosome 12 were near centromeric regions. The size of SDR 1 was 26.9 cM, and the sizes of the two SDRs on chromosome 2, SDR 2.1 and 2.2, were 17.10 and 8.20 cM, respectively. The sizes of the SDRs on chromosomes 4, 8 and 12 were 17.70, 24.20 and 16.50 cM, respectively. The SDRs on chromosomes1, 8 and 2 (Fig. 7) were larger than the SDRs on chromosomes 4 and 12.

(Colour online.) Segregation distortion regions on chromosomes 1, 8, and 2. The numbers on the left are the marker distances in cM. The oval shapes on the chromosome indicate the segregation distortion regions (SDRs).
4 Discussion
In the present study, we performed high-throughput multiplex microsatellite analysis using 5′ dye-labelled PCR primers. Using this methodology, the time required for sample handling was significantly reduced. The total hands-on time from leaf sampling in the greenhouse to genotyping was less than 4 h per 96-sample reaction plate or 2.4 min per individual plant. The time required for the genotyping, i.e. for scoring the presence/absence of markers, depends on the depth of the analysis, and approximately 1 h per 96 plants is required. Although this method requires more sophisticated materials (e.g., fluorescently labelled primers and capillary electrophoresis materials) than the previous methods [69], low costs for disposable materials and chemistry could be maintained because of reduced reaction volumes and low failure rates. Therefore, compared with previously developed, fairly economic methods [69], high-throughput multiplex PCR represents important progress. For example, Dreher et al. [70] described the costs for multiple simple sequence repeat (SSR) marker analysis for a sample size of 1000 plants, and the time used for the genotypic screening of 100 plants is 8 h, which is approximately 30% longer than required for the methods applied here. In the present study, various parameters were analysed to optimise multiplex PCR. The results suggested that the fluorescence-based detection of DNA fragments is extremely sensitive. In contrast, previous studies have also suggested that although PCR is currently a routinely used and easy technique, to obtain reproducible and readable patterns of SSR–PCR products, the optimisation of the PCR conditions is often needed [71–73]. Other studies have also shown that optimisation is required because SSRs are frequently amplified with different efficiencies in conventional PCR [74]. In contrast, multiplex PCR often requires extensive optimisation to achieve relatively uniform amplification for each SSR [45,75]. Optimal conditions for a PCR multiplex reaction may differ obviously from those developed for uniplex reactions [75]. In the present study, different template DNA concentration of F3 plants was analysed to optimise the multiplex sets. Template DNA concentrations less than 20 ng generated decreased products, and specific amplification was obtained. Different concentrations of Taq DNA Polymerase were tested, and the most efficient enzyme concentration was approximately 0.4 μL or 2 U/25 μL reaction volumes. The concentration ranges for different reagents were successfully optimised for PCR amplification. High concentrations of enzyme resulted in the unbalanced amplification of various loci, likely reflecting the high glycerol concentration in the stock solution. The PCR conditions for the fluorescence-based analysis of multiplex amplification products must be fairly stringent (low Mg2+ concentration in the reaction mixture and few amplification cycles) to avoid both the detection of extraneous DNA fragments amplified through mispriming events and the stabilisation of undesirable interactions between multiple oligomers. The magnesium chloride concentration should be proportional to the amount of dNTPs, and these values can be constant for any reaction. The combination of various amounts of dNTPs and MgCl2 showed that 100 μM of each dNTP works well with 1.5–2 mM of MgCl2, whereas 800 μM of each dNTP required at least 2–5 mM of MgCl2. The threshold for the reaction was approximately 1 mM MgCl2 and 200 μM of each dNTP, with reduced PCR amplification below this MgCl2 concentration. The recommended magnesium chloride concentration in a standard PCR reaction is 1.5 mM at dNTP concentrations of approximately 200 μM each. To obtain high yields of specific product(s) in multiplex PCR, adjusting the amount of primer for each locus is also essential. After the reaction cycling conditions were optimised, primer concentrations of 0.1–0.3 μM were observed as optimal for multiplex PCR. The mixture was cycled multiple times under temperature conditions for denaturation, primer annealing, and DNA synthesis. Longer annealing times and higher annealing temperatures dramatically improved the amplification efficiency of the microsatellite loci. The results showed that thirty to thirty-five cycles are typically sufficient for a reaction, suggesting that to satisfactorily amplify the targeted amplicons, extensive optimisation is typically required for multiplex SSR–PCR, where more than one SSR locus is amplified per reaction. In the present study, the SSR–PCR products were analysed using an appropriate gel to control the amplification specificity and allele sizing. The microsatellite data were analysed for the presence/absence of the diagnostic fragment and to determine the genotype (the combination of alleles for all microsatellites) of all progeny plants using a statistical package. The experiments were repeated to confirm cases of null or multiple alleles. This study was the first to use labelled microsatellite markers for genotyping the F3 population produced from the cross of Pongsu Seribu 2 (PS2) × Mahsuri (Mh) using ABI 3100 capillary electrophoresis. A total of two alleles (with expected sizes for each allele) across all rice F3 samples were observed. A particular parent was considered to have contributed 0, 1 or 2 alleles to the progeny at each locus. Rice is a self-fertilised species, and therefore, in most cases, only 1 allele was detected per locus in each genotype. However, two alleles per locus were occasionally detected, consistent with a genotype derived from a single plant heterozygous for the locus in question. To accommodate these instances, each of the genotypes was recorded as having 2 alleles at a locus, which were identical for genotypes with 1 allele and different for genotypes with 2 alleles. Overall, in genotyping, a maximum of one allele per locus for a haploid organism or two alleles per locus for a diploid organism is expected. In the rice F3 population examined herein, 41 out of the 63 polymorphic loci showed significant deviations at significance levels of P < 0.05 and P < 0.01. Twelve distorted loci were skewed towards the female parent Mh, while 24 markers deviated towards the male parent, PS2. Moreover, 5 markers were distorted towards heterozygote individuals. Only 22 SSR markers showed good fit to an expected segregation ratio of 1:2:1 based on χ2 test at 0.05 percent probability. The rate of segregation distortion in this population was relatively high. Different genetic factors, including pollen tube competition, pollen lethality, preferential fertilisation, and selective elimination, could lead to segregation distortion; the first three factors were defined as gametic selection. In the present study, the frequency of most SSR markers was skewed towards the female genotype, suggesting that segregation distortion might have been influenced through some gametophytic genes. In many plant species, the most commonly reported genetic factors associated with the distorted segregation ratio were at the gamete level. In plants, the percentage, extent, origin and genetic effect of segregation distortion significantly varied with species, segregating population, crosses and molecular markers [8,76,77]. Thus, segregation distortion could be influenced through many factors; however a thorough conclusion could not be drawn from only an F3 population. Therefore, further studies on segregation distortion using DH, BC or RIL populations are needed. Segregation distortion varies significantly with population types [76]. Xu et al. [78] found that the rate of segregation distortion was lower in F2 populations compared to other populations.
A genetic linkage map was constructed for the F3 population using the primer pairs for 63 polymorphic SSR loci. The polymorphic markers were distributed into ten linkage groups (10 rice chromosomes). All distorted loci were mapped to these linkage groups. An association between the regions of segregation distortion and QTLs or genes could be detected after further analysis. The results of QTL analysis could enhance our knowledge concerning the mechanisms of segregation distortion, facilitating the prediction of an appropriate population size to obtain the desired recombinants. Overall, the results presented here similar with previous studies [28,30,32,38,39,48,75,79,80] demonstrated the potential of this approach for high-throughput plant genotyping, genetic characterisation, mapping, genetic association studies and genome analysis. Therefore, this methodology is a highly informative method for genotyping and should be applied for similar analyses in any species. This approach also is useful to study the levels and patterns of rice genotypes when multiple populations require fingerprinting. In the future, the development of microsatellites panels from each of the rice chromosomes examined in the present study will facilitate the genotyping of rice germplasm collections and the identification of genes and QTLs underlying blast resistant traits.
Disclosure of interest
The authors declare that they have no conflicts of interest concerning this article.
Acknowledgements
The authors would like to thank the Agrotechnology and Biosciences Division Laboratory, Malaysian Nuclear Agency, for providing research facilities. This research was funded by Long term Research Grants Scheme (LRGS), Ministry of Higher Education, Malaysia.