

1 Introduction
The olive tree (Olea europaea L.) belongs to the family of Oleaceae and is one of the oldest known agricultural settlements in history. It is presently spreading from the Mediterranean region of origin to new production areas, due to the beneficial nutritional properties of olive oil and to its high economic value [1]. Despite the enlargement of the olive growing in new extensions all over the world, this enlargement is done mainly by few commercial cultivars. The increasing use of conventional cultivars added to the growing phenomenon of urban development in some areas is always at the expense of minor and ancient olive accessions that are generally located in restricted areas and are sometimes threatened by elimination. These minor and ancient olive accessions are generally characterized by a high genetic variability, which is important for the conservation of several adaptative and interesting traits that could support olive growing. In this context, various studies were interested in the identification and characterization of minor and ancient accessions all over the world [2–9].
In Tunisia, the cultivation of olive trees is millennial. The long history of olive cultivation and the differentiated pedoclimatic conditions from the North to the South of the country allowed a quite rich olive germplasm. The Tunisian cultivar sets can be split into those of local origins and those introduced from the Near-East and western regions, making Tunisia in central Mediterranean a key-place for olive and oleaster diversity [10]. However, olive cultivation in Tunisia depends mainly on two prevailing cultivars: Chetoui in the northern part of the country and Chemlali in the central and southern parts. The Tunisian olive germplasm is estimated to include about 56 cultivars [11]. Most of them are maintained in restricted areas. This number is probably underestimated because of the scarce information on minor local varieties widespread in the different olive growing areas.
Identification and characterization of Tunisian olive cultivars was developed by morphological [11–13] and molecular markers such as AFLP [14], RAPD [15], SSR [16–18] and SNP [19]. Those studies have focused mainly on central (Sidi Bouzid, Kairouan, Kasserine), southern and northern parts of Tunisia. However, Central-East Tunisia and especially the region of Sousse, ‘capital of the Tunisian Sahel’, has been neglected in the literature regarding olive characterization, although it is considered as a historical location of olive biodiversity [20]. Furthermore, the rapid and uncontrolled urbanization is spreading out on behalf of the important number of old olive groves that increased olive germplasm erosion in the coastline of Tunisia [21]. As a consequence, an imperious conservation of traditional genotypes before their disappearance is required.
In order to evaluate and exploit olive diversity in this region, a prospecting effort was carried out in many ancient and historical olive groves. In the present work, we performed the morphological, pomological and molecular characterization of some olive accessions selected for their fruit and oil characteristics. Additionally, a study of the relationship between the selected accessions and known classic olive cultivars was performed. A comparison of morphological and molecular markers was also performed to investigate the usefulness of molecular markers as a complement and/or an alternative for varietal distinctness based on morphological criteria.
2 Materials and methods
2.1 Plant material and DNA extraction
The study was carried out on twenty-seven autochthonous olive accessions (Olea europeae L.) collected from archeological sites and ancient olive groves localized in Central-Eastern Tunisia, which is actually subjected to a high risk of olive genetic erosion due to rapid and uncontrolled urbanization (Fig. 1). They were collected from old olives surviving as isolated trees or groups of trees. Those genotypes were selected for their different and interesting morphological characteristics compared to standard Tunisian cultivars. They were selected also based on trunk and stump size as the tree age indicator. They were picked respectively from Msaken–Boujriwil, Oued Laya, Sidi Bou Ali, Zaouiet Sousse, Hammam Sousse, Chott Mariem-Foukaia and Mahdia–Aliya (Table 1). All the olive groves studied were under rain-fed conditions. Five Tunisian cultivars: Zarrazi Zarsis (ZZ), Chemlali Zarzis (ChZ), Chemlali Sfax (ChS), Zalmati (Zal) and Chemlali Tataouine (ChT) were supplied from the national collection of olive in Boughrara–Sfax. They were taken as references (Table 2).
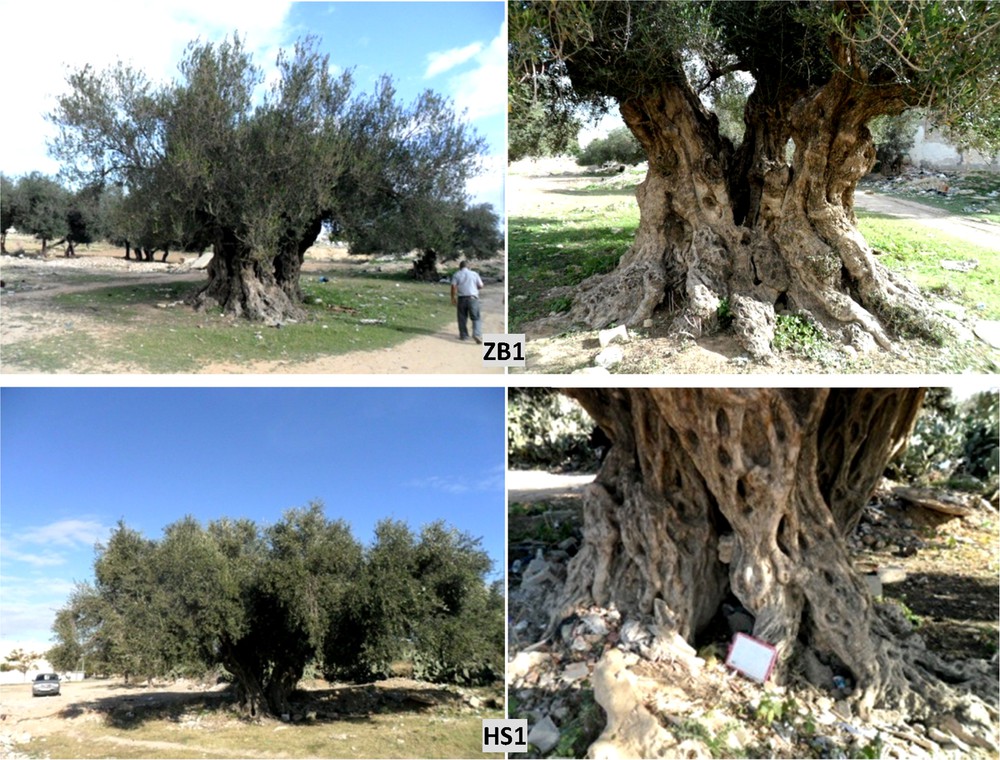
Ancient olive tree of the same selected olive accessions.
List of the analyzed autochthonous olive accessions from different prospected zones.
| Prospected zone | Accessions code | Latitude–longitude |
| M'saken Boujriwil–Sousse | M1, M2, M3, M4, M5, M6, M7, M8, M9, M17 | 35°43′45″N–10°34′50″E |
| Sidi Bou Ali–Sousse | SB1, SB2, SB3, SB4, SB5, SB6 | 35°57′30″N–10°28′34″E |
| Zaoueit–Sousse | ZB1, ZB2, ZB3, ZB4, ZB5 | 35°46′59″N–10°37′59″E |
| Oued Laya–Sousse | TW1, TW2, TW3 | 35°49′60″N–10°33′0″E |
| Hammem–Sousse | HS1 | 35°51′39″N–10°36′11″E |
| Chott Mariem–Foukaia–Sousse | F1 | 35°95′98″N–10°53′27″E |
| Aliya–Mehdia | A | 35°30′16″N–11°03′43″E |
List of the analyzed olive cultivars from the Tunisian olive germplasm collection in Boughrara–Sfax.
| Cultivar reference | Cultivation zone | Origin site |
| Chemlali Tataouine | Tataouine, extreme South | Tataouine |
| Zalmati | Medenine | Zarzis |
| Chemlali Zarzis | Gabes, Medenine, Tataouine | Zarzis |
| Chemlali Sfax | South and center of Tunisia | Sfax |
| Zarrazi | Medenine and south Tunisia | Zarzis |
DNA was extracted from healthy young leaves using the CTAB method of Doyle and Doyle [22] with minor modifications. 0.5 g plant material were ground in liquid nitrogen and incubated in the extraction buffer (CTAB 2%, 20 mM EDTA, 1.4 M NaCl, 100 mM Tris–HCl pH: 8.0, 2% β-mercaptoethanol). The samples were incubated at 65 °C for 30 min, mixed with 750 μl of chloroform–isoamyl alcohol (24:1) and centrifuged at 10,000 rpm/min for 10 min. The aqueous phase was recovered and the DNA precipitated with 0.6 v of isopropanol and 0.08 v of sodium acetate (3 M). The pellet was washed in 70% ethanol, dried and re-suspended in 50 μL of TE buffer (10 mM Tris–HCl pH: 8, 0.1 mM EDTA). The determination of DNA quality and concentration was performed by a Nanodrop apparatus and electrophoresis in a 0.5% agarose gels.
2.2 Morphological and pomological analysis
Sixteen morphological and pomological traits were observed on each olive accession. All the measurements were evaluated for 40 samples of leaves and fruits per tree. After fruits characterization, stones were removed and subject of characterization. Leaf parameters were: leaf length (LL, mm), leaf width (LWI, mm), leaf surface (LS, mm2) and leaf length/width ratio (LR). The fruit parameters were: fruit weight (FW, g), fruit length (FL, mm), fruit width (FWI, mm) and fruit length/width ratio (FR). Stone parameters were: stone weight (SW, g), stone length (SL, mm), stone width (SWI, mm), stone length/width ratio (SR) and number of grooves (SG). Pomological traits were: flesh/stone ratio (FSR), oil content in percentage of wet matter (OWM %), and oil content in percentage of dry matter (ODM %).
2.3 RAPD analysis
From 23 RAPD primers tested, ten were selected for this study (Table 4). PCR was performed on an Eppendorf Mastercycler thermal cycler in a total volume of 20 μl. The PCR mix contained 5× PCR buffer, 8 mM dNTPs, 25 mM MgCl2, 5 μM primer, 1 U Taq DNA polymerase, and 50 ng template DNA. The temperature profile consisted of an initial 2-min denaturation step at 95 °C, followed by 35 cycles at 94 °C for 1 min, primer annealing at 35 °C for 1 min and extension step at 72 °C for 2 min. The final elongation step was at 72 °C for 5 min. Amplification products were separated by electrophoresis through 1.6% modification products were separated by electrophoresis through 1.6% agarose gel stained with ethidium bromide in 0.5 × TAE buffer. The size of the fragments was estimated using the 1 Kb plus DNA ladder. The RAPD bands were visualized under UV light and photographed with a Photo Print (Vilber Lourmat, France) imaging system and analyzed by BioOne D++ software (Vilber Lourmat, France).
Diversity parameters of 10 RAPD markers characterizing the 32 olive accessions: band number (NB), number of polymorphic band (NPB), % polymorphism (P%), % primer efficiency (PE%) and % discrimination power (DP%).
| RAPD marker | Sequence 5′–3′ | Size range (bp) | NB | NPB | P (%) | PE (%) | DP (%) |
| OPA9 | GGGTAACGCC | 250–1200 | 12 | 10 | 83.3 | 13.04 | 11.63 |
| OPA10 | GTGATCGCAG | 300–850 | 10 | 10 | 100.0 | 10.87 | 11.63 |
| OPA11 | CAATCGCCGT | 250–2000 | 13 | 13 | 100.0 | 14.13 | 15.12 |
| OPAA10 | TGGTCGGGTG | 250–1800 | 10 | 10 | 100.0 | 10.87 | 11.63 |
| OPAA18 | TGGTCCAGCC | 400–1400 | 6 | 5 | 83.3 | 6.52 | 5.81 |
| OPC19 | GTTGCCAGCC | 375–1925 | 8 | 7 | 87.5 | 8.70 | 8.14 |
| OPD13 | GGGGTGACGA | 200–1400 | 11 | 10 | 90.9 | 11.96 | 11.63 |
| OPE1 | CCCAAGGTCC | 275–2000 | 7 | 7 | 100.0 | 7.61 | 8.14 |
| OPE3 | CCAGATGCAC | 200–1200 | 9 | 8 | 88.9 | 9.78 | 9.30 |
| OPR13 | GGACGACAAG | 350–1000 | 6 | 6 | 100.0 | 6.52 | 6.98 |
| Total | 92 | 86 | |||||
| Average | 9.2 | 8.6 | 93.4 | 10.0 | 10.0 |
2.4 SSR analysis
Nine SSR primer pairs were used (Table 1). The 20-μl PCR mix contained 10× PCR buffer, 2.5 mM dNTPs, 25 mM MgCl2, 20 μM of forward and reverse primers, 0.5 U Taq DNA polymerase and 50 ng template DNA. The temperature profile included an initial denaturation step at 94 °C for 5 min, followed by 35 cycles of 94 °C for 20 s, primer annealing at 50 °C for 45 s and extension step 72 °C for 45 s. The final elongation step was at 72 °C for 8 min. Amplification products were separated by electrophoresis through 4% Agarose gel staining was followed by ethidium bromide staining in a 0.5× TAE buffer. The size of the fragments was estimated using 50 pb plus DNA ladder. The SSR bands were treated similarly to the RAPD bands.
2.5 Data analysis
The morphological and pomological traits were evaluated for their quantitative variables: mean, minimum value, maximum value, standard deviation (SD), and coefficient of variation (CV %). The collected data was analyzed by principal component analysis (PCA) using XLSTAT version 3.2016 software. Clustering analysis was also performed using NTSYSpc software version 2.1 [23] after standardization.
For RAPD analysis, primer efficiency was calculated by dividing the number of markers produced for each primer by the total number of markers obtained. The discrimination power was calculated by dividing the number of polymorphic markers amplified for each primer by the total number of polymorphic bands obtained [24].
For SSR analysis, the observed heterozygosity (Ho), the expected heterozygosity (He), the frequency of null alleles (R), the probability of identity (PI), and the polymorphism information content (PIC) were calculated using IDENTITY 1.0 software (Centre for Applied Genetics, University of Agricultural Sciences, Vienna, Austria). These parameters served to evaluate the information given by the microsatellite markers. The comparative level of polymorphism and informativeness of RAPD and SSR markers were estimated following the procedures previously described by Belaj et al. [25].
RAPD and SSR bands were scored as 1 (present) or 0 (absent) in a binary matrix for each primer. The Jaccard's similarity coefficient [26] was calculated by using the SIMQUAL module on each matrix. The similarity coefficients were then used to construct dendrograms, by using the unweighted pair group method with arithmetic averages (UPGMA) employing the SAHN. The cophenetic correlation coefficient was used to measure the goodness of fit. Pairwise comparison of distance matrices from independent molecular and morphological data was performed in NTSYSpc with the Mantel test [27] with 1000 permutations. Comparison of cophenetic matrices was done between matrices obtained with the same clustering algorithm. The results of the SSR markers were compared to the FAO Olive Germplasm Database (www.oleadb.it) [28].
3 Results and discussion
3.1 Morphological and pomological analysis
The mean range, the maximum and minimum values, the standard deviation and the coefficient of variation (CV) for morphological traits are given in Table 3. The coefficient of variation varied from 11.04% (fruit ratio) to 80.25% (fruit weight). A wide degree of variability was obtained for most evaluated traits. The CV was high (>20%) for the fruit's weight and width (FW, FWI), stone weight (SW), flesh-to-stone ratio (FSR), leaf surface (LS), and oil content in percentage of wet and dry matter (OWM, ODM). All other morphological characters presented medium CV (20–15%) except fruit and stone ratios (FR, SR) and stone grooves (SG). The coefficients of variation recorded in this study were similar or even slightly higher than those previously reported in olive cultivars collection [29] and wild olives [30] using morphometric traits; however, the highest one was noted on fruit by the same authors. Fruit and stone weights varied from 0.56 g to 9.17 g and from 0.15 g to 1.23 g, respectively. The oil content in percentage of wet and dry matter varied from 7.2% to 30.70% and 15.1% to 52.1%, respectively. This can be explained by the fact that studied olive accessions included both olive oil and table olive.
Statistic descriptive of the morphological and pomological characters.
| Characters | Min | Max | Mean | SD | CV (%) |
| FW (g) | 0.56 | 9.17 | 1.90 | 1.53 | 80.25 |
| FL (mm) | 13.59 | 28.74 | 18.12 | 2.96 | 16.32 |
| FWI (mm) | 8.45 | 23.20 | 12.73 | 2.80 | 21.98 |
| FR | 1.09 | 1.94 | 1.45 | 0.16 | 11.04 |
| SW (g) | 0.15 | 1.23 | 0.32 | 0.19 | 59.43 |
| SL (mm) | 10.87 | 19.62 | 13.67 | 2.26 | 16.55 |
| SWI (mm) | 5.08 | 10.64 | 6.59 | 1.10 | 16.62 |
| SG | 5.80 | 10.50 | 8.16 | 1.06 | 12.97 |
| SR | 1.38 | 2.56 | 2.09 | 0.28 | 13.15 |
| FSR | 2.16 | 10.41 | 4.80 | 1.88 | 39.16 |
| LL (mm) | 37.49 | 75.00 | 56.41 | 8.92 | 15.82 |
| LWI (mm) | 8.00 | 16.78 | 11.45 | 2.02 | 17.60 |
| LS (mm2) | 2.41 | 7.12 | 4.04 | 1.01 | 25.13 |
| LR | 3.53 | 9.09 | 5.03 | 1.07 | 21.33 |
| OWM (%) | 7.20 | 30.70 | 17.76 | 5.78 | 32.55 |
| ODM (%) | 15.10 | 52.10 | 33.07 | 9.69 | 29.31 |
Principal component analysis was performed for all morphological and pomological parameters. The first three components (PC1, PC2 and PC3) expressed respectively 42.4%, 21.6% and 12.8% of the total variance, accumulating 76.7% of the total observed variability. The first component was positively correlated with fruit size (FW, FWI, FL), stone size (SWI, SW), and oil content (OWM, ODM). In fact, a high and significant correlation was noted between fruit and stone weight (r = 0.902), length (r = 0.793), and width (r = 0.842). The correlations between quantitative traits among the fruit and stone dimensions were previously reported for wild olive trees [31], seedlings [32,33], and cultivated olive trees [30,31,34]. A significant correlation was found also between fruit weight and oil content (r = 0.618), which corroborates previous studies carried out in wild olive [30]. The second component was positively correlated with leaf size (LWI, LS) and negatively with flesh-to-stone ratio (FSR). The third component was positively correlated with fruit and stone shape (FR, SR). In fact, a significant correlation coefficient was noted between fruit and stone ratios (r = 0.730), as previously reported by Sorkheh et al. [35].
The PCA performed for morphological and pomological traits was useful for identifying the most important traits associated with the variation among the studied olive accessions (Fig. 2a). The most discriminating features were fruit size (FWI, FW, FL) followed by stone size (SWI, SW), oil content (OWM, ODW), leaf size (LWI, LS), stone shape (SR), flesh-to-stone ratio (FSR), and finally fruit shape (FR). Fig. 2b shows a projection of the olive accessions determined by the first two principal components. The accession (F1) from the region of Chott Mariem seems to diverge significantly from the other ones. This result is expected since it has presented the highest average value for weight (9.17 g), length (28.74 mm), and fruit diameter (23.20 mm). Furthermore, this accession presented a medium to low tree vigor that can be interesting for the expansion of intensification and mechanization of table olive trees. Accessions located on the left-hand side of the plan were distinguished by big fruit size (M17, ZB5, ZZ) and high flesh-to-stone ratio and oil content (M1, M2, M3, M6, M7, M8, M10, TW2). Theses accessions can be valued as a dual purpose olive tree; this means that it is simultaneously oil and table olive like the cultivar reference Zarrazi Zarzis (ZZ) considered as secondary cultivars in Tunisia. It is characterized by high oil content and good acidic composition, and it is usually cultivated in mixture with the variety Chemlali Sfax because of his self-incompatibility. Accessions located on the upper and right parts of the plane presented generally big leaf size (ZB4, HS1, SB3), low oil content and pulp percentage (TW3, ZB2, M4, ZB4, TW1, A, ZB1, SB1). Most of those accessions presented feral olive forms that can be issued from hybridization between wild and cultivated olive varieties as (TW3, A, SB1, HS1, ZB4). Accessions in the middle of the plane presented morphological and pomological characteristics similar to those of Chemlali Sfax, the most cultivated olive trees in Tunisia. It is a productive variety, self-fertile, drought tolerant and well adapted to the local tough environmental conditions. Other cultivars like Zalmati (Zal) and different Chemlali clones as Chemlali Tataouine and Chemlali Zarzis are also grouped in the center of the plan. All those cultivars resemble Chemlali Sfax in some morphological traits; however, they are genetically different, and each one of these cultivars has its own culture area and is differentiated by their own descriptive morphological card as described by Trigui and Msallem [11].
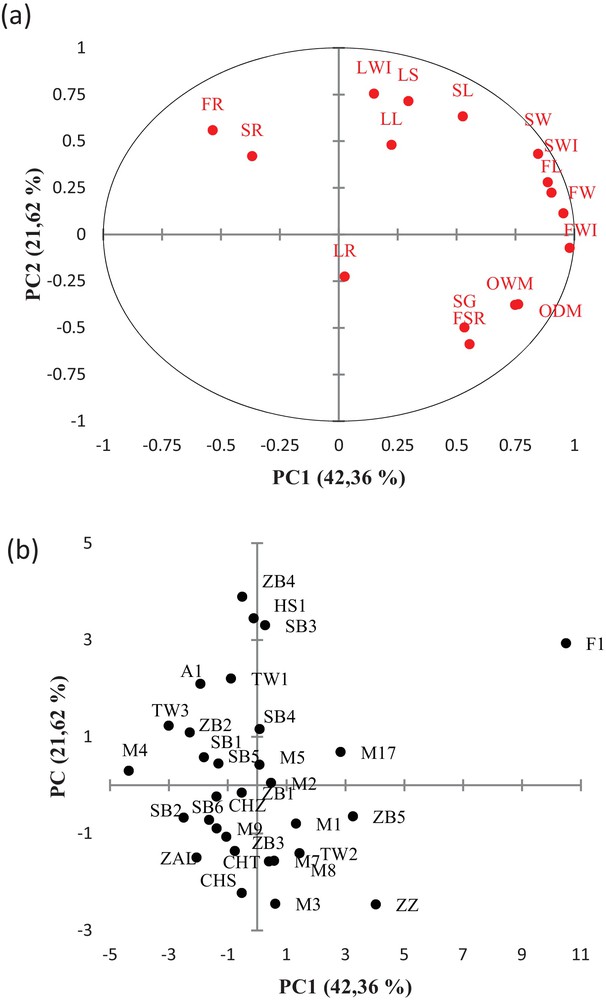
Projection of the morphological traits (a) and olives accessions (b) in the plane generated by the first two principal components.
3.2 RAPD analysis
Ten decamer oligonucleotide primers were selected among the 23 ones that were screened (Table 4). Thirteen primers did not give scorable bands (OPA08, OPA12, OPAA03, OPAA16, OPE05, OPE06, OPC07, OPD07, OPD10, OPD15, OPR19, OPB01, and OPF03). Primers yielding valuable bands varied. A total of 92 bands were obtained from 32 olive accessions. The most bands were observed in OPA11 primer with 13 bands, whereas the fewest were observed in OPR13 and OPAA18 primers, with 6 bands. Eighty-six bands were polymorphic, with an average of 8.6 polymorphic markers generated per primer. The lower average has been reported by Brake et al. [36] when analyzing 13 Jordanian olive cultivars using 15 RAPD markers (5.73). The higher average has been reported by Martins-Lopes et al. [37] analyzing 38 Portuguese olive cultivars using 20 RAPD markers (13.1). This depends either on the number and discrimination power of the RAPD markers and the number and amount of diversity of plant material. Ten bands were unique, allowing the identification of nine olive accessions. The molecular weight of the amplification products varied from 200 bp (OPZ13) to 2000 bp (OPA11, OPE1). The primer OPAA18 amplified five polymorphic markers, showing the lowest discrimination power (5.8%), whereas OPA11 showed the highest discrimination power (15.1%). The polymorphism percentage varied from 83.3% to 100%, with an average of 93.4%. Previous investigation in RAPD markers reported similar polymorphism information using OPA9 [38,39], OPA10 [38–40], OPA11 [39], and OPE1 [41].
3.3 SSR analysis
Microsatellites showed a high level of polymorphism throughout the analyzed accessions and revealed the existence of 63 alleles. The number of alleles per locus ranged from six (UDO99-39 and EMO-90) to nine (ssrOeUA-DCA18), with an average of seven alleles per locus, revealing a high level of variability (Table 5). Higher averages have been reported by other workers [42–44], most likely as a consequence of using more diversified olive genotypes or more polymorphic microsatellite markers. The range of allele sizes in base pairs varied from 105 bp at locus ssrOeUA-DCA17 to 255 bp at locus ssrOeUA-DCA3. The observed heterozygosity value (Ho), which represents the number of heterozygous individuals per locus, showed the lowest value at locus UDO99-39 (0.31) and the highest at locus ssrOeUA-DCA09 and ssrOeUA-DCA18 (0.94), with a mean value of 0.76. Expected heterozygosity values (He) ranged from 0.71 (ssrOeUA-DCA16) to 0.86 (ssrOeUA-DCA9) with an average of 0.81. Except for the ssrOeUA-DCA4, ssrOeUA-DCA17 loci and UDO99-39, He was lower than Ho. This observed heterozygosity deficiency may be related to the presence of null alleles, whose frequency values were positive. Baldoni et al. [45] and Trujillo et al. [46] reported a positive value of null allele frequency at loci ssrOeUA-DCA4. Muzzalupo et al. [47] and Belaj et al. [48] reported the occurrence of null alleles at locus UDO99-39. Positive null allele's frequencies have been also reported for the ssrOeUA-DCA17 locus by Baldoni et al. [45]. Polymorphic information content (PIC) showed an average value of 0.78. This index ranged from 0.66 (ssrOeUA-DCA16) to 0.85 (ssrOeUA-DCA9). All PIC values were higher than 0.5, which demonstrates the powerfulness of the markers used. This result is in accordance with the consensus list of SSRs for worldwide olive DNA typing recommended by Baldoni et al. [45]. Probability of identity (PI) ranged from 0.037 to 0.14 at DCA09 and DCA16, respectively. The accumulated probability of identical genotypes for all loci of 1.70 × 10⁻¹¹, which confirms the high discriminative level of the used microsatellite set. Similar PI was obtained by the analysis of 92 accessions of ten Iranian cultivars (1.2 × 10⁻⁹) analyzed by 13 SSR markers [49], 24 Spanish cultivars (1.70 × 10−11) by 10 SSR [50] and 19 cultivars from Slovenian olive collection by 14 SSR markers (1.43 × 10⁻¹¹) [51].
Diversity parameters of 9 SSR markers characterizing the 32 olive accessions: allele number (Na), allele size (Sa), allele frequency (Fa), observed heterozygosity (Ho), expected heterozygosity (He), probability of null allele (R), polymorphic information content (PIC), and probability of identity (PI).
| SSR locus | N a | S a | F a | H o | H e | R | PIC | PI |
| ssrOeUA-DCA3 | 7 | 227–255 | 0.031–0.34 | 0.81 | 0.77 | −0.023 | 0.75 | 0.086 |
| ssrOeUA-DCA4 | 8 | 134–198 | 0.031–0.25 | 0.62 | 0.83 | 0.111 | 0.81 | 0.051 |
| ssrOeUA-DCA9 | 8 | 162–206 | 0.062–0.22 | 0.94 | 0.86 | −0.043 | 0.85 | 0.037 |
| ssrOeUA-DCA14 | 7 | 155–191 | 0.031–0.23 | 0.85 | 0.82 | −0.010 | 0.79 | 0.054 |
| ssrOeUA-DCA16 | 5 | 142–182 | 0.016–0.41 | 0.78 | 0.71 | −0.041 | 0.66 | 0.132 |
| ssrOeUA-DCA17 | 7 | 105–185 | 0.109–0.25 | 0.72 | 0.84 | 0.066 | 0.82 | 0.045 |
| ssrOeUA-DCA18 | 9 | 167–191 | 0.016–0.25 | 0.94 | 0.83 | −0.056 | 0.81 | 0.048 |
| UDO99-39 | 6 | 108–220 | 0.016–0.30 | 0.31 | 0.79 | 0.580 | 0.76 | 0.078 |
| EMO-90 | 6 | 180–194 | 0.110–0.20 | 0.88 | 0.83 | −0.027 | 0.80 | 0.055 |
3.4 Genetic relationships among olive accessions
The three markers gave different dendrograms, in which the 32 olive accessions were separated into different groups with different numbers of subgroups. In general, the grouping of the olive cultivars did not reflect a close relationship with their sampling sites. However, a certain tendency to group the olive trees according to their geographical distribution was observed in the dendrograms issued from molecular data.
The UPGMA cluster analysis of the accessions based on the morphological characters revealed three major groups of accessions, mainly according to fruit size. This result corroborates other studies carried out in other classic cultivars based on morphometric characters [29,52,53]. The first group included six olive accessions (TW2, ZB5, M7, M8, M3 and M6) with high fruit weight and flesh to stone ratio and important oil content. The second group enclosed 13 accessions with medium fruit size and oil content. The rest of the accessions clustered together in Group 3. They were characterized by medium to small fruit size, low oil content and relatively big leaf size. This last group included four accessions which are feral olive trees (SB1, SB2, A, TW3).
The UPGMA cluster analysis of the accessions based on RAPD data indicated clear differences among olive accessions, with the similarity coefficients between all possible pairs of genotypes ranging from 0.25 to 0.88 (Fig. 3a). Eight main clusters were defined. Three accessions picked respectively from Aliya–Mahdia, Foukaia–Chott Mariem, and Hammem Sousse, which are geographically distant, were separated and formed individual branches. The five olive references cultivars were clustered together. The five accessions picked from Zaouiet Sousse were grouped also together. Accessions picket from Msaken–Boujriwil were grouped in a same cluster, except M8 and M9. These results agree with those of previous studies performed using RAPD markers, in which a clustering of olive cultivars from different geographic origins had been observed [7,54]. No apparent clustering according to morphological traits or fruit use of olive accessions was found contrary to other study with RAPD markers [55–57]. However, Belaj et al. [40], Sanz-Costés et al. [54], Martins-Lopes et al. [37] and Parra-Lobato et al. [7] found no apparent clustering of olive cultivars by fruit size or other morphological traits.
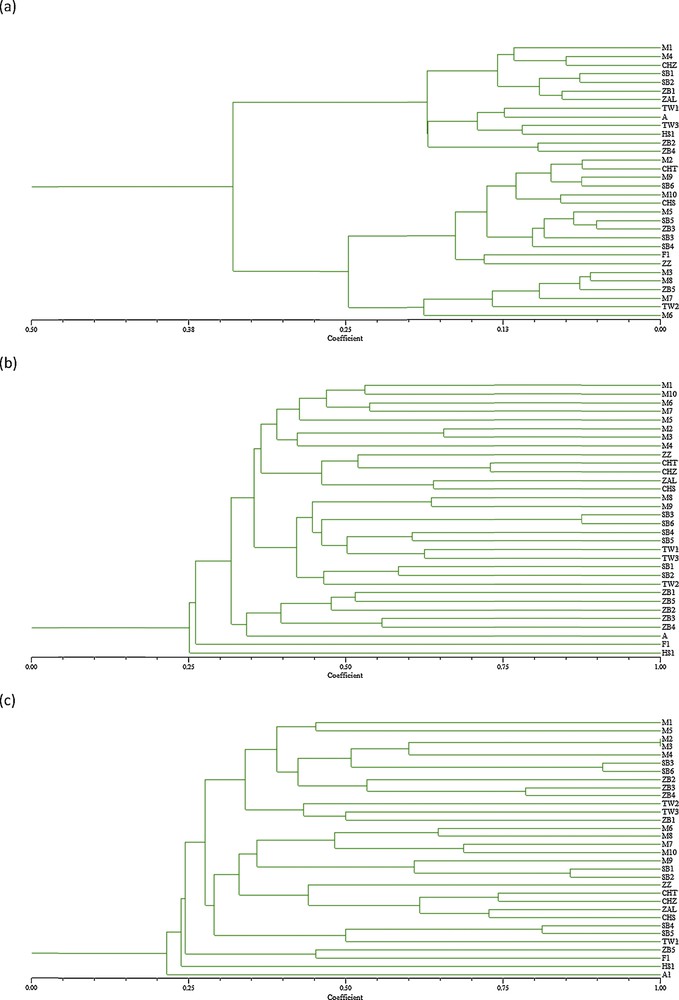
(a) Cluster tree derived by SHAHN method based on 17 morphological traits among 32 olive genotypes, (b) UPGMA Dendrogram based on Jaccard's similarity coefficient on 10 RAPD markers among 32 olive genotypes, (c) UPGMA Dendrogram based on Jaccard's similarity coefficient on 9 SSR markers and among 32 olive genotypes.
The UPGMA cluster analysis of the olive accessions based on SSR data demonstrated the presence of seven major groups. The similarity coefficient varied from 0.21 to 1. The lowest similarity was noted on the accession Mahdiya-Aliya, which was separated in the first cluster. This accession is for millennia characterized by multiple trunks, low oil content although interesting oil composition. The second cluster contained the accessions picked from Hammem Sousse, which were characterized by a vigorous tree and considerable trunk indicating an old age, likely corresponding to more than a hundred years, and an important flowering and pollen production (data not shown). This accession can be valued as pollinator (or Dhokar as genetic Tunisian nomination). The third cluster contained accessions picked from Foukaia–Chott Mariem and one accession from Zaouiet Sousse. The last two accessions were characterized by a very big fruit size. Rekik et al. [16] noted that two Tunisian olive table Besbessi and Tounsi were well separated from the other cultivars, which was probably the result of a different genetic background, as might be expected from their very big fruit size. The fourth cluster grouped the olive cultivars taken as references. The rest of the accessions were divided into three clusters. The highest similarity coefficients were noted respectively between M2 and M3, SB3 and SB6, SB1 and SB2, SB4 and SB5, ZB3, and ZB4. All pairs were originated from same geographic origin. Similar clustering tendencies were reported according to the genotype's geographical origin in previous study using SSR markers [33,58,59]. The clustering of the accessions from the same or nearby region suggests a common genetic base and an autochthonous origin for these accessions, which agreed with the hypotheses of autochthonous origin as well as the limited diffusion of olive cultivars from their origin zones of cultivation [40,60]. No clear clustering according to fruit size or olive use was noted, as reported by Delgado et al. [61] and Trujillo et al. [46].
The classic Tunisian olive cultivars taken as references were clustered together on the two dendrograms issued from molecular markers (RAPD, SSR). Present clustering is in overall accordance with previous studies performed using molecular analysis by SSR markers carried out on a large number of Tunisian olive cultivars [16,18,62]. Ben Ayed et al. [62], studying the genetic relationship of 15 cultivars corresponding to the major and widely distributed Tunisian cultivars, noted that Chemlali Tataouine differed from Chemlali Sfax, which suggests that nomination reflects just similarity on fruit and leaves. Rekik et al. [16] found that the maximum genetic similarity was found between Zalmati and Chemlali Sfax. Compared to the allele size reported for seven out of the 14 SSR markers analyzed in the international database of olive cultivars (www.oleadb.it), the two varieties Chemlali Sfax and Zalmati showed a good identity and minor variations with the material of the database. This result confirms the large clonal variability of those two varieties. Moreover, a comparison was done for all studied genotypes with the material of the database to identify synonymy for our genotype. Any synonymy with the cultivars recorded was found. However, the allele sizes were tentatively harmonized according to the list of allele sizes displayed for each marker.
3.5 Relationships and concordance among morphological and molecular markers
The cophenetic correlation coefficient value between the dendrogram and the original distance matrix estimated from the morphological, RAPD and SSR markers was rmorph = 0.78, rRAPD = 0.86 and rSSR = 0.89, respectively. These cophenetic correlation coefficients indicated a good fit for molecular data and modest fit for morphological data according to the phenograms (Fig. 4).
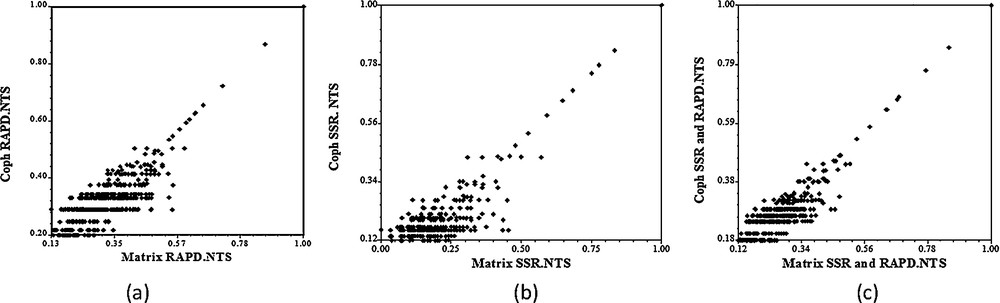
Cophenetic correlation matrices using RAPD (a), SSR (b) and SSR + RAPD (c).
The Mantel matrix correspondence test was used to compare the similarity matrices. No correlation between either the morphological and RAPD similarity matrices (r = −0.04) or the morphological and SSR similarity matrices (r = −0.10) was found. In fact, no clustering similarities were observed between morphological and molecular data phenograms. Similar estimates of the correlation coefficient between morphological and molecular data were obtained in previous study [30,35,55,63]. This could be due to the limited number of characters that were selected and measured. The discordance between morphological and molecular diversity may result from similar selection pressure, which leads to similar forms with different genetic backgrounds [63]. Owing to the very scarce genomic information that is available for the olive, it is very difficult to predict how many genes are involved in the morphological analyzed characters. Qualitative traits are expected to be under monogenic or oligogenic control [64]. Conversely, quantitative traits have a more complex genetic base, as they are governed by multiple genes and their interactions [64].
The correlation coefficient between matrices based on RAPD and SSR markers was significant but relatively low (r = 0.45) (Fig. 5). Belaj et al. [25] reported significant coefficient of correlation between RAPD and SSR data (r = 0.39) using eight SSR markers and 21 RAPD markers on 32 olive cultivars. A high and significant correlation was noted also between the consensus molecular data (RAPD + SSR) and both SSR data (r = 0.76) and RAPD data (r = 0.90). This can be explained by the large number of RAPD bands compared to that of SSR detected bands.
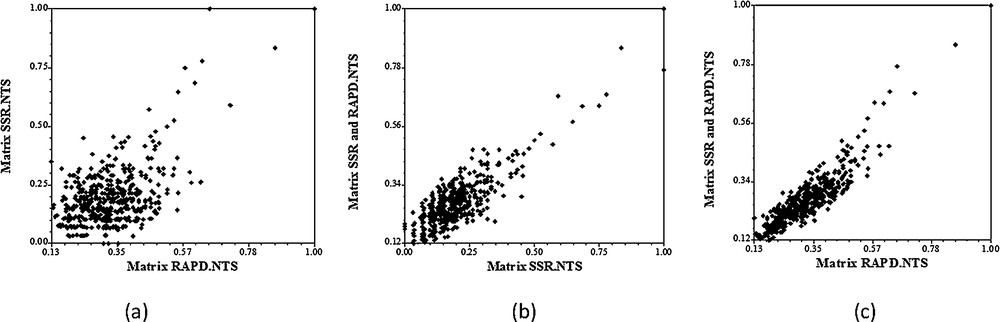
Regression diagrams of the Mantel test between the genetic distances of two molecular markers. (a) Regression between RAPD and SSR; (b) regression between SSR and SSR + RAPD; (c) regression between RAPD and SSR + RAPD.
However, in spite of the relationships and concordance between the three used markers, molecular markers (RAPD-SSR) should not be seen as substitutes for the traditional morphological descriptors. All these marker systems should be considered as complementary tools for providing a more complete understanding of the diversity available in olive genotypes. The lack of consistency between the relationship studies performed with molecular and morphological markers could indicate that each marker system measures different aspects of olive genetic variability [30].
3.6 Comparative levels of polymorphism and discriminating capacity of RAPD and SSR markers
All studied molecular markers proved to be highly effective in discriminating the 32 accessions analyzed. The results obtained are summarized in Table 6. Different levels of expected heterozygosity (He) were observed for RAPD and SSR, which is consistent with results from previous studies carried out on olive cultivars by means of different molecular markers [25,57]. The co-dominant nature of the SSR marker permits the detection of a high number of alleles per locus and contributes to higher levels of expected heterozygosity being reached than would be possible with RAPD [25]. For the SSR markers, the effective number of alleles per locus (Ne) was higher than that noted for RAPD markers. This was reflected in lower values of the expected heterozygosity for both RAPD and AFLP markers. The very low value of the effective number of alleles per locus for SSR markers in comparison to the average number of alleles per locus may be explained by the presence of many unique or low frequent alleles [25].
Levels of polymorphism and comparison of informativeness obtained with RAPD and SSR markers in 32 olive accessions.
| Indexes with their abbreviations | Marker system | ||
| RAPD | SSR | ||
| Number of assay units | U | 10 | 9 |
| Number of polymorphic bands | np | 86 | 66 |
| Number of monomorphic bands | nnp | 6 | 0 |
| Average number of polymorphic bands/assay unit | np/U | 8.6 | 7.3 |
| Number of loci | L | 92 | 9 |
| Number of loci/assay unit | nu | 9.2 | 1 |
| Number of banding patterns | Tp | 179 | 117 |
| Average number of patterns/assay unit | I | 17.9 | 13 |
| Average number of alleles per locus | nav | 2 | 7 |
| Expected heterozygosity of the polymorphic loci | Hep | 0.22 | 0.81 |
| Fraction of polymorphic loci | β | 0.93 | 1.0 |
| Expected heterozygosity | H e | 0.21 | 0.8 |
| Effective number of alleles per locus | ne | 1.28 | 5.4 |
| Total number of effective alleles | Ne | 118 | 48.8 |
| Assay efficiency index | Ai | 11.79 | 5.4 |
| Effective multiplex ratio | E | 8.6 | 1.0 |
| Marker index | MI | 1.89 | 0.81 |
4 Conclusion
All studied morphological and molecular markers showed an important genetic diversity and a high degree of polymorphism among olive accessions, which confirms the historical value of the prospected olive groves. Furthermore, the new prospected olive accessions noted significant differences with the Tunisian cultivar taken as references. This preliminary study can be considered as a first step toward the identification and characterization of new Tunisian cultivars native of the Tunisian Sahel and underline the importance of a further investigation to understand the origin of each gene pool.