

1 Introduction
The increase in petroleum prices has prompted the study and development of renewable fuels worldwide. Currently, the mass production of biodiesel from crop species (canola, soybean and sunflower) on a commercial level is difficult, since many of these species are used for human consumption, and altering their use to include biodiesel production would create a supply chain shortage and a rise in food prices. Jatropha (Jatropha curcas L.) is commonly known as purging nut or physic nut, a perennial deciduous and multipurpose shrub belonging to the family Euphorbiaceae. Primarily Jatropha plant was used for its medicinal values, and in recent years, the seed oil has however gained tremendous significance as a biofuel. There is some controversy about its centre of origin, but Mexico and Central America are considered as the most likely sites. The seeds of J. curcas have an oil content between 31 and 41% [1] and are rich in unsaturated fatty acids that have a good conversion to methyl ester of 90–97% [2,3]. This potential for biodiesel production has propelled J. curcas into cultivation in several countries, like Africa and Southeast Asia, including Zimbabwe, China, India, Mauritania, and the Philippines.
The genetic diversity of J. curcas is largely unknown, but is essential for designing breeding programs and marker-assisted selection. Almost all studies of the genetic diversity of J. curcas have been performed with collections from India [4–6], China [7,8], and Mexico [9]. Although in some cases high variability has been reported [10,11], most studies agree that the germplasm of individuals from these regions has low genetic variability [9]. In this sense, it is likely that there is a prerequisite to create greater genetic diversity in J. curcas by applying conventional breeding techniques, however, with the exception of research using germplasm collections from different regions. Among the conventional breeding techniques, mutation breeding may be suitable for improving the genetic diversity/agronomic traits in crop plants. The mutation breeding in tree species is not considered attractive because of the lacunae in conventional breeding, like lifetime consuming, producing unpredictable results, long juvenile phase, high heterozygosity, and fear in loss of the unique genotype. The studies on induced mutation in tree crops have already been performed, particularly in apple, pear, peach, grapevine, etc. Mutation studies undertaken at the National Botanical Research Institute (NBRI), Lucknow, India, have led to the induction of cotyledonary variabilities in J. curcas [12]. Dwimahyani [13] induced mutation in J. curcas for improvement of its agronomic characters with an irradiation dose of 10 Gy, and have identified mutant plants with early maturity that increased 100-seed weight (30% over control) with better branch growth.
Although such phenotypic evaluations are important, the number of morphological traits is limited, with less understanding at the gene level. This is because most economic character[s] is [are] polygenically inherited and their expression is influenced by environmental conditions. The evaluation of this diversity has been tremendously empowered by invoking biomolecular analytical techniques, like DNA polymorphism profiling, thus facilitating direct and reliable measurements of genetic divergence. The DNA-based markers significantly shorten the evaluation process and eliminate the problematic influence of external factors. The same DNA marker may also be used for identifying genotypes, determining the degree of genetic similarity and even in selecting mutant plants that deliver the most desirable attributes. Although new techniques, like AFLPs and microsatellites (SSR and ISSR), are preferred due to their informativeness, the Random Amplified polymorphic DNA (RAPD) technique is still used because of its simplicity, low cost, and lesser infrastructure requirement. It supports the simultaneous detection of polymorphism at many loci in the entire genome. RAPD is thus a highly effective tool for investigating the genetic diversity of living organisms and it is definitely a very useful technique at the initial stage of mutation breeding in tree species. RAPD method has been used earlier to study the genetic variability induced by mutagenic treatments in Chrysanthemum [14], sugarcane [15], groundnut [16], sunflower [17], cypress [18], and soybean [19]; however, none of these studies assessed the potentiality and characteristic properties of a RAPD marker.
Therefore, the objective of this study is to investigate the total number of bands, the number of polymorphic bands, the polymorphic band percentage, the polymorphism information content (PIC), the effective multiplex ratio (EMR), the marker index (MI), the resolution power (Rp), the qualitative nature of data (QND), the effective marker index (EMI), the genotype index (GI) and Jaccard's similarity coefficient of the RAPD marker technique. This is done to assess the suitability of the random primer to determine the genetic diversity in gamma rays and ethyl methane sulphonate (EMS)-treated J. curcas plants.
2 Materials and methods
2.1 Plant source and mutagenic treatments
Hundred seeds (for each treatment) of J. curcas were presoaked in distilled water for 24 h and control for 32 h. The presoaked seeds were treated with different doses of gamma rays viz., 5, 10, 15, 20 and 25 Kr and EMS viz., 1, 2, 3 and 4%, for 8 h. The treated seeds were sown at 1-cm depth in plastic trays (23 × 27 cm, 6 cm in height) filled with river sand, red soil, and farm yard manure in the ratio of 3:2:1. After a month of germination, 50 plants from each treatment were transferred to polythene bags containing 4 kg of a mixture of river sand, red soil, and farm yard manure in the ratio of 3:2:1, and maintained up to 3 months. Twenty-five plants from each treatment type were then transplanted to the experimental field for further observations.
2.2 DNA isolation
The fresh leaf material was harvested from a one-year-old plant treated with gamma rays and EMS. Genomic DNA was extracted by adopting the CTAB method outlined by Doyle and Doyle [20], with minor modifications. About 0.1 g of leaf tissue was submerged in absolute alcohol [21,22] for 1 h instead of grinding it in liquid nitrogen and put in a 2-mL Eppendorf tube. To grind the sample, 0.5 mL of an extraction buffer [2% cetyl trimethyl ammonium bromide (CTAB), 100 mM Tris–HCl, 1.4 M NaCl, 20 mM ethylene diamine tetra acetic acid (EDTA) di-sodium salt, 0.2 M mercaptoethanol, 1% PVP, pH 8.0] was added and incubated at 65 °C for 60 min. The above sample was extracted with equal volumes of chloroform:isoamylalcohol (24:1) and the supernatant was collected in a new tube and treated with RNase (10 mg/mL) for 30 min at 37 °C. After the incubation period, 3 M sodium acetate and absolute alcohol were added to the mixture and it was again incubated at 20 °C for 1 h. The mixture was centrifuged at 3000 rpm for 5 min. The pellet was air-dried and dissolved in 100 μL of Milli-Q water. The genomic DNA isolated was quantified spectrometrically by measuring its absorbance at 260 nm. DNA was then diluted to make a working solution for RAPD marker analysis.
2.3 RAPD marker analysis and documentation
RAPD-PCR amplification was performed thrice for each primer (21) to ensure their reproducibility in a total volume of 25 μL containing 20 mM of Tris–Cl (pH 8.4), 50 mM of KCl, 200 μM of each dNTP's (Sigma-Aldrich, Bangalore, India), 2 mM of MgCl2, 0.8 μM of primer (Sigma–Aldrich, Bangalore, India), 100 ng of template DNA and 0.5 U Taq DNA polymerase (Sigma–Aldrich, Bangalore, India) in an Eppendorf Master Cycler personal (AG22331 Hamburg, Germany) device, which was programmed to include predenaturation at 94 °C for 1 min, followed by 40 cycles of denaturation at 94 °C for 1 min, annealing at 35 °C for 1 min and extension at 72 °C for 1 min. The final cycle was allowed an additional 5-min period of extension at 72 °C. The PCR products were analysed by electrophoresis through a 2% agarose gel in 1 × TBE buffer. After electrophoresis, the gel was stained in ethidium bromide and then visualized, the images were photographed using Biorad Gel Documentation System.
2.4 Data scoring and analysis
Data of RAPD marker analysis were scored as discrete variables, using “1” to indicate the presence and “0” to indicate the absence of bands for each primer. The binary data so generated were used to estimate the levels of polymorphism by dividing the polymorphic bands by the total number of scored bands × 100.
2.5 Statistical analysis
To determine which ones of the RAPD primer were the most informative, the following parameters proposed by Laurentin and Karlovsky [23] were calculated: polymorphism information content (PIC), effective multiplex ratio (EMR), marker index (MI), resolution power (Rp), qualitative nature of data (QND), effective marker index (EMI), and genotype index (GI).
The PIC value for each primer was calculated as proposed by Roldan-Ruiz et al. [24]: PICi = 2ƒi (1 – ƒi), where PIC is the polymorphism information content of the marker i, ƒi is the frequency of marker fragments that were present and 1 – ƒi is the frequency of marker fragments that were absent.
The number of loci polymorphism in the genotype set of interest analysed per experiment, called effective multiplex ratio (EMR), was estimated as EMR = η·β; where EMR is the effective multiplex ratio, which is defined as the product of the total number of loci/fragments per primer (η) and the fraction of polymorphic loci/fragments (β).
The marker index (MI) was calculated by using the formula described by Varshney et al. [25]: MI = PIC × EMR. The resolving power (Rp) of each primer was calculated according to Prevost and Wilkinson [26]: Rp = ΣIb, where Ib represents fragments’ informativeness. The Ib can be represented on a 0–1 scale using the following formula: Ib = 1–[2× (0.5 – P)], where P is the proportion of the 10 genotypes containing the fragment.
To provide an index for the molecular marker that includes additional information on the practical applicability of a marker system to the researchers and scientists, we propose a term called the qualitative nature of data (QND). The QND depends on many factors, such as reproducibility and amenability of peaks/bands for easy documentation (e.g., precise allele sizing and storing in databases) and is defined as QND = DC × QM × PR, where DC is the documentation capability, QM is the quality of marker and PR is the percent reproducibility of the fragment(s)/band(s)/peak(s) of the given marker system across the laboratories. DC and PR represent the constant value for a given marker type; however, QM is a feature of the primer pair for a marker type and its value is variable. The constant values for DC and RP for RAPD marker have been set as 0.75 and 1.00, respectively. The QM value, however, will vary with the primer pair, even for a given marker type. Therefore, the user needs to define the QM value as per the experiments according to following scale:
- • 1.00 – good quality–single and strong band/peak;
- • 0.75 – faint band or lower peak;
- • 0.50 – marker/band with stuttering;
- • 0.25 – difficult to score (needs special efforts to visualize).
The effective marker index (EMI), a possible measure to evaluate the overall utility of a marker system considering all the parameters mentioned above, can be calculated as follows: EMI = MI × QND. The genotype index (GI) of a primer represents the proportion of the lines actually distinguished by the primer, i.e. the number of lines exhibiting unique fingerprints in comparisons divided by total number of lines analysed [27].
3 Results
In our research, differences among the mutants improved by applying radiation and chemicals to J. curcas were screened using RAPD primer from the view of polymerizing as comparison. Twenty-one random primers (Table 1) were selected for amplification and the data were analysed for identifying genetic diversity in gamma rays and EMS treated plants.
List of random primers generating RAPD-PCR products in gamma rays and EMS treated J. curcas plants.
| S. No. | Primer name | Sequence (5′–3′) | Tm (°C) | GC content (%) |
| 1. | OPU-13 | GGCTGGTTCC | 35 | 70 |
| 2. | OPAK-14 | CTGTCATGCC | 35 | 60 |
| 3. | OPA-4 | AATCGGGCTG | 35 | 60 |
| 4. | OPT-18 | CATGCCAGAC | 35 | 60 |
| 5. | OPAL-11 | GTCACGTCCT | 35 | 60 |
| 6. | OPM-14 | AGGGTCGTTC | 35 | 60 |
| 7. | OPH-12 | GGGACGTTGG | 35 | 70 |
| 8. | OPF-13 | GGCTGCAGAA | 35 | 60 |
| 9. | OPAM-06 | TGGCGGTTTG | 35 | 60 |
| 10. | OPAB-11 | GTGCGCAATG | 35 | 60 |
| 11. | OPAW-12 | GAGCAAGGCA | 35 | 60 |
| 12. | OPF-01 | ACCGATCCTG | 35 | 60 |
| 13. | OPT-12 | GGGTGTGTAG | 35 | 60 |
| 14. | OPT-13 | GGGGTTGCCA | 35 | 70 |
| 15. | OPAW-09 | ACTGGGTCGG | 35 | 70 |
| 16. | OPAW-13 | CTACGATGCC | 35 | 60 |
| 17. | OPF-02 | GAGGATCCCT | 35 | 60 |
| 18. | OPF-03 | CCTGATCACC | 35 | 60 |
| 19. | OPF-04 | GGTGATCAGG | 35 | 60 |
| 20. | OPD-04 | TCTGGTGAGG | 35 | 60 |
| 21. | OPD-05 | TGAGCGGACA | 35 | 60 |
3.1 RAPD analysis
A total of 147 bands were scored, out of which 96 were polymorphic. The number of bands generated per primer varied from 3 to 10. A minimum of 3 bands were generated by the primers; OPM-14 and OPAW-13, while the maximum of 10 bands were scored with OPF-13 followed by OPU-13, OPAM-06, OPAW-09 and OPD-05, which produced 9 bands each. The percentage of polymorphism was found to range from 0.00 to 100%. The primer OPH-12 showed 100% polymorphism since the bands produced by it were all polymorphic. No polymorphic bands were observed by the primer OPF-02, which produced only monomorphic bands across the ten mutants (Table 2).
Details on RAPD analysis, including TNB, NPB, PB (%), PIC, EMR, MI, Rp, QND, EMI and GI.
| S. No. | Primer name | TNB | NPB | PB (%) | PIC | EMR | MI | Rp | QND | EMI | GI |
| 1. | OPU-13 | 9 | 8 | 88.88 | 0.437 | 72 | 31.46 | 10.80 | 0.75 | 23.59 | 0.11 |
| 2. | OPAK-14 | 6 | 3 | 50.00 | 0.333 | 18 | 05.99 | 10.20 | 0.37 | 02.21 | 0.50 |
| 3. | OPA-4 | 5 | 2 | 40.00 | 0.250 | 10 | 02.50 | 08.80 | 0.56 | 01.40 | 0.60 |
| 4. | OPT-18 | 8 | 5 | 62.50 | 0.400 | 40 | 16.00 | 13.20 | 0.75 | 12.00 | 0.37 |
| 5. | OPAL-11 | 8 | 6 | 75.00 | 0.416 | 48 | 19.97 | 12.80 | 0.75 | 14.97 | 0.25 |
| 6. | OPM-14 | 3 | 2 | 66.66 | 0.250 | 06 | 01.50 | 04.40 | 0.56 | 00.84 | 0.33 |
| 7. | OPH-12 | 5 | 5 | 100.00 | 0.400 | 25 | 10.00 | 07.20 | 0.56 | 05.60 | 0.00 |
| 8. | OPF-13 | 10 | 8 | 80.00 | 0.437 | 80 | 34.96 | 16.80 | 0.56 | 19.57 | 0.20 |
| 9. | OPAM-06 | 9 | 5 | 55.55 | 0.400 | 45 | 18.00 | 14.00 | 0.56 | 10.08 | 0.44 |
| 10. | OPAB-11 | 8 | 7 | 87.50 | 0.428 | 56 | 23.96 | 13.60 | 0.37 | 08.86 | 0.12 |
| 11. | OPAW-12 | 6 | 5 | 83.33 | 0.400 | 30 | 12.00 | 07.80 | 0.37 | 04.44 | 0.16 |
| 12. | OPF-01 | 8 | 4 | 50.00 | 0.375 | 32 | 12.00 | 14.20 | 0.75 | 04.44 | 0.50 |
| 13. | OPT-12 | 6 | 5 | 83.33 | 0.400 | 30 | 12.00 | 08.20 | 0.56 | 09.00 | 0.16 |
| 14. | OPT-13 | 8 | 5 | 62.50 | 0.400 | 40 | 16.00 | 14.40 | 0.75 | 08.96 | 0.37 |
| 15. | OPAW-09 | 9 | 5 | 55.55 | 0.400 | 45 | 18.00 | 14.20 | 0.75 | 13.50 | 0.44 |
| 16. | OPAW-13 | 3 | 1 | 33.33 | 0.000 | 03 | 00.00 | 05.20 | 0.56 | 00.00 | 0.66 |
| 17. | OPF-02 | 5 | 0 | 00.00 | 0.000 | 00 | 00.00 | 10.00 | 0.56 | 00.00 | 1.00 |
| 18. | OPF-03 | 8 | 4 | 50.00 | 0.375 | 32 | 12.00 | 13.80 | 0.75 | 09.00 | 0.50 |
| 19. | OPF-04 | 7 | 5 | 71.42 | 0.400 | 35 | 14.00 | 10.40 | 0.37 | 05.18 | 0.28 |
| 20. | OPD-04 | 7 | 4 | 57.14 | 0.375 | 28 | 10.50 | 10.80 | 0.37 | 03.88 | 0.43 |
| 21. | OPD-05 | 9 | 7 | 77.77 | 0.428 | 63 | 26.96 | 14.80 | 0.56 | 15.09 | 0.28 |
| Total | 147 | 96 | 1197 | 7.304 | 738 | 298 | 235 | 12.14 | 172.61 | 7.70 | |
| Mean | 7.00 | 4.57 | 57.00 | 0.347 | 35.14 | 14.19 | 11.19 | 0.5780 | 08.21 | 0.36 |
To identify the most informative RAPD primers, we calculated the polymorphism information content (PIC) for each primer; PIC was ranged from 0.00 to 0.437, with an average of 0.347. The primers OPF-02 and OPAW-13 detected no polymorphism information content, as the number of polymorphic bands was in the range from 0.00 to 1.00. The effective multiplex ratio (EMR) ranged from 0.00 to 80, with an average of 35.14 per primer. The primer OPF-13 had the highest EMR value (80), while OPAW-13 had the lowest (03). No EMR value was observed for the primer OPF-02. A similar trend was also observed for the marker index (MI). The MI is a feature of a marker and therefore it was calculated for all random primer. The MI ranged from 0.00 to 34.96, with an average of 14.19. The primer OPF-13 had the highest MI value, while the primer OPM-14 had the lowest. A positive and significant correlation was observed between PIC and MI (r = 0.731, P > 0.01), and EMR and MI (r = 0.998, P > 0.01). To evaluate the discriminatory power of the RAPD marker, the resolving power (Rp) was calculated; it ranged from 4.40 to 16.80, with an average of 11.19. The primer OPF-13 had the highest Rp value, while OPM-14 had the lowest. There was a positive and significant correlation between MI and Rp (r = 0.711, P > 0.01).
Here, we propose another important issue for molecular marker, which is the qualitative nature of data produced by RAPD marker. Based on the assumptions and weightages mentioned under § Materials and methods, the QND for RAPD marker was of 0.75 as the highest value and 0.37 as the lowest among the twenty-one primers. The effective marker index (EMI) was considered for all possible attributes, such as polymorphism information content, fraction of polymorphic bands, effective multiplex ratio as well as the QND for RAPD marker. According to our calculations, the EMI was the highest (26.22) for the primer OPF-13 followed by OPU-13, OPD-05, and OPAL-11, which recorded 23.59, 15.09 and 14.97, respectively. The lowest EMI (0.55) was observed in the primer OPM-14, while it was found to be zero for primers OPAW-13 and OPF-02. Highly positive and significant correlations were observed between MI and EMI. The genotype index (GI), which was used to discriminate the control and the mutants, was ranged from 0.00 to 1.00, with an average of 0.36. The primer OPF-02 had the highest value (1.00) and OPH-12 had the lowest (0.00) (Table 2).
3.2 Genetic relationship
The genetic similarity based on RAPD data ranged from 0.559 to 1.000, with an overall mean of 0.712 (Table 3). All the mutants/treatments revealed the maximum genetic diversity with combination of control. The dendrogram obtained from UPGMA analysis of genetic similarity based on the RAPD marker is presented in Fig. 1. The dendrogram shows the formation of three main groups of mutants. Moreover, although the mutants from a similar treatment were dispersed throughout the dendrogram, the results were consistent with a lack of grouping tendency by the concentrations of gamma rays and EMS. The dendrogram indicated three distinct clusters, one comprising six treatments viz., control, 10 Kr, 15 Kr, 20 Kr, 2% EMS and 3% EMS, while second and third clusters included two treatments each viz., 5 Kr and 1% EMS, and 25 Kr and 4% EMS, respectively indicating their higher genetic distinctness from other treatments of gamma rays and EMS. According to the dendrogram obtained, 25 Kr, 4% EMS, 5 Kr and 1% EMS were more distant to control than other treatments.
Jaccard's similarity matrix among the gamma rays and EMS treated plants of J. curcas.
| Control | 5 Kr | 10 Kr | 15 Kr | 20 Kr | 25 Kr | 1% EMS | 2% EMS | 3% EMS | 4% EMS | |
| Control | 1.000 | |||||||||
| 5 Kr | 0.664 | 1.000 | ||||||||
| 10 Kr | 0.844 | 0.737 | 1.000 | |||||||
| 15 Kr | 0.801 | 0.671 | 0.886 | 1.000 | ||||||
| 20 Kr | 0.797 | 0.664 | 0.830 | 0.881 | 1.000 | |||||
| 25 Kr | 0.681 | 0.643 | 0.671 | 0.664 | 0.659 | 1.000 | ||||
| 1% EMS | 0.640 | 0.805 | 0.702 | 0.647 | 0.664 | 0.592 | 1.000 | |||
| 2% EMS | 0.778 | 0.647 | 0.851 | 0.821 | 0.778 | 0.628 | 0.692 | 1.000 | ||
| 3% EMS | 0.758 | 0.618 | 0.805 | 0.840 | 0.823 | 0.644 | 0.640 | 0.886 | 1.000 | |
| 4% EMS | 0.659 | 0.559 | 0.638 | 0.631 | 0.647 | 0.677 | 0.606 | 0.654 | 0.659 | 1.000 |
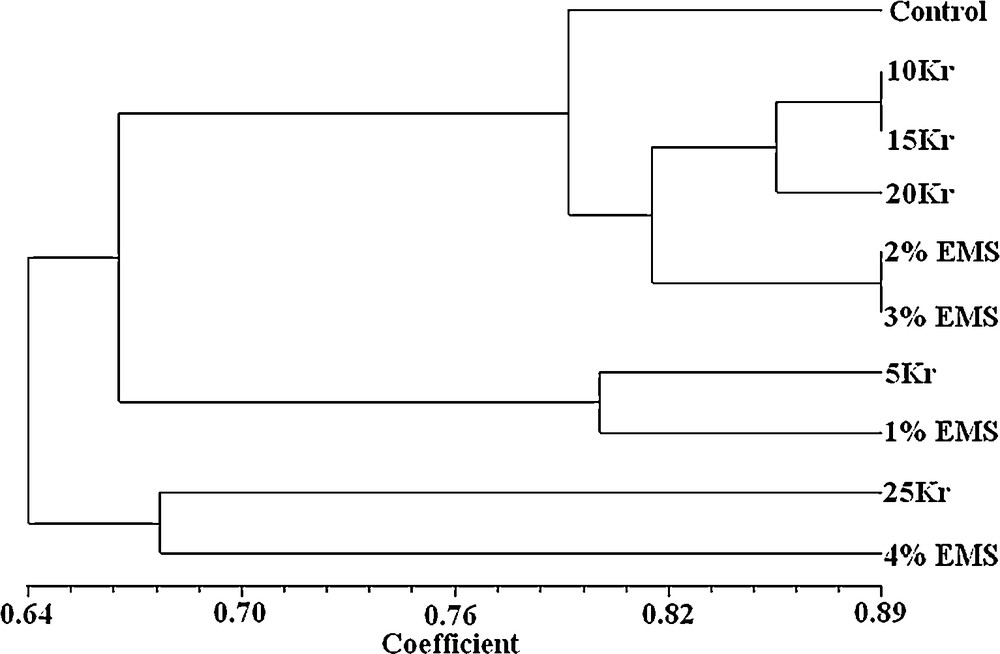
Dendrogram derived from a UPGMA cluster analysis using Jaccard's similarity coefficients of J. curcas, showing the clustering of 10 mutants (control, 5 Kr, 10 Kr, 15 Kr, 20vKr, 25 Kr, 1% EMS, 2% EMS, 3% EMS, and 4% EMS).
4 Discussion
A great number of DNA markers, such as AFLP, SSR, SNP, RAPD and ISSR have been developed to assess the genetic diversity in plants, both in wild and cultivated species. Assessment of genetic diversity by using molecular markers is important not only for crop improvement but also for efficient management and conservation of genetic resources in plant GenBank® [28]. Therefore, the selection of a particular type of molecular marker is important and critically depends on the intended use [29]. Although the most common use of the RAPD marker analysis is related to genetic mapping, taxonomic and phylogenetic studies, the method has also been used to detect DNA alternation and mutation [30]. In this study, the RAPD marker was used to evaluate the genetic diversity among the mutants induced by different doses of gamma rays and EMS in J. curcas. The results of this study will be useful for the establishment of a conventional breeding program, since it will ease to obtain the information about further selection of diverse genotype obtained by induced mutagenesis, with increased genetic variability or gain advantage of heterosis.
4.1 Polymorphism in gamma rays and EMS treated plants
In the present study, the polymorphism in genomic DNA was detected by RAPD profiles through the randomly primed PCR reactions. In this sense, the obvious disappearance of normal bands and the appearance of new bands were observed for all primers from the plants exposed to different doses of gamma radiation and EMS compared to the untreated control. It is suggested that DNA damage may be serious in the majority of the cells in the plant parts of J. curcas treated with gamma rays and EMS. The disappearance of normal bands (loss of bands) may be related to the event, such as DNA damage (e.g., single and double-strand breaks, modified bases, abasic sits, oxidized bases, and bulky adducts), DNA-protein cross links, point mutation, and complex chromosomal rearrangements induced by gamma radiation and EMS. When Taq DNA polymerase encounters a DNA adduct, there are a number of possible outcomes, including blockage, bypass and the possible dissociation of the enzyme/adduct complex, which may cause the loss of bands [31].
The appearance of new PCR products (extra bands) was also detected in RAPD profiles. New PCR amplification products may reveal a change in some oligonucleotide priming sites due to mutations [new annealing event(s)], large deletions (bringing to pre-existing annealing site closer), and homologous recombinations (juxtaposing two sequences that match the sequences of primer) [32]. Atienzar et al. [33] reported that mutations could only be responsible for the appearance of new bands if they occurred at the same locus in a sufficient number of cells (a minimum of 10% of mutations may be required so that a new PCR product can be visible in agarose gel). The new bands could be attributed to mutation, while the disappearance of bands could be attributed to DNA damage [31], both of them resulting in the generation of genetic diversity in the gamma-ray- and EMS-treated plants.
4.2 Discriminatory power of RAPD marker
As the PIC provides a measure that is influenced by the number and frequency of alleles, the maximum PIC for a RAPD marker is 0.5, since two alleles per locus are assumed in RAPD analysis. As mentioned earlier, we found higher PIC value (0.437) for the bands that were detected in 70–80% of mutant populations. The RAPD markers examined in this study were found to have a mean polymorphism information content (PIC) of 0.347, a marker index (MI) of 14.19, an effective marker index (EMI) of 8.21 and a genotype index (GI) of 0.36; suggesting that there was greater genetic diversity in J. curcas treated with gamma rays and EMS. This is comparable to the earlier studies with other biallelic marker like AFLP in soybean (PIC = 0.32, MI = 6.14) [34], wheat (PIC = 0.32, MI = 3.41) [35], cornsalad (PIC = 0.25, MI = 4.45) [36], etc. The MI was the highest for the primers OPF-14 (34.96) and OPU-13 (31.46) and the lowest for OPM-14 (1.50) and OPA-4 (2.50). Of course, the high MI of the RAPD assay derived from its high effective multiplex ratio rather than from high levels of detected polymorphism. As a large number of fragments were detected in the gel lane by using a number of random primers, the RAPD marker had a higher multiplex ratio. The multiplex ratio, however, depends on the fraction of polymorphic bands with as many of the fragments obtained by the primer are monomorphic across the examined genotypes. This feature makes the RAPD marker suitable for fingerprinting or estimating genetic diversity in the breeding populations [37]. In order to assess the discriminatory power of a biallelic marker, Prevost and Wilkinson [26] used the new attribute-resolving power (Rp). The primers used in this study showed Rp values in the range from 4.40 to 16.80 (mean 11.19). As Prevost and Wilkinson [26] and Fernandez et al. [38] observed a strong and linear relationship between the ability of a primer to distinguish genotypes and Rp, the primer with the highest Rp value should be the most informative primer for distinguishing the genotypes.
Genotyping of complete or a significant proportion of the GenBank® collections provides means to improve the management of plant genetic resources in manifold ways [28]. In this context, storing and managing genotyping data of mutant plants obtained by using molecular markers are important. In view of this, we introduced the concept of the QND and effective marker index (EMI). The QND is the more important measure for the researchers and scientists as they likely have at their disposal a genotyping data on their material that can be documented and handled easily in their database. As the QND for RAPD marker ranges from 0.37 to 0.75, we recommend the utilization of RAPDs for genotyping the mutant plants. RAPD genotyping data can be documented in a digital fashion or binary format (0–1 matrix) across different genotypes and thus, it is very convenient to store it in the GenBank® database. In present study, a very strong and positive correction was observed between EMI and MI, (r = 0.936, P > 0.01) and Rp and MI (r = 0.711, P > 0.01). The PIC, MI, Rp, EMI, and GI could be used to evaluate markers so that the most appropriate could be selected for genetic mapping, phylogenetic analysis and association genetics [6,9,23,25,26,38–41].
4.3 Genetic relationship
The similarity index serves to ascertain the degree of genetic relatedness among the mutants; 5 Kr and 4% EMS mutants were most distantly related with the lowest similarity index value (0.559), while 10 Kr and 15 Kr mutants of gamma rays, and 2% EMS and 3% EMS mutants were most closely related, having a value of 0.886. With phenetic numerical analysis, the dendrogram constructed based on UPGMA analysis of RAPD data is one of the most effective methods in numerical computation and it can show the relationships between all samples [42]. In this sense, the phenetic approach differs from the genetic one in that the RAPD profile is not considered as genotypes. In the present study, when markers were obtained at the end of the RAPD analysis done in the plant treated with gamma rays and EMS, they were examined, and it was seen that there was a potential diversity between mutants and control. In the dendrogram done based on RAPD markers, the genetic distance to control and mutants replying to gamma radiation and EMS treatments in different doses in particular 25 Kr and 4% EMS, and 5 Kr and 1% EMS were rather different.
Atak et al. [19] found that there was a potential polymorphism and improvement between mutants and control, while they determined the differences among mutants applying to various doses of atrazine and radiation in soybean varieties with the RAPD marker. The RAPD markers, which can quickly detect a large number of genetic polymorphisms, have led to the creation of genetic maps in a number of woody fruit crops [43] and sunflower [17], including changes due to DNA damage, and thus, the RAPD marker can be used to detect mutation and DNA damage [44].
Polymerase chain reaction (PCR)-based techniques using RAPD markers are now widely adopted in plant systematics, population biology and conventional breeding approaches to solve discrepancies in species identifications, their classification as well as their hierarchical positions [45,46]. The banding patterns generated by RAPD markers remain the same, irrespective of the developmental stage of the plant [47]. In spite of their wide usage, RAPD markers have a few disadvantages. One is their sensitivity to change in reaction conditions, which might lead to differences in results from different laboratories. This could be prevented through the standardization of DNA isolation techniques and of PCR reaction conditions. During the course of this study, PCR amplifications were carried out 3–4 times using two different thermocyclers to ensure the repeatability of the banding patterns. Despite negative arguments regarding the use of the RAPD marker for plant genetic diversity studies, several comparative studies between allozymes, RAPD, AFLP, SSR and ISSR were carried out by Sun and Wong [48] and Kjolner et al. [49], who found that RAPD markers have an analytical efficiency similar to that observed in the other approaches. Therefore, their use for such studies is still acceptable.
5 Conclusion
RAPD being the dominant tool allowing one to detect multiple loci distributed throughout the genome, it is hence strongly preferred for studying genetic variations in tree species. The results of the present study pave the way to marker-assisted selection in the mutation breeding technique in J. curcas, which leads to a significant increase in seed yield production with early flowering genotypes within a short period of time, which will be the key factor in reducing production costs and avoiding the loss that occur in the late growing season. This is the first report on molecular characterization of induced mutagenesis through gamma irradiation and EMS using RAPD marker analysis in J. curcas. Our data support the view that the RAPD markers are a highly suitable method for the detection of DNA polymorphism/genetic divergence induced by gamma rays and EMS, as they have higher MI, Rp, and EMI. The RAPD marker-generated genetic variation among control and treated populations will help us to distinguish the plants showing differences in morphological characters (data not shown).
Acknowledgements
The authors are thankful to the University Grant Commission (UGC), New Delhi, India for providing funds for the present study. We also thank the authorities of Annamalai University for having provided laboratory facilities and encouragements.