

1 Introduction
Citrus (Rutaceae) is among the most important ancient cultivated fruits in the world, with a long history of cultivation worldwide, extending back to at least 2100 BC [1]. Nowadays, it is among the most important fruit trees in the world, with an annual production of approximately 1.02 hundred million tons [2]. Brazil, the Mediterranean Basin, the USA and China are the leading producing regions [3].
The genus Citrus grouped a number of species considered as major fruit crops in the world with global availability and popularity [4]. Southeastern Asia is believed to be the site of origin of most important Citrus types and its major center of domestication and diversity. Thus, citriculture could have started in this area and expanded progressively in all directions. In addition to the genus Citrus, Fortunella and Poncirus have played a relevant role in the evolution of citriculture [5].
The first classification of the genus Citrus was presented by Swingle and Reece [6] who proposed 16 species. Later, Tanaka [7] recognized 162 species in the genus Citrus. However, Scora [8] and Barrett and Rhodes [9] suggested that there are only three basic true species within this genus (citron: Citrus medica L., mandarin: Citrus reticulata Blanco and pummel: Citrus maxima [Burm] Merrill). All the other species are considered to be originated from hybridization between these ancestral species, species of subgenus Papeda or closely related genera. According to Nicolosi et al. [10], due to sexual compatibility between Citrus and related genera, the high frequency of bud mutations and the long history of cultivation and wide dispersion, Citrus phylogeny is very complicated, controversial, and sometimes confusing.
The emergence and the predominance of molecular techniques present a useful tool to increase our understanding about the distribution and extent of genetic variation within and between plant species [11,12]. Among the different molecular markers, microsatellites markers have been used extensively in the assessment of genetic diversity [13–15] genome mapping [16], phylogenic studies [15,17] for Citrus species thanks to their reproducibility, high polymorphism, randomly dispersion throughout the plant genome and co-dominance. According to Kalinowski and Taper [18], microsatellite loci are still the markers of choice to estimate the evolutionary and genealogical relationships among plant germplasms.
Tunisia, a Mediterranean country, is well known for its production of citrus fruits, especially in littoral and sub-humid areas. This crop appeared to be introduced in Tunisia during the 10th century. Since, due to the settlement of many populations and civilizations, the Tunisian local Citrus germplasm evolved through the various historical times until today and present important variability and diversification regarding the number of species, varieties and fruit qualities [19]. In this study, a set of informative nuclear simple sequence repeat markers (nSSR) were used to genotype eight Citrus species represented by 40 accessions growing in Tunisia. Based on the studied sample, our main objectives were to evaluate the status of genetic structure and phylogenetic relationships among Tunisian Citrus species. Furthermore, we address the question about the amount of gene flow among the investigated gene pools.
2 Materials and methods
2.1 Plant materials and DNA extraction
In this study, a total of forty accessions belonging to eight Citrus species were provided from the germplasm collection of Technical Citrus Centre (CTA) in Cap Bon (Table 1). Young leaves were collected, frozen in liquid nitrogen and stored at –80 °C until DNA isolation. Genomic DNA was extracted from leaf tissue in accordance with the method described by Bowers et al. [20] and modified by Zoghlami et al. [21].
List of Citrus accessions investigated in this study and their related species.
| No. | Accession name | Group | Species |
| 1 | Moroccan Sour Orange 1 | Sour orange | Citrus aurantium L. |
| 2 | Moroccan Sour Orange 2 | Sour orange | Citrus aurantium L. |
| 3 | Moroccan Sour Orange 3 | Sour orange | Citrus aurantium L. |
| 4 | Bigaradier Gou Tou 1 | Sour orange | Citrus aurantium L. |
| 5 | Bigaradier Gou Tou 2 | Sour orange | Citrus aurantium L. |
| 6 | Bigaradier Gou Tou 3 | Sour orange | Citrus aurantium L. |
| 7 | Sour Orange 1 | Sour orange | Citrus aurantium L. |
| 8 | Sour Orange 2 | Sour orange | Citrus aurantium L. |
| 9 | Sour Orange 3 | Sour orange | Citrus aurantium L. |
| 10 | Madame Vinous Sweet Orange 1 | Sweet orange | Citrus sinensis (L.) Osbeck |
| 11 | Madame Vinous Sweet Orange 2 | Sweet orange | Citrus sinensis (L.) Osbeck |
| 12 | Madame Vinous Sweet Orange 3 | Sweet orange | Citrus sinensis (L.) Osbeck |
| 13 | Pomelo Duncan 1 | Grapefruit | Citrus paradisi Macf. |
| 14 | Pomelo Duncan 2 | Grapefruit | Citrus paradisi Macf. |
| 15 | Pomelo Duncan 3 | Grapefruit | Citrus paradisi Macf. |
| 16 | Mexican Lime 1 | Lime | Citrus aurantifolia (Christm.) Swing. |
| 17 | Mexican Lime 2 | Lime | Citrus aurantifolia (Christm.) Swing. |
| 18 | Mexican Lime 3 | Lime | Citrus aurantifolia (Christm.) Swing. |
| 19 | Carrizo Citrange 1 | Citrange | Citrus insitorum |
| 20 | Carrizo Citrange 2 | Citrange | Citrus insitorum |
| 21 | Linkov Citrange 1 | Citrange | Citrus insitorum |
| 22 | Linkov Citrange 2 | Citrange | Citrus insitorum |
| 23 | Swingle Citrumelo 1 | Citrange | Citrus insitorum |
| 24 | Swingle Citrumelo 2 | Citrange | Citrus insitorum |
| 25 | Swingle Citrumelo 3 | Citrange | Citrus insitorum |
| 26 | Troyer Citrange 1 | Citrange | Citrus insitorum |
| 27 | Troyer Citrange 2 | Citrange | Citrus insitorum |
| 28 | Troyer Citrange 3 | Citrange | Citrus insitorum |
| 29 | Citrus Volkameriana 1 | Lemon | Citrus limon (L.) Burm. |
| 30 | Citrus Volkameriana 2 | Lemon | Citrus limon (L.) Burm. |
| 31 | Citrus Volkameriana 3 | Lemon | Citrus limon (L.) Burm. |
| 32 | Rough Lemon 1 | Rough Lemon | Citrus limon (L.) Burm. |
| 33 | Rough Lemon 2 | Rough Lemon | Citrus limon (L.) Burm. |
| 34 | Rough Lemon 3 | Rough Lemon | Citrus limon (L.) Burm. |
| 35 | Citrus Medica 1 | Citron | Citrus medica L. |
| 36 | Citrus Medica 2 | Citron | Citrus medica L. |
| 37 | Citrus Medica 3 | Citron | Citrus medica L. |
| 38 | Cleopatra Mandarin 1 | Mandarin | Citrus reticulata Blanco |
| 39 | Cleopatra Mandarin 2 | Mandarin | Citrus reticulata Blanco |
| 40 | Cleopatra Mandarin 3 | Mandarin | Citrus reticulata Blanco |
2.2 SSR analysis
In order to genotype the investigated accessions, 15 SSR pair primers were chosen for their amplification capacity and polymorphism (Table 2). Each 25-μL PCR reaction contained 100 ng DNA, 1.5 U of Taq polymerase, 5 μL of PCR buffer 5X, 2.5 mM of MgCl2, 0.2 mM of dNTPs, 0.5 μM of SSR forward and reverse primer. PCR reactions were performed in Veriti 96-well thermal cycler programmed at 95 °C for 60 s, then 35 cycles of 94 °C for 45 s, 56 °C for 45 s (TAA15, TAA41, CAC23, ATC09) and 58 °C for 75 s (for the remaining primers) and 72 °C for 75 s, ending with 72 °C for 7 min. The separation of PCR products was carried out by electrophoresis on a 2.6% agarose gel. The size of the amplified fragments was estimated using the 100-pb DNA ladder.
List and characteristics of the investigated SSR loci.
| No. | Locus | Repeat | Forward primer | Reverse primer | Size range (pb) |
| 1 | TAA-15 | TAA | GAAAGGGTTACTTGACCAGGC | CTTCCCAGCTGCACAAGC | 130–175 |
| 2 | TAA-27 | TAA | GGATGAAAAATGCTCAAAATG | TAGTACCCACAGGGAAGAGAGC | 248–290 |
| 3 | TAA-41 | TAA | AGGTCTACATTGGCATTGTC | ACATGCAGTGCTATAATGAATG | 100–118 |
| 4 | CAC-23 | CAC | ATCACAATTACTAGCAGCGCC | TTGCCATTGTAGCATGTTGG | 180–220 |
| 5 | CAC-15 | CAC | TAAATCTCCACTCTGCAAAAGC | GATAGGAAGCGTCGTAGACCC | 130–185 |
| 6 | CAC-33 | CAC | GGTGATGCTGCTACTGATGC | CAATTGTGAATTTGTGATTCCG | 155–200 |
| 7 | CAC-39 | CAC | AGAAGCCATCTCTCTGCTGC | AATTCAGTCCCATTCCATTCC | 120–200 |
| 8 | CAT-01 | CAT | GCTTTCGATCCCTCCACATA | GATCCCTACAATCCTTGGTCC | 180–230 |
| 9 | ATC-09 | ATC | TTCCTTATGTAATTGCTCTTTG | TGTGAGTGTTTGTGCGTGTG | 100–180 |
| 10 | AG-14 | AG | AAAGGGAAAGCCCTAATCTCA | CTTCCTCTTGCGGAGTGTTC | 142–180 |
| 11 | CT-21 | CT | CGAACTCATTAAAAGCCGAAAC | CAACAACCACCACTCTCACG | 148–220 |
| 12 | TC-26 | TC | CTTCCTCTTGCGGAGTGTTC | GAGGGAAAGCCCTAATCTCA | 80–160 |
| 13 | CT-19 | CT | CGCCAAGCTTACCACTCACTAC | GCCACGATTTGTAGGGGATAG | 130–190 |
| 14 | SCM-02 | GT | GAATGGCTTAGATGACAAA | ATTCACAAACGAAACACT | 100–155 |
| 15 | SCM-05 | GA | CAGCTACTATCAGAAAAATAATCAG | GCACAAAGAGAAAAAGGC | 125–192 |
2.3 Data analysis
Various genetic parameters for the 40 accessions over the 15 SSR studied loci were calculated. The GENETIX 4.02 computer package [22] was used to calculate the number of alleles (An) per locus, the effective allelic number (Ae) per locus according to Weir [23], the index of gene diversity also called as expected heterozygosity He, the observed heterozygosity Ho and the mean number of alleles per locus (MNA). The mean number of genotypes (Gn) was measured from the matrix genotype/locus. Probability of identity per locus (PI) [24] representing the probability of genotyping randomly two identical individuals was calculated using software Identity 4.0 [25], which was used to determine the frequency of null alleles (r) estimated from the heterozygous deficit [26].
In order to visualize the partition of the total genetic diversity (HT), the within-species genetic diversity (HS) and the relative amount of the between-species genetic diversity (GST) were calculated following the unbiased method [27] using GENETIX 4.02 software [22]. The program GENEPOP [28] was used to quantify and test the relative amount of differentiation among the studied Citrus species using pairwise FST [29] according to Weir and Cockerham [30]. To estimate the gene flow among the species, pairwise Nm values [31] were calculated using the formula: Nm = ¼ (1–FST)/FST applying GENETIX 4.02 software [22]. The software DARwin 5 [32] was used to calculate the dissimilarity from allelic data and to build a phylogenetic tree applying the Unweighted Neighbour Joining method to visualize genetic relationships and classify the analyzed citrus accessions. The significance of each node was evaluated by bootstrapping data for 1000 replications of the original matrix.
3 Results and discussion
3.1 Genetic diversity analysis
Genetic diversity analysis among the studied accessions representing eight Citrus species was elucidated based on different genetic parameters. The 15 applied SSR loci generated a total of 168 alleles with a mean of 11.20 alleles per locus (Table 3). In comparison with previous reports concerning Citrus samples, this level is comparable to results by Barkley et al. [33], but considerably higher than the levels reported by Hussein et al. [34] (5.75), El-Mouei et al. [13] (4.8), Elcy et al. [35] (5.22), Hamza [36] (4.62) and Shahzadi et al. [37] (6.4). However, Pang et al. [38] obtained higher levels with an average of 16.3 alleles per locus.
Statistical parameters related to genetic polymorphism of the 15 microsatellite loci pooling all the accessions into one group. An: number of alleles, Ae: number of effective alleles, Gn: number of genotypes, Ho: observed heterozygosity, He: expected heterozygosity, (r): frequency of null alleles, PI: probability of identity.
| N° | Locus | An | Ae | Gn | Ho | He | (r) | PI |
| 1 | CAT-01 | 10 | 6.45 | 15 | 0.425 | 0.845 | 0.227 | 0.041 |
| 2 | CAC-23 | 6 | 3.40 | 7 | 0.125 | 0.705 | 0.340 | 0.133 |
| 3 | TAA-41 | 6 | 3.87 | 7 | 0.300 | 0.742 | 0.253 | 0.111 |
| 4 | ATC-01 | 8 | 6.10 | 13 | 0.725 | 0.836 | 0.060 | 0.046 |
| 5 | AG-14 | 8 | 4.65 | 9 | 0.275 | 0.785 | 0.285 | 0.074 |
| 6 | CT-19 | 7 | 4.46 | 8 | 0.075 | 0.775 | 0.394 | 0.086 |
| 7 | TAA-15 | 13 | 8.12 | 18 | 0.825 | 0.876 | 0.027 | 0.027 |
| 8 | TAA-27 | 8 | 4.58 | 14 | 0.600 | 0.781 | 0.102 | 0.071 |
| 9 | CAC-39 | 14 | 9.58 | 23 | 0.750 | 0.895 | 0.076 | 0.020 |
| 10 | SCM-02 | 12 | 7.69 | 12 | 0.000 | 0.870 | 0.465 | 0.029 |
| 11 | SCM-05 | 19 | 11.26 | 19 | 0.000 | 0.911 | 0.476 | 0.014 |
| 12 | CAC-33 | 19 | 9.11 | 22 | 0.550 | 0.890 | 0.180 | 0.020 |
| 13 | CT-21 | 10 | 6.61 | 10 | 0.000 | 0.848 | 0.459 | 0.039 |
| 14 | CT-26 | 14 | 9.87 | 18 | 0.350 | 0.898 | 0.289 | 0.0190 |
| 15 | CAC-15 | 14 | 8.44 | 15 | 0.025 | 0.881 | 0.455 | 0.0249 |
| Average | 11.20 | 6.95 | 14 | 0.335 (±0.297) | 0.836 (±0.063) | 0.272 | 1.187 × 10⁻²¹ |
Among the 168 assessed alleles, 104.19 were effective. This difference between the numbers of observed and effective alleles can be explained by the presence of rare ones. The number of effective alleles ranged from 3.40 for the locus CAC-23 to 11.26 for SCM-05, with an average of 6.95. This mean was higher than that reported by Hussein et al. [34] who reported a value of 3.9 (Table 3). Among the analyzed genotypes, 210 allelic combinations were accounted with an average of 14 genotypes per locus. Loci CAC-23 and TAA-41 produced the lowest number of genotypes (7), while the highest level was generated by locus CAC-39 (23). According to our results, the frequency of null alleles (r) presented very low values for all the investigated loci (Table 3), which suggests that the segregation of alleles was not distorted. According to Raji et al. [39], the frequency of null alleles is influenced by several factors, including the diversity of the tested germplasm and others technical aspects such as the quality of the primer sequence.
In order to characterize the most informative molecular markers among the set of 15 assayed loci, the probabilities of identical genotypes (PI) for each locus across all the studied samples were calculated. Our analysis showed low values for PI indices representing the probability of genotyping randomly two identical individuals for all the investigated accessions (Table 3). The lowest PI value was observed for locus SCM-05 (0.014), while locus CAC-23 presented the highest PI value (0.133). Cumulative probability to obtain identical genotypes from the studied accessions pooling all the 15 microsatellite loci is 1.187·10−21 (Table 3). These findings show that the chosen marker set possesses high discriminative power in the investigated sample. Moreover, low PI values reveal a genetic variability among the genotyped accessions based on the applied SSR loci.
The observed heterozygosity (Ho) across the loci ranged from 0 (SCM-02, SCM-05, CT-21) to 0.825 (TAA-15) with a mean of 0.335 (±0.297). The observed heterozygosity for the investigated sample is lower than the level reported for the Iranian Citrus species by Nematollahi et al. [40] (0.67) and for Malaysian Citrus species by Elcy et al. [35] (0.511). The index of genetic diversity (He) shows a rank of variation from 0.705 (CAC-23) to 0.911 (SCM-05), with an average of 0.836 (±0.063) (Table 3). The expected heterozygosity (He) for the studied germplasm is comparable to findings by Snoussi et al. [14] (0.866), but is higher than those obtained by Hvarleva et al. [41] (0.53) and Hussein et al. [34] (0.72) for Citrus species in Cyprus and in Egypt, respectively.
The potential of the markers to yield different genotypes is of great interest, and the selection of the most informative markers reduces the number of loci to be investigated in the discrimination of Citrus accessions. Based on the number of alleles, the expected heterozygosity (He) and PI values, locus SCM-05 (An = 19, He = 0.911, PI = 0.014) was identified as the most discriminant, whereas the locus CAC-23 (An = 6, He = 0.705, PI = 0.133) was the lowest one.
According to the present study, the analyzed sample of the Tunisian Citrus species presented an important genetic diversity level. This result can be explained by multiple introductions, somatic mutations and sexual recombination events recorded for Tunisian Citrus species [14]. Generally, patterns of genetic variability observed for Citrus species can be attributed to the wide cross-compatibility among Citrus species and related genera, and to spontaneous mutations [37,42,43].
The levels of within-species genetic diversity were shown to be low to moderate (Table 4). The mean number of alleles per locus (MNA) ranged from 2.067 (C. paradisi) to 5.333 (C. aurantium). The observed heterozygosity among the investigated species ranged from 0.155 (C. paradisi) to 0.544 (C. limon). Different levels of gene diversities (He) among the studied gene pools were observed. Citrus aurantium accessions highlighted the highest genetic diversity level (0.701), whereas the lowest level is recorded for C. paradisi genotypes (0.363) (Table 4). Our results confirm previous reports that mentioned a moderate level of genetic polymorphism within different Citrus species [41]. A low level of genetic diversity for grapefruit genotypes (Citrus paradisi Macf) was reported by Sharma et al. [43], despite they display a high morphological variability that suggests that the phenotypic variation may be due to somatic mutations. According to results by Ramadugu et al. [15], a lower level of heterozygosity for citrons (Citrus medica L.) was observed.
Genetic variability within the studied species, expected heterozygosity (He) observed heterozygosity (Ho) averaged all loci, the mean number of alleles per locus (MNA).
| Species | MNA | Ho | He |
| C. aurantifolia | 2.733 | 0.422 | 0.481 |
| C. aurantium | 5.333 | 0.355 | 0.701 |
| C. insitorum | 5.200 | 0.266 | 0.676 |
| C. limon | 4.200 | 0.544 | 0.664 |
| C. medica | 2.533 | 0.311 | 0.466 |
| C. paradisi | 2.067 | 0.155 | 0.363 |
| C. reticulata | 2.400 | 0.222 | 0.477 |
| C. sinensis | 2.733 | 0.311 | 0.570 |
3.2 Genetic structure and phylogeny analysis
The partition of the total genetic diversity (HT = 0.832), among and within species, showed that the highest amount of variation is within Citrus species (HS = 0.550), while the relative amount of between-species genetic diversity GST does not exceed 0.338. This pattern of genetic structure was supported by low to moderate FST pairwise values and the presence of a gene flow (Nm) among the eight Citrus species. According to our analysis, the lowest genetic differentiation was revealed between the species C. sinensis and C. insitorum (FST = 0.111, Nm = 1.99), while the highest genetic differentiation was recorded between the species C. aurantifolia and C. paradisi (FST = 0.367, Nm = 0.43) (Table 5).
Pairwise Nm and FST values among the eight investigated Citrus species above the diagonal and in the lower triangle, respectively.
| C. aurantifolia | C. aurantium | C. insitorum | C. limon | C. medica | C. paradisi | C. reticulata | C. sinensis | |
| C. aurantifolia | – | 0.88 | 1.14 | 0.81 | 0.49 | 0.43 | 0.56 | 0.72 |
| C. aurantium | 0.221 | – | 1.37 | 1.70 | 1.41 | 0.85 | 1.98 | 1.63 |
| C. insitorum | 0.179 | 0.154 | – | 1.52 | 1.06 | 0.80 | 1.09 | 1.99 |
| C. limon | 0.235 | 0.128 | 0.141 | – | 0.68 | 0.58 | 0.90 | 1.26 |
| C. medica | 0.336 | 0.150 | 0.190 | 0.268 | – | 0.97 | 1.05 | 1.41 |
| C. paradisi | 0.367 | 0.227 | 0.237 | 0.301 | 0.205 | – | 0.50 | 0.80 |
| C. reticulata | 0.310 | 0.112 | 0.185 | 0.218 | 0.192 | 0.332 | – | 1.12 |
| C. sinensis | 0.257 | 0.132 | 0.111 | 0.165 | 0.150 | 0.238 | 0.182 | – |
In order to highlight the genetic relationships between the studied species, a NJ tree was constructed based on the analysis of the SSR loci. Our results corroborate previous studies concerning the characterization of Citrus genotypes and highlight the effectiveness of SSR molecular markers since all genotypes were discriminated (Fig. 1). According to phylogenic analysis, the results showed a high genetic structure among the studied accessions. Indeed, the genotypes belonging to the same species or group were clustered together, with minor exceptions, which highlighted the efficiency of the used SSR loci as a tool to elucidate phylogenetic relationships among Citrus accessions and species.
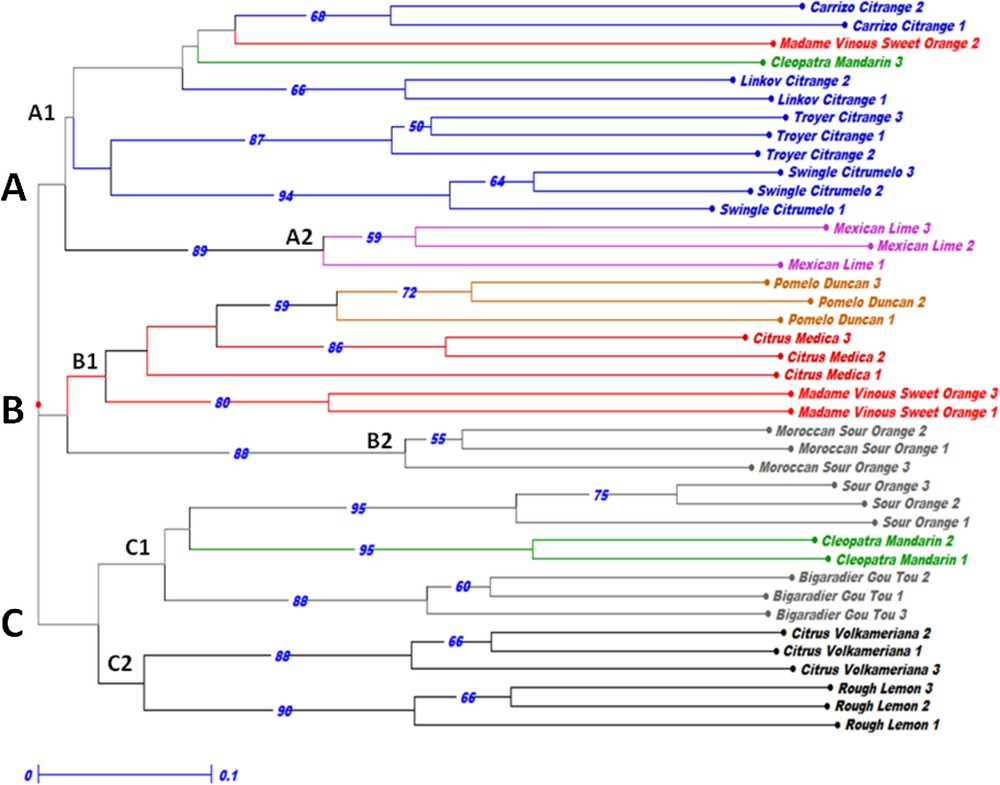
Neighbour-joining tree based on the genotypic data of the 15 SSR loci for the 40 accessions representing eight citrus species based on the unweighted method. Bootstrap probabilities > 50 are shown above the branch.
The established NJ showed that all genotypes were widely discriminated and clearly pooled into three groups labeled from A to C, each cluster being divided into two sub-groups (Fig. 1). The sub-group A1 contained all Citrange accessions, Cleopatra Mandarin 3 and Madame Vinous Sweet Orange 2. The three genotypes of Mexican Lime are divergent and clustered in the sub-group A2. Pomelo Duncan, Citrus Medica and a pair of Madame Vinous Sweet Orange genotypes were pooled in the sub-group B1. The Moroccan Sour Orange genotypes are clustered in the sub-group B2. The sub-group C1 is composed of the Bigaradier Gou Tou, Sour Orange accessions and a pair of Cleopatra Mandarin. Group C2 comprises lemon accessions (Rough Lemon and Citrus Volkameriana).
It is noted that each cluster includes accessions representing one Citrus true species (Group A: C. reticulata, Group B: C. medica, Group C: C. reticulata). This result supports the hypothesis made by Barrett and Rhodes [9], recently confirmed by various biochemical and molecular investigations [10,33,44,45] that evidenced that there is only three true species for the Genus Citrus (Citrus medica L., Citrus reticulata Blanco and Citrus maxima L. Osbeck). All the others Citrus species derived from hybridization between the last three species or closely related genera followed, by natural mutations.
The pattern of genetic structure highlighted the genetic distinction of Mexican Lime (Citrus aurantifolia) and Moroccan Sour Orange genotypes, which have been identified as the most distant from the analyzed samples. This result can be explained by a genetic structure according to the geographical origin of those accessions. Our study shows that Cleopatra Mandarin (Citrus reticulata) is close to the Citrus aurantium accessions (Bigaradier Gou Tou and Sour Orange). This result is consistent with others previous studies which reported that Citrus aurantium was assumed as a hybrid of pummelo and mandarin [10,33,45–47]. This result confirms the hypothesis suggesting that mandarin is one of the putative parents of sour orange. Furthermore, a genetic proximity between Pomelo Duncan (Citrus paradisi), Citrus Medica (Citrus medica) and Madame Vinous Sweet Orange (Citrus sinensis) was also revealed, which corroborates the findings of Biswas et al. [3], Nicolosi et al. [10] and Amar et al. [47,48]. A genetic proximity was also revealed between lemon accessions (Rough Lemon and Citrus Volkameriana) and Sour Orange genotypes, which confirm sour orange as a probable parent of lemon accessions [10].
It is noted that an overlap was observed between the analyzed groups. The Cleopatra Mandarin 3 (Citrus reticulata) accession and the genotype Madame Vinous Sweet Orange 2 (Citrus sinensis) showed a genetic proximity with the Citrange group and clustered together in group A1. The overlapping observed among the accessions of different species could be explained by the sexual compatibility between species within the genus Citrus [41]. Indeed, Citrange accessions derived of crosses between the species Poncirus trifoliata and Citrus sinensis [48].
4 Conclusion
This study clearly indicated that the used nSSR molecular markers are highly polymorphic and efficient to discriminate among the 40 rootstocks belonging to eight Citrus species. An important level of genetic diversity is reported for the studied accessions, which highlights the utility of Tunisian germplasm as genetic resources for further Citrus breeding programs. Furthermore, the phylogenetic analysis of the studied sample confirmed previous reports concerning the origin of the studied Citrus species.
Acknowledgment
The authors thank the Technical Citrus Centre (CTA) in Cap Bon, Tunisia, for making at our disposal their citrus collection and the Ministry of Higher Education and Scientific Research for Financial support.