

1 Introduction
Western Ghats of India is well known for their richness in biodiversity and the prominent level of endemism of various flora and fauna [1]. The remarkable diversity of fishes is observed in the Western Ghats and newly described species are enriching current knowledge about the fish diversity of this region [2]. The family Nemacheilidae is the important and highly endemic family of fishes occurring in the Western Ghats. The individuals of this family are commonly called as stream loaches. There are various reports on new species of loaches found in the Western Ghats. A number of new fish species of loaches were described by various researchers [3–6]. Presently, 44 species of loaches belonging to 13 genera were reported on the basis of morphological characteristics. Out of these, 40 species (approximately 90%) are endemic to the Western Ghats [7]. However, from the northern Western Ghats, seven species of loaches were reported. It underlines the importance of this group as well as the Western Ghats.
Studies based on morphological characteristics fail to identify and discriminate the members of the family Nemacheilidae. The numbers of species were undescribed due to the morphological ambiguity and some of the species needed taxonomic validation [8]. This complexity in identification may be due to the changes in coloration, banding pattern and minute differences in taxonomic characters from juvenile to adult stage in the life cycle of loaches. Hurdles in taxonomic identification can be solved with the help of molecular techniques. Nowadays for plants and animals, various molecular-based approaches are used to identify species, study genetic similarity and diversity, formulate conservation strategies and analyze the phylogenetic relationship. These approaches includes isozyme electrophoresis [9], random amplified polymorphic DNA (RAPD) [10], inter-simple sequence repeat (ISSR) [11], minisatellite [12], microsatellite [13], amplified fragment length polymorphism (AFLP) [14,15], biochemical characterization [16], and DNA barcoding [17] in fish. So far, only commercially important fish species were studied for genetic diversity. Small groups like loaches were not studied because they do not have profitable significance, though having high ecological significance. Hence, studies based on the molecular marker (RAPD, ISSR, and AFLP) for the Nemacheilidae family are not available, which are reported in the present study.
Identification of three selected genus is difficult to identify only on the basis of morphological and anatomical characteristics. Till date, there is scarce information available regarding the ecology, biology and allometry of these loaches [18]. For the present investigation, morphological and molecular identification, like the polymerase chain reaction (PCR)-based RAPD, ISSR, AFLP and DNA barcoding techniques were used. The objective of the present investigation is to identify and evaluate genetic diversity, analyze phylogenetic relationship along with the comparative efficiencies of RAPD, ISSR, AFLP markers and DNA barcoding in reference to the applicability and reproducibility for family Nemacheilidae.
2 Materials and methods
2.1 Sample collection and identification
Live specimens of loaches were collected from three different localities of the Kolhapur district, Maharashtra. Nemacheilus anguilla (Annandale, 1919) from the Kasari River (16°45′24.4′′N, 73°58′56.5′′E), Nemachilichthys rueppelli (Sykes, 1839) from the Panchganga River (16°43′01.2′′N, 74°11′19.9′′E) and Schistura denisoni (Day, 1867) from the Warana River (17°07′51.4′′N 73°52′12.7′′E) were collected and maintained in aquarium for further analysis. On the basis of morphological characters, fish species were confirmed. Five specimens from each species were used to study intra- and interspecies variation.
2.2 Extraction of DNA
DNA was isolated from a caudal fin muscle tissue using phenol-chloroform method [19] and stored in Tris buffer and was kept at −20 C. The quality of isolated DNA was checked on 1% agarose gel and quantified using an Eppendorf BioSpectrometer. The DNA samples were diluted to 20 ng/μL concentration for further analysis.
2.3 RAPD and ISSR analysis
Twenty-nine RAPD primers of University of British Columbia Biotechnology Laboratory (set#1, 4, 5 and 6) and 25 random primers of ISSR [20,21] were screened (Table 1). Primers were selected on the basis of a number of bands obtained and ability to produce consistent fragment patterns on 3% agarose gel. PCR amplification reactions for RAPD and ISSR markers were performed in 20 μL reaction volume containing 1.6 μL of 10 × PCR buffer, 0.33 μL of 10 mM dNTP, 0.13 μL Taq DNA polymerase (5 units/μL; Sigma-Aldrich, USA), 1.33 μL primer (15 pM) and 2 μL of genomic DNA (20 ng/μL). The amplification conditions were optimized for ISSR and RAPD as follows: initial denaturation of DNA at 94 °C for 5 min, thirty-five cycles of denaturation at 94 °C for 1 min, annealing at 37 °C (for RAPD)/40 °C (for ISSR) for 2 min and extension at 72 °C for 1 min. A final extension was carried out at 72 °C for 10 min [22]. The amplified PCR products were subjected to electrophoresis on 3% agarose gel containing ethidium bromide along with 100 bp and 1 kb ladder as a standard molecular size marker.
List of RAPD, ISSR, AFLP primers along with polymorphic bands, monomorphic bands, and percentage of polymorphism.
| Primer name | Sequence | Total bands | Polymorphic bands | Monomorphic bands | % of polymorphism |
| RAPD | |||||
| RAPD16 | GGTGGCGGGA | 19 | 19 | 0 | 100 |
| RAPD 17 | CCTGGGCCTC | 14 | 14 | 0 | 100 |
| RAPD 67 | GAGGGCGAGC | 15 | 15 | 0 | 100 |
| RAPD 71 | GAGGGCGAGG | 11 | 11 | 0 | 100 |
| RAPD 81 | GAGCACGGGG | 5 | 5 | 0 | 100 |
| RAPD 84 | GGGCGCGAGT | 4 | 4 | 0 | 100 |
| RAPD 73 | GGGCACGCGA | 9 | 9 | 0 | 100 |
| RAPD 86 | GGGGGGAAGG | 9 | 9 | 0 | 100 |
| RAPD 88 | CGGGGGATGG | 6 | 6 | 0 | 100 |
| RAPD 89 | GGGGGCTTGG | 7 | 7 | 0 | 100 |
| Total | 99 | 99 | 0 | 100 | |
| ISSR | |||||
| ISSR1 | (GGAC)3A | 19 | 19 | 0 | 100 |
| ISSR2 | (GGAC)3C | 19 | 19 | 0 | 100 |
| ISSR5 | (GGAC)4 | 16 | 15 | 1 | 93.75 |
| ISSR6 | (GGAT)4 | 5 | 5 | 0 | 100 |
| ISSR7 | (TAGG)4 | 5 | 5 | 0 | 100 |
| ISSR8 | (GACA)4 | 8 | 8 | 0 | 100 |
| 844B | (CT)8GC | 14 | 14 | 0 | 100 |
| 17898B | (CA)6GT | 9 | 9 | 0 | 100 |
| Total | 95 | 94 | 1 | 98.94 | |
| AFLP | EcoRI MseI | ||||
| E1F-M3R | ACT CAG | 131 | 127 | 4 | 96.94 |
| E1F-M5R | ACT CTA | 97 | 96 | 1 | 98.96 |
| E2F-M3R | ACA CAG | 163 | 153 | 10 | 93.86 |
| E2F-M4R | ACA CAT | 191 | 183 | 8 | 95.81 |
| E2F-M5R | ACA CTA | 137 | 135 | 2 | 98.54 |
| E5F-M1R | AGC CAA | 116 | 112 | 4 | 96.55 |
| Total | 835 | 806 | 29 | 96.52 |
2.4 AFLP analysis
The AFLP reaction was performed using the standard protocol developed by Vos et al. with slight modifications, i.e. non-radioactive fluorescent dye-labeled primers were used [23]. Approximately 250 ng of genomic DNA was digested using restriction enzymes, viz. 5 U EcoRI and 5 U MseI at 37 °C for 1 h followed by a 15-min enzyme inactivation at 65 °C. For confirmation of digestion by restriction enzymes, 10 μL of digested DNA was run on a 2% agarose gel. Then, adaptors were ligated to the DNA samples using 1 U T4 DNA ligase, 1 μL of 5 μM EcoRI (5′-CTCGTAGACTGCGTACC-3′ and 5′-AATTGGTACGCAGTCTAC-3′) and 1 μL of 50 μM MseRI (5′-GACGATGAGTCCTGAG-3′ and 5′-TACTCAGGACTCAT-3′). Five microliters of 10-fold diluted ligation products were utilized for the pre-amplification reaction. For pre-selective amplification, ligated products were used in the following PCR conditions: 20 cycles of denaturation at 94 °C (30 s), annealing at 56 °C (60 s) and final extensions at 72 °C (60 s). Then, by using a 1% agarose gel, the amplified PCR product was checked. Prior to storage at −20 °C, it was confirmed by gel electrophoresis and diluted 10 times.
The fluorescent labeled 3 EcoRI and 4 MseI primers were used for selective AFLP amplification. Ten primer combinations were screened using DNA samples from three fish species. Out of the set of 10 primers, 6 primer pair sets were selected for further AFLP analysis depending on their reproducibility. Selective amplification composed of three steps: denaturation at 94 °C for 30 s, followed by 12 cycles of touchdown PCR in which the annealing temperature decreased by 1 °C by cycle up to 56 °C. Once reached, another 23 cycles were conducted at 94 °C for 30 s, 54 °C for 30 s, 72 °C for 60 s as above for pre-amplification [24]. Automated fragment analysis was performed using 3500 Genetic analyzer (Applied Biosystems) using GeneScan 600 LIZ as a size standard.
2.5 Polymerase chain reaction and sequencing of COI
The amplification of the COI gene fragment was carried out with the help of universal COI primers (VF2_t1–TGTAAAACGACGGCCAGTCAACCAACCACAAAGACATTGGCAC, FishF2_t1–TGTAAAACGACGGCCAGTCGACTAATCATAAAGATATCGGCAC, FishR2_t1–CAGGAAACAGCTATGACACTTCAGGGTGACCGAAGAATCAGAA, FR1d_t1–CAGGAAACAGCTATGACACCTCAGGGTGTCCGAARAAYCARAA) for fish published by Ivanova et al. [25]. The total volume of the PCR was 25 μL and contained 2.5 μL of 10 × reaction buffer, 0.5 μL of dNTPs (10 mM), 2 μL of primer (20 pM), 0.2 μL Taq DNA polymerase (5 U/μL; Sigma-Aldrich, USA), 17.3 μL of nuclease free water, and 2.5 μL of genomic DNA. The thermal cycler profile started at 94 °C for 4 min, followed by 34 cycles at 94 °C (50 s), 53 °C (50 s), and 72 °C (90 s) finalized at 72 °C for 7 min. PCR products were purified and sequenced bidirectionally in an ABI 3500 Genetic Analyzer by utilizing Big Dye Terminator v3.1 sequencing kit (Thermo Fisher Scientific, USA).
Alignments of sequences were done pairwise and edited using Sequencher 5.1. Software by manual inspection of the electropherograms and sequences, which covered a minimum of 30% overlap between forward, and reverse were considered for further analysis. The nucleotide sequence data was deposited to GenBank NCBI database (S. denisoni – KX088301 to KX0883005, Nemacheilus anguilla – KX088306 to KX0883010, Nemachilichthys rueppelli – KX088312 to KX0883016). The DNA sequence was aligned by MUSCLE v3.8.31 using the default parameters and edited with BioEdit v.7.0.9 [26,27].
2.6 Data analysis
RAPD, ISSR and AFLP profiles were analyzed by creating the binary matrix. Reproducible and scorable bands were considered for the analysis. From the obtained binary matrix, the Simple Matching Coefficient [28] was calculated in NTSYS-pc (Numerical Taxonomy and Multivariate Analysis System) package, version 2.1 [29]. PowerMarker version 2.3.2 software was used to calculate the polymorphism information content (PIC), the allele frequency, the genetic diversity, the genetic distance, and the heterozygosity for each molecular marker [30]. The multiplex ratio was calculated by using the following formula: MR = L/T, where L is the total number of bands and T is the total number of primers/primer sets. Principal component analysis (PCA) was undertaken to find out the differences from the three molecular marker profiles with the help of Paleontological Statistics Software (PAST) [31].
2.7 Phylogenetic analysis
For phylogenetic analysis, publicly available sequences of Botia dario (Accession No. KP974804) and Garra mullya (Accession No. JX983296) were downloaded in FASTA format (http://www.ncbi.nlm.nih.gov/genbank/) and used as outgroups for phylogenetic analysis. Phylogenetic tree were estimated by the Maximum Likelihood (ML) method using MEGA 5.2.2 [32]. A best-fit model of nucleotide evolution was selected and ML phylogeny was constructed using the Hasegawa-Kishino-Yano model with 1000 bootstrap replicates [33].
3 Results
In the present study, 15 individuals from three species populations were used for molecular study. In their adult stage, individuals of Nemacheilus anguilla, Nemachilichthys rueppelli and S. denisoni had been successfully differentiated on the basis of morphological characters. The juveniles of these species were difficult to differentiate due to the plasticity of the anatomical characters. A total of 29 RAPD primers, 25 ISSR primers and 10 primer pairs of AFLP were screened to study the genetic variability among these populations. For each species population, five individuals were studied for intraspecies genetic variation. For RAPD, ISSR and AFLP markers, individuals of the same species produced a congruent banding pattern. The analysis of the banding pattern indicates very low intraspecies genetic variation. The COI sequence region also shows no intraspecies nucleotide variation.
A broad range of bands was produced by molecular markers between 95 and 773 for ISSR and AFLP, respectively. All 10 selected RAPD primers gave a 100% polymorphism and yielded a total of 99 bands. The 8 selected ISSR primers, except ISSR 5 (93.75%), showed 100% polymorphism and yielded a total of 95 bands (Fig. 1), whereas 6 primer combinations of AFLP primers yielded a total of 835 bands out of which 29 were monomorphic bands and 806 polymorphic bands. The details of the selected primers are shown in Table 1. In comparison, RAPD showed higher polymorphism (100%) than ISSR (98.94%) and AFLP (96.52%). The polymorphic information content was calculated for three molecular markers. It was highest for AFLP (0.8102) compared to RAPD (0.428) and ISSR (0.4929). The heterozygosity (1), the multiplex ratio (139.16) and gene diversity (0.8333) was also observed to be highest in AFLP primers. The major allele frequency was higher for RAPD (0.5556) and lowest for AFLP (0.1667). All comparative information for molecular markers along with statistics for genetic diversity was performed (Table 2). For RAPD, ISSR and AFLP, a simple matching algorithm was used to calculate genetic similarity values between the species (Table 3). Genetic similarity values of combined markers of these three fish species range from 0.3340 to 0.4002. This narrow range of genetic similarity values indicates that Nemachilichthys rueppelli, Nemacheilus anguilla, and S. denisoni were genetically closely related.
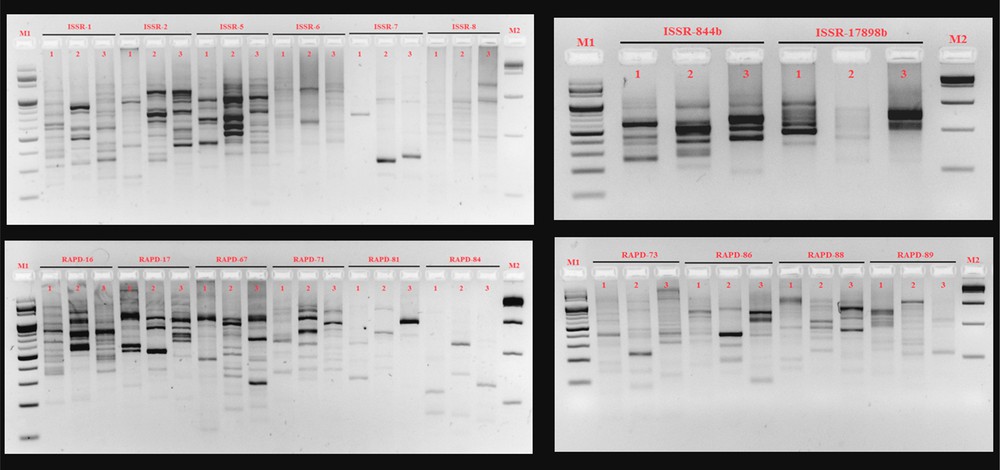
ISSR and RAPD profile of three fish species. M1, 100 bp DNA ladder; lane 1, Nemachilichthys rueppelli; lane 2, Nemacheilus anguilla; lane 3, Schistura denisoni; M2, 1 kb DNA ladder.
Average comparative efficiency of studied markers in determining polymorphism of family Nemacheilidae.
| Parameter | ISSR | RAPD | AFLP |
| Number of primers | 08 | 10 | 06 |
| Total number of bands | 95 | 99 | 835 |
| Polymorphic bands | 94 | 99 | 806 |
| Multiplex ratio | 11.87 | 9.9 | 139.16 |
| Major allele frequency | 0.4792 | 0.5556 | 0.1667 |
| Gene diversity | 0.5764 | 0.5185 | 0.8333 |
| Heterozygosity | 0.125 | 0 | 1 |
| PIC | 0.4929 | 0.428 | 0.8102 |
Calculated genetic similarity values based on RAPD, ISSR, AFLP and combined marker system.
| Nemachilichthys rueppelli | Nemacheilus anguilla | Schistura denisoni | |
| RAPD\ISSR | |||
| Nemachilichthys rueppelli | 1 | 0.3789474 | 0.3263158 |
| Nemacheilus anguilla | 0.3333333 | 1 | 0.3157895 |
| Schistura denisoni | 0.3838384 | 0.2828283 | 1 |
| AFLP\combined | |||
| Nemachilichthys rueppelli | 1 | 0.3340227 | 0.3381592 |
| Nemacheilus anguilla | 0.7321092 | 1 | 0.4002068 |
| Schistura denisoni | 0.7358757 | 0.7730697 | 1 |
The COI region of all individuals was successfully amplified and sequenced. The intraspecies variation in individuals of same species was not observed. The genetic distance based on the change in nucleotide base were calculated and used to discriminate studied species. The COI region gave 100% species resolution. Overall, it was found that the COI region could be used to identify and differentiate the individuals of Nemacheilus anguilla, Nemachilichthys rueppelli and S. denisoni with 100% efficiency. Two major clusters were obtained in phylogeny constructed using the maximum likelihood method (Fig. 2). The Nemacheilus anguilla, Nemachilichthys rueppelli, and S. denisoni were observed to form a cluster. In the phylogenetic tree, Nemacheilus anguilla and S. denisoni were observed genetically more similar compared to Nemachilichthys rueppelli. PCA analysis of RAPD, ISSR, AFLP and the combined matrix confirm the clustering pattern (Fig. 3) and genetic differentiation of species obtained from the phylogeny based on the COI sequence.
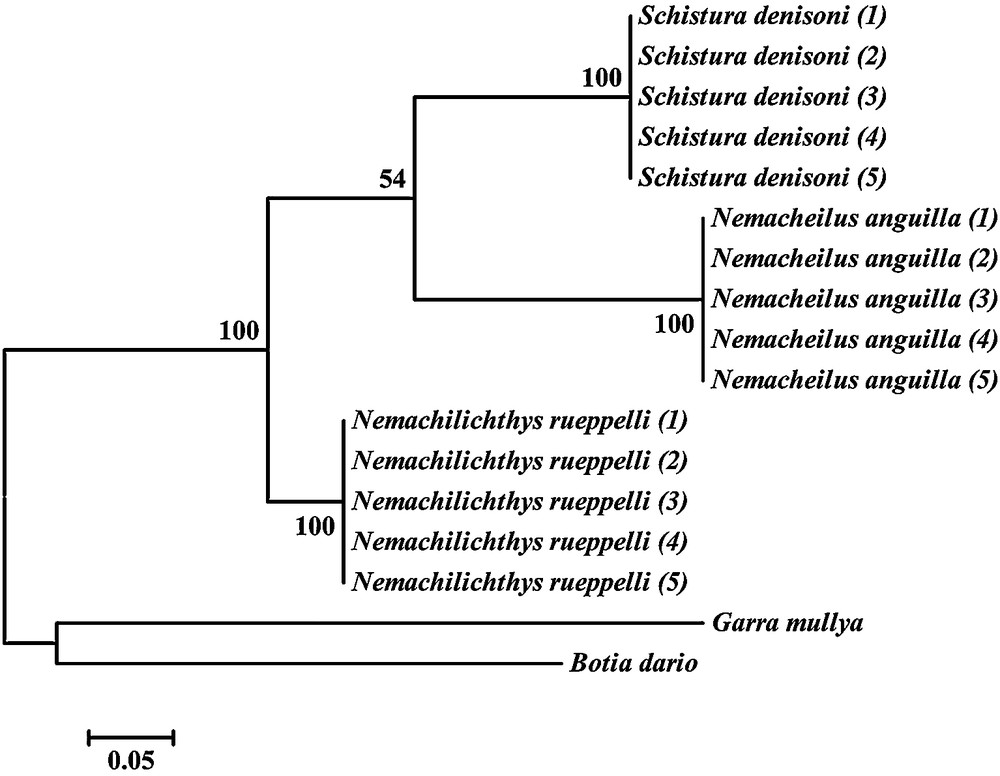
Maximum likelihood tree of three fish species from family Nemacheilidae based on the COI barcoding region.
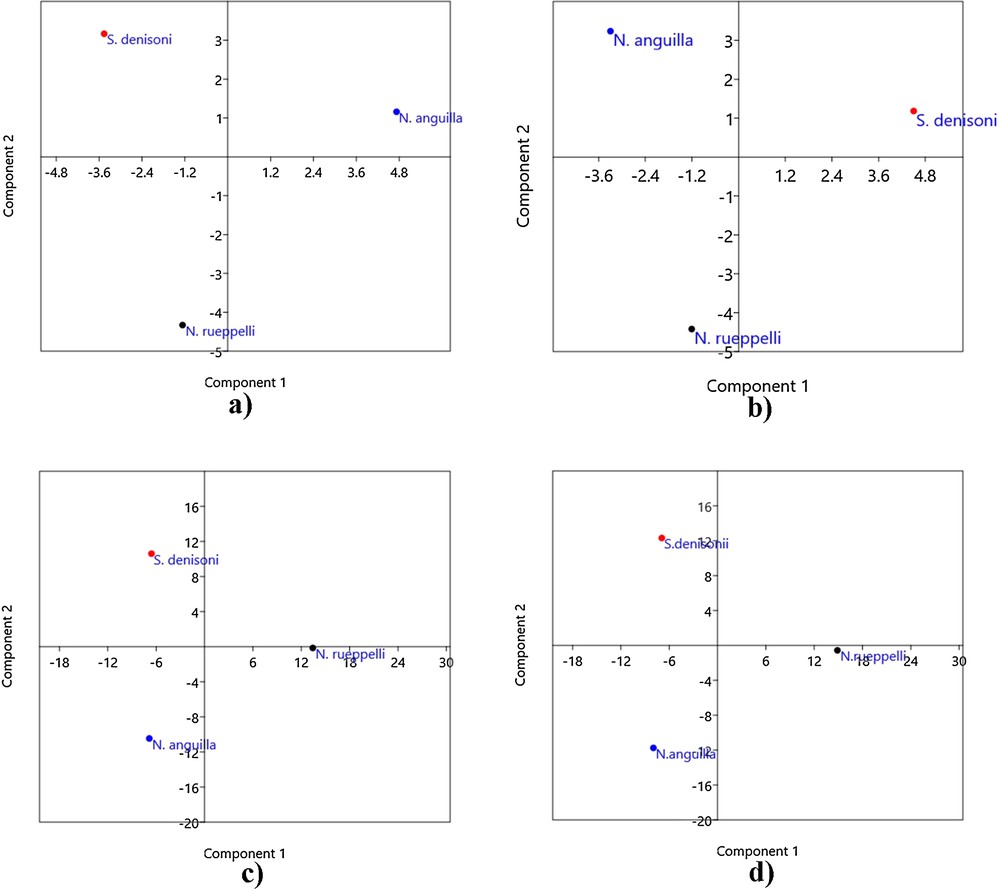
Principal component analysis based on (a) RAPD, (b) ISSR, (c) AFLP, and (d) combined matrix confirming the clustering pattern.
4 Discussion
Correct identification and ability to discriminate the species is an essential step for species conservation. The genetic diversity is essential for the species to adapt and survive in various ecological conditions. A broad array of molecular marker techniques is reviewed by the earlier researcher for diverse purposes in fisheries research [34]. In the present investigation, three PCR-based molecular marker systems were adapted, viz. RAPD, ISSR and AFLP to explore their efficiency of identification and determination. Taxonomic ambiguities among the family Nemacheilidae can be resolved using molecular markers stated here. Merits and demerits of these three molecular markers have been documented by the earlier researchers [35–37]. Various applications of RAPD, ISSR and AFLP markers are an important tool for studying genetic mapping, development of genetic molecular markers that are linked to trait, evolutionary history, animal breeding, phylogeographic relatedness, and reconstruction of phylogeny, genetic variability among the Pisces group [38–42]. Few studies are available in relation to the phylogenetic relation among the loaches. The family Cobitidae studied by earlier researchers extensively for the phylogenetic lineage along with the relationship using the mitochondrial cytochrome b gene (Cyt b gene) and the nuclear gene RAG-1 taxonomic revision of genus Cobitis by combining the morphological characters and genetic information using the Cyt b gene and two nuclear gene RAG-1 and S7 gene (first intron) [43]. Likewise, reconstruction phylogeny and evaluation of the polyploidy number during the evolution of family Botiidae was also undertaken to resolve taxonomic issues [44].
This is the first attempt that contributes to resolve the taxonomic ambiguities among the family Nemacheilidae and is valuable for population genetics studies and to identify closely related species. The RAPD, ISSR and AFLP markers used here have been successful to resolve the genetic diversity among the species. Using these markers, one can distinguish unknown individuals by comparing them to known samples. The genetic similarity distance and PCA analysis demonstrated the genetic diversity among these species. In PCA analysis, the species were clustered at genetical equidistance.
The phylogeny constructed using the genetic distance based on the COI region sequence shows that S. denisoni and Nemacheilus anguilla come together in one sub-clade while Nemachilichthys rueppelli has formed a separate sub-cluster. Comparing this phylogeny with the PCA plot, the same two species, i.e. S. denisoni and Nemacheilus anguilla overlap, showing that Nemachilichthys rueppelli has a separate cluster formation that shows two data supportive to each other. The calculated values for all collective genetic data of multiplex ratio, major allele frequency, gene diversity, heterozygosity and PIC were shown to be moderately high [45]. The PIC value gives the discriminatory capacity of the marker system to distinguish genotypes.
Molecular marker produces dominant, multiple loci and genome profile of DNA. Selected molecular markers (RAPD, ISSR, and AFLP) are cost-efficient and highly reproducible tools, which do not require prior sequence information [46,47]. Hence, it is suitable for molecular discrimination and DNA fingerprinting. These techniques are based on the selective PCR amplification of fragments from a genomic DNA. It gives high genetic polymorphism, valuable loci information, and reveals genetic variations within and between species. The main lacuna of these techniques is that they require a standard sample to be compared with test samples. The DNA barcoding technique was observed to be highly reproducible and did not require a test sample at each time. Though, DNA barcoding is able to reveal genetic variability, but it is labor and cost intensive.
5 Conclusion
The present study on Nemachilichthys rueppelli, S. denisoni, and Nemacheilus anguilla has successfully demonstrated the use of molecular markers, viz. RAPD, ISSR and AFLP for unambiguous identification and genetic differentiation. This kind of molecular-based systematic analysis can be used for precise identification of juvenile individuals that are extremely difficult to distinguish based on morphometric characters. The RAPD, ISSR, AFLP and combined markers showed a high level of polymorphic bands at the interspecies level compared to the intraspecies level. The robustness and suitability of COI DNA barcoding markers make them the most reliable method to identify and study the genetic relationship among the species. This study is useful for assessing the genetic diversity and the identification of a taxonomically complicated species.
Disclosure of interest
The authors declare that they have no competing interest.
Acknowledgement
The authors are thankful to the DBT-Interdisciplinary Program of Life Sciences for Advanced Research and Education (No. BT/PR 4572/INF/22/147/2012), New Delhi, India for financial support and encouragement.