

1 Introduction
Plant breeding is defined as the selection of a particular individual for the production of progeny by separating or combining the characteristics, morphology, physiology and resistance to fungal diseases and insects. Because Ubi gadong is a perennial species and the breeding period of this species is long, Ubi gadong is not generally grown by farmers; instead it grows in a wild state in the forests and hilly lands. But it can also be grown through vegetative methods of cultivation using corms in a suitable growing area. With the process for conventional planting, bulbs will grow and can be collected as they are, growing at wild state in the woods and abandoned areas. The period of breed selection with the desired characteristics can be shortened with the use of molecular marker techniques such as Random Amplified Polymorphic DNA (RAPD), Inter Simple Sequence Repeats (ISSR) and Simple Sequence Repeats (SSR). Molecular marker technology has been used to study the pattern of genetic inheritance in the genus Dioscorea, among others, D. nebula and D. dumetorum using Amplified Length Polymorphism (AFLP) [1]. In addition, this technique is useful for determining the status of a species or between species of plants. Molecular marker techniques are pleasing, fast and efficient because genetic information is preserved from any influence of the environment as compared with the morphological information. However, the combination of these two molecular and morphological techniques is a better and more effective strategy for breeding D. hispida. Dioscorea species is a rich source of starch with high caloric value, containing huge vitamins, minerals, and other pharmaceutical properties [2]. From the ancient time, it is being eaten by local people of different countries including Malaysia as an easy and cheapest source of food and different parts of this plant as a remedy for various health disorders including stomach ache, constipation, indigestion, abdominal pain, dysentery, cough, cold, asthma, tuberculosis, skin wounds, boils, sunburn, reducing body heat, and many more [3–5]. But this important crop is still underutilized and there is no improved variety for commercial cultivation. So, the selection of new varieties of D. hispida characterized by high yield and rapid growth is very essential. Considering the importance of the above, this study was conducted to choose a potential breed of D. hispida using conventional methods and ISSR markers assessing genetic diversity and patterns of inheritance among the collected germplasm collections. The final goal is the propagation of the selected breed and the supply of seedlings to the farmers for improved cultivation and sustainable production of Dioscorea hispida.
2 Materials and methods
2.1 Germplasm collection and evaluation
A total of 160 Ubi gadong accessions were collected from two states of Malaysia: Terengganu and Kelantan. Samples were collected from five different districts and 11 villages and weighing about 423.5 kilograms of corms (yellow and white, two different varieties of same species) obtained during sampling. Then, selections were done on all samples based on the desired characteristics of a high tree with high yield containing lot of corms. Then, as many as 48 samples from 160 Ubi gadong germplasms were selected as “primary” samples, which were then grown and maintained in Germplasm plot, Research Farm in Gong Badak campus, Universiti Sultan Zainal Abidin. Complete herbarium specimens with male and female flowers were also stored in the herbarium for future identification in Universiti Sultan Zainal Abidin, Kuala Terengganu and Universiti Kebangsaan Malaysia, Bangi. Brief collection details of Ubi gadong accessions are displayed in Table 1.
Brief collection details of the collected Ubi gadong samples.
| No. | Accession | District | Villages |
| 1 | DH 0027 | Marang | KG Sungai Serai |
| 2 | DH 0028 | Marang | KG Sungai Serai |
| 3 | DH 0029 | Marang | Bukit Belacan, KG Sungai Serai |
| 4 | DH 0030 | Marang | Bukit Belacan, KG Sungai Serai |
| 5 | DH 0031 | Marang | Bukit Belacan, KG Sungai Serai |
| 6 | DH 0032 | Marang | Bukit Belacan, KG Sungai Serai |
| 7 | DH 0033 | Marang | Bukit Belacan, KG Sungai Serai |
| 8 | DH 0034 | Marang | Bukit Belacan, KG Sungai Serai |
| 9 | DH 0035 | Marang | Bukit Belacan, KG Sungai Serai |
| 10 | DH 0036 | Marang | Bukit Belacan, KG Sungai Serai |
| 11 | DH 0037 | Marang | Bukit Belacan, KG Sungai Serai |
| 12 | DH 0038 | Marang | Bukit Belacan, KG Sungai Serai |
| 13 | DH 0039 | Marang | Bukit Belacan, KG Sungai Serai |
| 14 | DH 0040 | Marang | Bukit Belacan, KG Sungai Serai |
| 15 | DH 0041 | Marang | Bukit Belacan, KG Sungai Serai |
| 16 | DH 0042 | Marang | Bukit Belacan, KG Sungai Serai |
| 17 | DH 0043 | Marang | Bukit Belacan, KG Sungai Serai |
| 18 | DH 0044 | Marang | Bukit Belacan, KG Sungai Serai |
| 19 | DH 0045 | Marang | Bukit Belacan, KG Sungai Serai |
| 20 | DH 0046 | Marang | Bukit Belacan, KG Sungai Serai |
| 21 | DH 0047 | Marang | Bukit Toktong, KG Sungai Serai |
| 22 | DH 0048 | Marang | Bukit Toktong, KG Sungai Serai |
| 23 | DH 0049 | Marang | Bukit Toktong, KG Sungai Serai |
| 24 | DH 0050 | Marang | Bukit Toktong, KG Sungai Serai |
| 25 | DH 0051 | Marang | Bukit Toktong, KG Sungai Serai |
| 26 | DH 0052 | Marang | Bukit Toktong, KG Sungai Serai |
| 27 | DH 0053 | Marang | Bukit Toktong, KG Sungai Serai |
| 28 | DH 0054 | Marang | Bukit Toktong, KG Sungai Serai |
| 29 | DH 0055 | Marang | Bukit Toktong, KG Sungai Serai |
| 30 | DH 0056 | Marang | Bukit Toktong, KG Sungai Serai |
| 31 | DH 0057 | Marang | Bukit Toktong, KG Sungai Serai |
| 32 | DH 0058 | Marang | Bukit Toktong, KG Sungai Serai |
| 33 | DH 0059 | Marang | Bukit Toktong, KG Sungai Serai |
| 34 | DH 0060 | Marang | Bukit Toktong, KG Sungai Serai |
| 35 | DH 0061 | Marang | Bukit Toktong, KG Sungai Serai |
| 36 | DH 0062 | Marang | Bukit Toktong, KG Sungai Serai |
| 37 | DH 0063 | Marang | Bukit Toktong, KG Sungai Serai |
| 38 | DH 0064 | Marang | Bukit Toktong, KG Sungai Serai |
| 39 | DH 0070 | Hulu TRG | KG Pangkalan AJAL |
| 40 | DH 0071 | Hulu TRG | KG Pangkalan AJAL |
| 41 | DH 0072 | Hulu TRG | KG Pangkalan AJAL |
| 42 | DH 0073 | Hulu TRG | KG Pangkalan AJAL |
| 43 | DH 0074 | Hulu TRG | KG Pangkalan AJAL |
| 44 | DH 0075 | Hulu TRG | KG Pangkalan AJAL |
| 45 | DH 0077 | Hulu TRG | KG Pangkalan AJAL |
| 46 | DH 0078 | Hulu TRG | KG Pangkalan AJAL |
| 47 | DH 0079 | Hulu TRG | KG Pangkalan AJAL |
| 48 | DH 0080 | Besut | KG Air Terjun |
2.2 Propagation, growth and data collection
As Ubi gadong usually produce corms instead of normal seeds like other crops, vegetative propagation was followed using corms/bulbs. Sampled bulbs were planted in polybags (15 × 18 inches), weighing 200–300 g each using a prepared soil (soil:sand:manure = 3:2:1) with five replications. Growing areas were covered with 50% shade and light using black shade cloths until proper maturity of the Ubi gadong plants. Another method of preparation of propagating materials is; to cut corm with respect to some parts of the form and number of buds that form on the surface of the skin of the corm. Transplanted bulbs were tagged and labeled properly. All other agronomic practices (weeding, irrigation, fertilizer application etc.) were done following standard methods. Data on tree height and corm weight were observed every two months (Fig. 1). The plant height was measured from the tree root or the rhizome to the shoot.
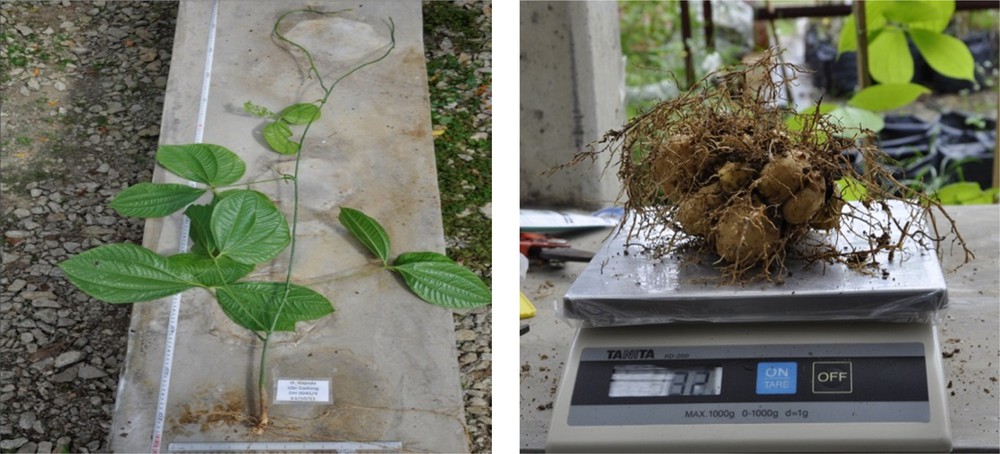
Data collection on plant height and weight of the corm.
2.3 Extraction of DNA and quantification
The young leaves from each accession of 18 selected D. hispida samples were the main source of DNA. The collected leaf samples were stored in the CTAB buffer to improve the process of solving the cell. DNA extraction was performed using Geneaid Genomic DNA Mini Kit (Plant) to produce high-quality DNA extracts. One microliter of each DNA sample was put on NanoDrop spectrophotometry (ND-1000, NanoDrop Technologies Inc., Wilmington, DE, USA), and the relative purity with concentration of the extracted DNA were displayed. The final concentration of each DNA sample was diluted with 1 × TE buffer (10 mM Tris-HCl, pH 8.0, 1 mM EDTA, pH 8.0) to get the required concentration and kept in a refrigerator at –20 °C for PCR analysis.
2.4 ISSR primers used in the PCRs
A total of 12 ISSR primers obtained from various publications were screened with D. hispida DNA; out of these, only three primers, which formed clear and reproducible polymorphic bands, were chosen and used for genetic diversity analysis among 48 Ubi gadong accessions. ISSR primers with sequence are displayed in Table 2.
List of ISSR molecular markers and sequences.
| No. | Code | Sequences |
| 1 | ISSR1 | CTCTCTCTCTCTCTCTAGT |
| 2 | ISSR2 | GTCGTCGTCGTCGTCGTC |
| 3 | ISSR3 | GTGCGTGCGTGCGTGC |
| 4 | ISSR4 | ACACACACACACACACT |
| 5 | ISSR5 | AGAGAGAGAGAGAGAGCTC |
| 6 | ISSR6 | GTGTGTGTGTGTCC |
| 7 | ISSR7 | CTCTCTCTCTCTCTCTAC |
| 8 | ISSR8 | AGAGAGAGAGAGAGAGTA |
| 9 | ISSR9 | AGAGAGAGAGAGAGAGTC |
| 10 | ISSR10 | CTCTCTCTCTCTCTCTGC |
| 11 | ISSR11 | GAGGAGGAGGAGGC |
| 12 | ISSR12 | CTCTCTCTCTCTCTCTTG |
2.5 Polymerase Chain Reactions (PCR) amplification and gel electrophoresis
Polymerase chain reaction for amplification of ISSR fragments was performed in 15 μl of reaction volume containing 1 μl of 70 ng template DNA, 2.0 μl of ISSR primer, 7.4 μl master mix (Dream Taq green PCR master mix-2X containing green buffer, dNTPs, and 4 mM MgCl2, supplied by Fermentas-Fisher Scientific, UK) and 4.6 μl nuclease-free water. PCR amplification was carried out in a thermocycler (T100TM, Bio-Rad). The initial temperature was adjusted to 94 °C for 2 min and the initial denaturation temperature was set at 94 °C for 1 min. Later on, the elongation temperature was 72 °C for 1 min and finally the elongation temperature was set at 72 °C for 10 min. Finally, the infinitive holds at 10 °C. For electrophoresis, 1.5% molecular-grade Agarose (Nacalai Tesque Inc., Kyoto, Japan) gel was prepared containing 1 μl of Midori green in 1 × TBE buffer (0.05 M Tris, 0.05 M boric acid, 1 mM EDTA, pH 8.0). The gel was run at a constant voltage of 70 V for 2 h 30 minutes and visualized under Molecular Imager® (GelDocTM XR, Bio-Rad). However, most of the patterns with extremely good polymorphism and useful information were often accompanied with a background smear. To reduce this smear, 2% formamide was used in the reaction. All the patterns generated were repeated at least three times in order to obtain reproducible data.
2.6 Data scoring and analysis
Molecular weight for each band was measured by using Alfa Imager software version 5.5. Each amplification product position was considered as a locus. The amplified products for ISSR marker loci at a specific position in a gel were scored visually as “1” for present and “0” for absent of a band to generate a binary data matrix. Data analysis was performed using Phylogenetic Analysis Using Parsimony (PAUP) software. Comparative data was assessed using a score Neighbour-Joining analysis. A 100-bp DNA ladder was added with the first load of the gel to score for the bands in each gel. The only bands that were scored are those that are > 100 bp in length and reproducible. The scoring of the visual bands was done according to the size of the DNA ladder bands.
3 Results and discussion
3.1 Evaluation of the elected primary samples
Our results showed that plant height and corm yield increased at the beginning to the middle intervals (1 to 3 from February 12 to June 17), but no significant changes were observed in the following two intervals (3 and 4 from August 30 to October 16). These findings were consistent with those of Bahera et al. [6], who reported that the growth increased in the first 5- to 6-month growing periods. This is because, in the early stages of growth, a majority of the plants, especially tuber crops, use more nutrients and water contained in the corm to produce new corms [7].
Table 3 shows that accession 25 (DH0051) showed the highest plant height (288 cm), while accession 24 (DH0050) showed the lowest (84 cm). The largest amount of corms (1309 g) was recorded in accession 2 (DH0028) with the lowest (62 g) was noted in accession 48 (DH0080), respectively (Table 3). These results indicated that a significant morphological diversity was observed among the Ubi gadong germplasm collections. Correlation analysis was also done on the two parameters used by Pearson correlation (R2) on recorded data once every two months: the cumulative analysis results of Records I, II III, IV and Record V are displayed in Table 4.
Average corm weight and plant height of 48 Ubi gadong accessions.
| No. | Accession | The average data for the whole record | Weight (g) |
| Height (cm) | |||
| 1 | DH 0027 | 173.00 j–n | 434.00 cd |
| 2 | DH 0028 | 245.00 bc | 1309.00 a |
| 3 | DH 0029 | 165.00 l–p | 177.00 p–s |
| 4 | DH 0030 | 184.00 h–k | 243.00 j–n |
| 5 | DH 0031 | 131.00 tu | 219.00 l–p |
| 6 | DH 0032 | 116.00 uv | 110.00 u–x |
| 7 | DH 0033 | 180.00 h–l | 216.00 l–p |
| 8 | DH 0034 | 166.00 l–o | 109.00 u–x |
| 9 | DH 0035 | 254.00 b | 206.00 m–q |
| 10 | DH 0036 | 150.00 o–s | 98.00 v–x |
| 11 | DH 0037 | 214.00 de | 352.00 ef |
| 12 | DH 0038 | 185.00 g–k | 444.00 c |
| 13 | DH 0039 | 148.00 p–t | 448.00 c |
| 14 | DH 0040 | 194.00 f–h | 278.00 g–k |
| 15 | DH 0041 | 186.00 g–k | 305.00 f–h |
| 16 | DH 0042 | 184.00 h–k | 187.00 o–r |
| 17 | DH 0043 | 201.00 e–g | 653.00 b |
| 18 | DH 0044 | 226.00 d | 136.00 s–w |
| 19 | DH 0045 | 144.00 r–t | 118.00 t–w |
| 20 | DH 0046 | 146.00 q–t | 203.00 n–q |
| 21 | DH 0047 | 227.00 d | 255.00 h–m |
| 22 | DH 0048 | 195.00 f–j | 313.00 g–j |
| 23 | DH 0049 | 147.00 q–t | 135.00 s–w |
| 24 | DH 0050 | 84.00 w | 103.00 v–x |
| 25 | DH 0051 | 288.00 a | 284.00 g–j |
| 26 | DH 0052 | 187.00 h–k | 275.00 g–k |
| 27 | DH 0053 | 189.00 f–j | 252.00 i–n |
| 28 | DH 0054 | 186.00 g–k | 300.00 g–i |
| 29 | DH 0055 | 138.00 st | 185.00 o–s |
| 30 | DH 0056 | 163.00 m–q | 260.00 h–l |
| 31 | DH 0057 | 223.00 d | 242.00 j–n |
| 32 | DH 0058 | 224.00 d | 424.00 cd |
| 33 | DH 0059 | 180.00 h–m | 234.00 j–o |
| 34 | DH 0060 | 192.00 f–i | 619.00 b |
| 35 | DH 0061 | 230.00 cd | 626.00 b |
| 36 | DH 0062 | 143.00 r–t | 391.00 de |
| 37 | DH 0063 | 170.00 k–n | 136.00 s–w |
| 38 | DH 0064 | 145.00 r–t | 214.00 l–o |
| 39 | DH 0070 | 103.00 v | 115.00 t–w |
| 40 | DH 0071 | 174.00 i–n | 253.00 h–n |
| 41 | DH 0072 | 158.00 o–r | 86.00 wx |
| 42 | DH 0073 | 184.00 h–k | 161.00 q–t |
| 43 | DH 0074 | 205.00 ef | 238.00 j–n |
| 44 | DH 0075 | 252.00 b | 147.00 r–u |
| 45 | DH 0077 | 195.00 f–h | 232.00 k–o |
| 46 | DH 0078 | 247.00 b | 315.00 fg |
| 47 | DH 0079 | 163.00 m–q | 163.00 q–u |
| 48 | DH 0080 | 102.00 v | 62.00 x |
Pearson correlation analysis data among two parameters.
| Month | Pearson R2 value | Significant |
| February–I | −0.124 | 0.546 |
| April–II | 0.235 | 0.248 |
| June–III | 0.131 | 0.395 |
| August–IV | 0.271 | 0.065 |
| October–V | 0.522 | 0.000 |
Pearson values above 0.3 (R2 > 0.3) show a strong correlation between the two parameters. The correlation between tall plants and bulbs in February, April, June and August was not significant when compared to the month of October, when the corm weight and height data were significant in the early stages of growth, the plants began to adapt to the new environment, and the chemical productivity or physiological activity was low (Table 4). The average of all measured data readings and Pearson values equal or same with 0.367 are significant. This shows that the corm weight and the height of the plants have a strong and positive correlation. The relationship between measured value and accessions plotted in a scatter graph, using SPSS statistical software 17, is shown in Fig. 2.
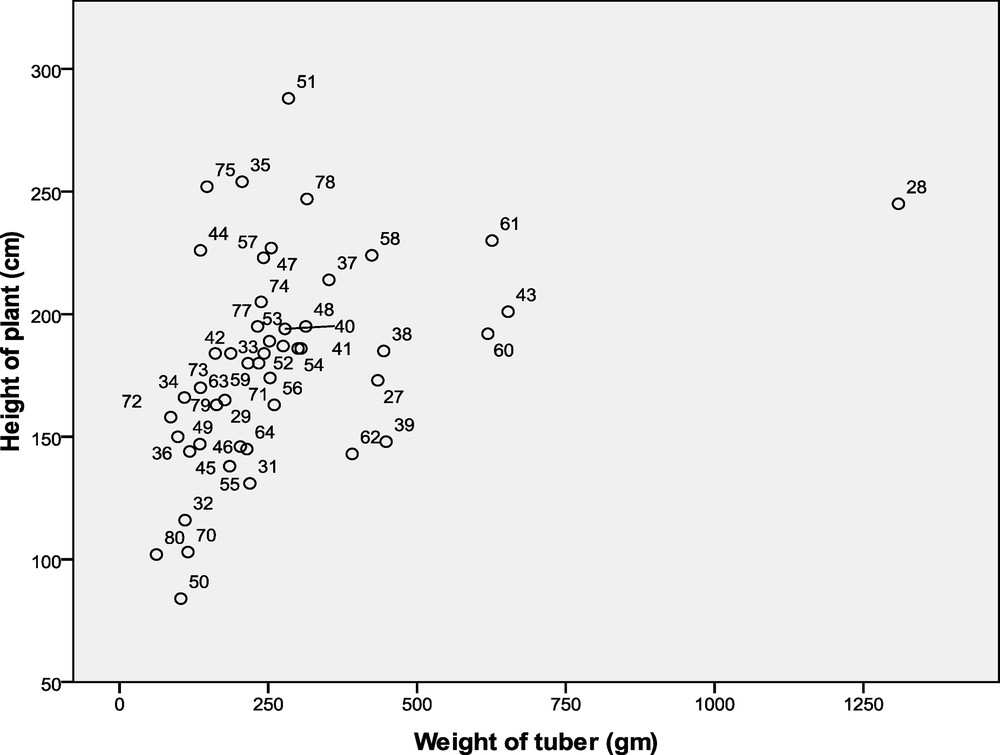
Scatter graph for the average data record.
3.2 ISSR marker validation and amplification of DNA
The proficient and consistent use of molecular markers such as ISSR for the study of genetic diversity in any food crop or tree crop requires the selection and application of primers that will give clear, distinct, reliable, and sufficient information needed to study the divergence that occurs within the crop [8]. In our research, the number of polymorphic loci detected per primer combination varies according to the primer. ISSR markers amplified distinct band patterns among the 48 D. hispida accessions and revealed polymorphism.
In this study, only three primers (ISSR4, ISSR5 and ISSR8) out of 12 ISSR primers showed polymorphism; this has proved the suitability of those ISSR markers for the diversity analysis of Ubi gadong germplasm collections. Table 5 shows the primer selections made based on the temperature of molecular markers on different plates. The sizes of the amplicons ranged from 300 to 1610 bp, among which the ranges of amplicons for ISSR4 was 415–1538, for ISSR5 was 306–1500 and for ISSR8 was 320–1610, respectively (Fig. 3 and Table 6). A total of 39 alleles were identified, and 22 (56.41%) of them were polymorphic (Fig. 3 and Table 6). Individually, the percentage of polymorphic bands produced by ISSR4 was 38.5%, by ISSR5 83.3%, and by ISSR8 50% (Table 6). Overall, the diversity of amplification paths for ISSR4 and ISSR8 was lower than for ISSR5 markers (Table 6).
Selection of appropriate molecular markers managed to strip DNA amplification for Ubi gadong accession study.
| No. | Code | Sequences | Gilding temperature (°C) | Amplification | |||
| 54 | 55 | 60 | 64 | ||||
| 1 | ISSR1 | CTCTCTCTCTCTCTCTAGT | No amplification path | ||||
| 2 | ISSR2 | GTCGTCGTCGTCGTCGTC | No amplification path | ||||
| 3 | ISSR3 | GTGCGTGCGTGCGTGC | No amplification path | ||||
| 4 | ISSR4 | ACACACACACACACACT | √ | 3 amplification | |||
| 5 | ISSR5 | AGAGAGAGAGAGAGAGCTC | √ | 3 amplification | |||
| 6 | ISSR6 | GTGTGTGTGTGTCC | No amplification path | ||||
| 7 | ISSR7 | CTCTCTCTCTCTCTCTAC | No amplification path | ||||
| 8 | ISSR8 | AGAGAGAGAGAGAGAGTA | √ | 3 amplification | |||
| 9 | ISSR9 | AGAGAGAGAGAGAGAGTC | No amplification path | ||||
| 10 | ISSR10 | CTCTCTCTCTCTCTCTGC | No amplification path | ||||
| 11 | ISSR11 | GAGGAGGAGGAGGC | No amplification path | ||||
| 12 | ISSR12 | CTCTCTCTCTCTCTCTTG | No amplification path |
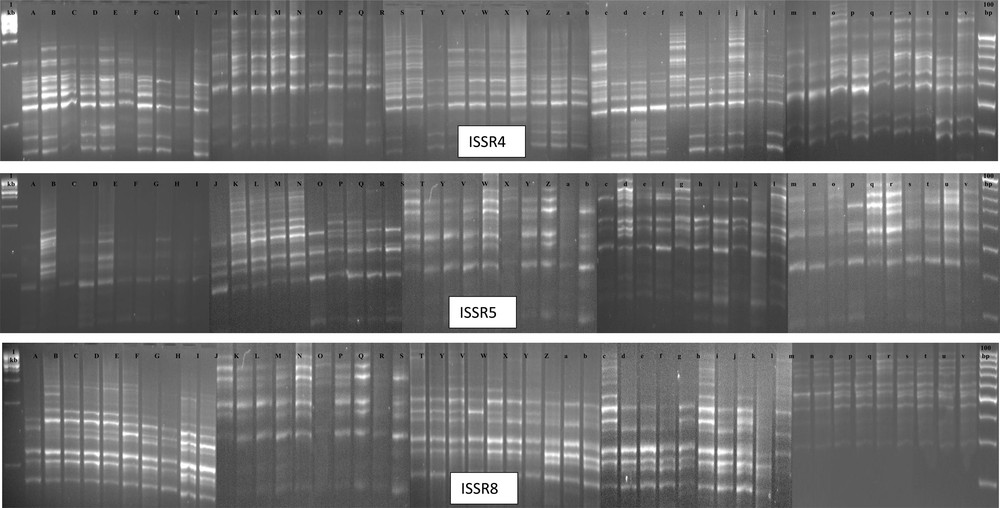
Polymorphic banding patterns of ISSR4, ISSR5 and ISSR8 among all 48 Ubi gadong genotypes. 1st Lane: 1 kb and last lane 100 bp DNA ladder. (A: DH27; B: DH28; C: DH29; D: DH30; E: DH31; F: DH32; G: DH33; H: DH34; I: DH35; J: DH36; K: DH37; L: DH38; M: DH39; N: DH40; O: DH41; P: DH42; Q: DH43; R: DH44; S: DH45; T: DH46; U: DH47; V: DH48; W: DH49; X: DH50; Y: DH51; Z: DH52; a: DH53; b: DH54; c: DH55; d: DH56; e: DH57; f: DH58; g: DH59; h: DH60; i: DH61; j: DH62; k: DH63; l: DH64; m: DH70; n: DH71; o: DH72; p: DH73; q: DH74; r: DH75; s: DH77; t: DH78; u: DH79; v: DH80).
Patterns of inheritance of the Ubi gadong samples used in this study.
| Primers | The size range of amplification (bp) | Total range | Number of lines monomorphic | The number of polymorphic bands | The percentage of polymorphic (%) |
| ISSR 4 | 415–1538 | 13 | 8 | 5 | 38.5 |
| ISSR 5 | 306–1500 | 12 | 2 | 10 | 83.3 |
| ISSR 8 | 320–1610 | 14 | 7 | 7 | 50.0 |
3.3 Cluster analyses
The study of genetic diversity is a critical component of applied plant breeding for optimizing the choice of parents in a crop-breeding program [9,10]. Effective germplasm assessment provides the scientific basis for the selection of parents/donors for recombination breeding or hybrid breeding, and to breed for specific agro-ecological conditions and situations [11]. Diversity analysis at the molecular level using PCR-based markers is the efficient and rapid method for identifying the relationships and/or differences among the genotypes [12]. Among the PCR-based markers, microsatellites are becoming more popular and suitable for large-scale analysis, both for genetic diversity and breeding research [13,14].
The ISSR marker data from the selected primers were subjected to cluster analysis using NTSYS program. The similarity was constructed using the Dice coefficient method. Cluster analysis was done to group the genotypes into dendrogram. From this dendrogram, the 48 Ubi gadong accessions were grouped into 10 major clusters (a cluster analysis using only ISSR3 has been presented here), which clearly represents the highest genetic diversity among Ubi gadong accessions (Fig. 4). Among the 10 clusters, cluster VII, consisting of 19 accessions, is the biggest group among 10 clusters, followed by cluster IX containing 11 accessions, cluster X comprised of eight accessions, cluster VIII with four accessions and cluster I, II, III, IV, V and VI all are composed of one accession only (Fig. 4 and Table 7). Very interestingly, both accessions DH27 and DH28 were collected from the same district and even from the same village, but they group far distant clusters, i.e. they are genetically different. On the other hand, in accessions DH29 to DH64, all those samples were also collected from the same villages under the same district, but due to their vast genetic variation, they are also grouped within different clusters. For other samples, the same results have also been observed (Fig. 4 and Table 7), whereas ISSR5 grouped all 48 accessions into seven different clusters and ISSR8 into eight different clusters, respectively (data not shown).
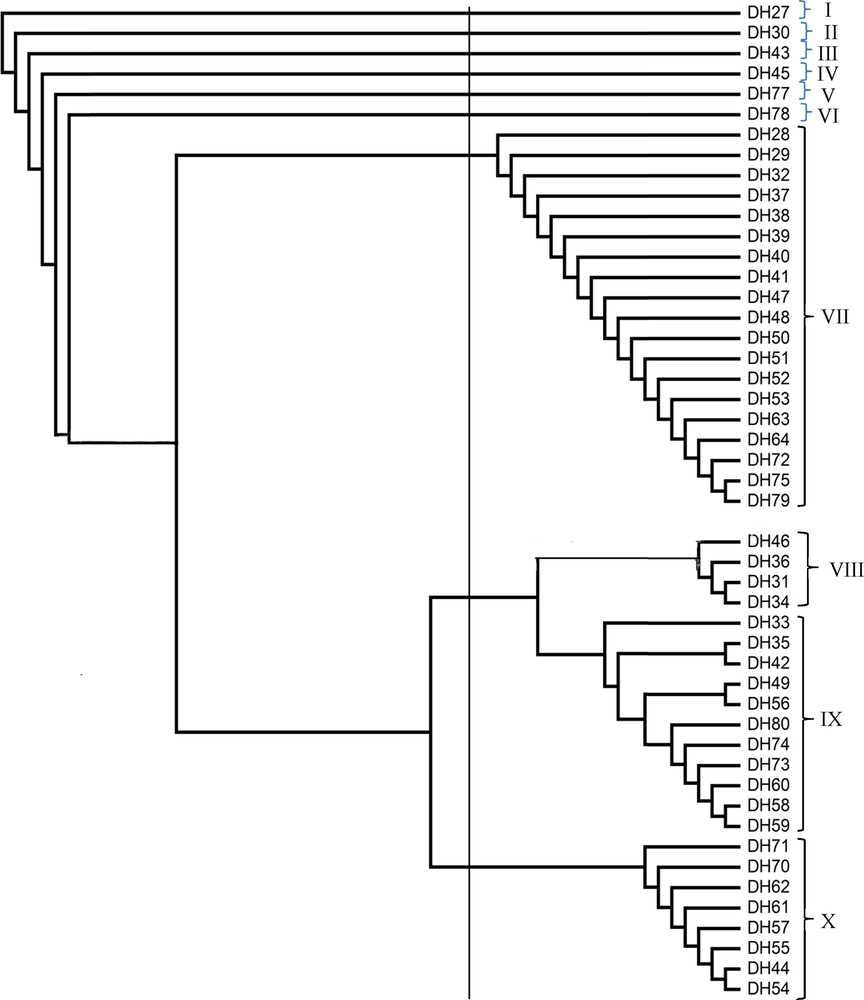
Dendrogram based on the unweighted pari group method with arithmetic average (UPGMA) depicting the genetic diversity among Ubi gadong accessions using ISSR3.
Accessions in their corresponding clusters as shown by the ISSR based dendrogram using UPGMA method.
| Clusters | Accessions |
| Cluster I | DH27 = 1 accessions |
| Cluster II | DH30 = 1 accessions |
| Cluster III | DH43 = 1 accessions |
| Cluster IV | DH45 = 1 accessions |
| Cluster V | DH77 = 1 accession |
| Cluster VI | DH78 = 1 accessions |
| Cluster VII | DH28, DH29, DH32, DH37, DH38, DH39, DH40, DH41, DH47, DH48, DH50, DH51, DH52, DH53, DH63, DH64, DH72, DH75 and DH79 = 19 accessions |
| Cluster VIII | DH31, DH34, DH36 and DH46 = 4 accessions |
| Cluster IX | DH33, DH35, DH42, DH49, DH56, DH58, DH59, DH60, DH73, DH74 and DH80 = 11 accessions |
| Cluster X | DH44, DH54, DH55, DH57, DH61, DH62, DH70 and DH71 = 8 accessions |
4 Conclusions
Genetic diversity in any crop is basically important for improving heterotic crop genotypes over existing ones. The user-friendly nature of ISSR markers was successfully exploited in many crop species for a better understanding of the genetic diversity, domestication process and geographic divergence and distribution. But this is the first report on using ISSR markers to study the genetic diversity on Dioscorea hispida germplasm collections. There was a high level of genetic diversity among accessions of D. hispida in this study, suggesting that ISSR markers were very effective in the detection of polymorphism in this species. To broaden the genetic base and improvement of D. hispida, accession populations having the lowest genetic similarities could be selected as parents. Therefore, hybridization should be made between two distant populations. D. hispida has already proved to be the tuber crops with the highest starch content, being also very rich in vitamins with both micro and macro minerals. Considering all these criteria and the results from marker-assisted diversity analysis, accessions that are far apart based on their genetic coefficient (like DH27 and DH71; DH30 and DH70; DH43 and DH62; DH45 and DH61; DH77 and DH61; DH78 and DH57) could be selected as parents for further breeding programs. This will bring about greater diversity, which will lead to high productive indices in terms of increase in yield and overall quality, and for the ultimate target of sustainable Ubi gadong production.
Acknowledgements
Our sincere thanks and appreciation to the Economic Planning Unit of Terengganu (UPEN) for providing the research grant to Universiti Sultan Zainal Abidin (UniSZA) for carrying out the multi-disciplinary research works on Dioscorea hispida (Ubi Gadong). The authors also sincerely acknowledge the Faculty of Bioresources and Food Industry, School of Agriculture Science and Biotechnology (UniSZA) for the initiative to publish this manuscript.