

1 Introduction
Obesity and type-2 diabetes were frequently risk factors associated with NAFLD/NASH (nonalcoholic fatty liver disease/nonalcoholic steatohepatitis) [1]. Steatosis and resulting steatohepatitis are highly prevalent in the United States. Indeed, the prevalence of NASH could increase by 63% between 2015 and 2030. This pathology will become by 2020 the main cause of liver transplantation [2].
Oxidative stress was considered a key pathological factor of NAFLD progression, so many studies were realized in this direction and were showed promising results, but currently there was no treatment for NAFLD/NASH patients [3]. On the other hand, it seemed that during the progression of steatosis, mitochondrial biogenesis and mitophagy determined the morphology, quality, and abundance of mitochondria; these mechanisms were controlled in response to metabolic stress factors to ensure the adaptation of mitochondrial function to the energy and metabolic needs of cells [4]. In addition, mitochondrial functions were influenced by mitochondrial morphology [5], which was characterized by fusion and fission cycles [6]. Disturbances in the equilibrium of fission and fusion caused rapid changes in the morphology and functions of mitochondria [7]. According to [8], the variability of mitochondrial morphology depended nutritional conditions and energy requirements of each cell type.
On the other hand, much research were conducted in patients and animal models of NASH to understand the mechanisms of the immune system involved in the progression of NAFLD to NASH to cirrhosis, including innate immunity and adaptive immunity induced by T and B lymphocytes [9]. Inflammatory responses favored the activation of hepatic stellate cells by collagen produced in excess, process of scar tissue formation: fibrosis [10].
Despite the high prevalence of NAFLD, targeted therapies were not developed because its pathogenesis was wrongly understood [11]. Most of the mechanisms of NAFLD were studied on animal models, which not showed all the human characteristics of the disease, unlike our animal model, Psammomys obesus. This animal was of particular interest because, as soon as submitted to a standard laboratory diet, which was hypercaloric for him, he developed first an obesity that evolved later to a diabetic syndrome comparable to clinical diabetes [12]. P. obesus was an experimental model of prime importance for a better approach to human diabetes [13].
The aim of this study was to show, for the first time in an animal model, P. obesus, submitted to SD for nine months, the involvement of oxidative and metabolic stress in the mitochondrial reshuffle during the pathogenesis of steatosis. It appeared that these mitochondrial dynamics was disturbed and altered with the evolution and complications of the disease by the occurrence of other mechanisms, namely, inflammation and fibrosis. Consequently, knowledge of the occurrence of each mechanism at the appropriate time was a key factor in determining therapeutic efficacy.
2 Matériels and methods
2.1 Animals and diets
Forty adult males P. obesus were captured in the semi-desert region of Beni-Abbes (30°7′ north latitude and 2°10′ west longitude). These animals were transferred to the laboratory, separated individually and submitted to a two-week acclimation period (25 °C, 70% hygrometry, and a 12-h light-dark cycle). The animals were fed a natural diet of halophyte plants. P. obesus individuals were divided into two groups:
- • a control group (n = 20): fed a natural diet (Salsola foetida and Atriplex halimus) (50 g/day/animal, equivalent to 30–32 kcal). The plants represented a low-calorie diet;
- • an experimental group (n = 20): were received a standard laboratory diet (SD) that constituted a high-energy diet, (15–20 g/day/animal, equivalent to 52–70 kcal) and allowed free access to salt water (NaCl 0.9%) [14]. Its composition was presented in Table 1.
Composition of the nutrients contained in the natural diet (ND) and the standard laboratory diet (SD).
| Diet composition (%) | ND | SD |
| Proteins | 3.5 | 0.3 |
| Casein | – | 20 |
| Lipids | 0.4 | 5 |
| Carbohydrates | 2.5 | 58.7 |
| Sucrose | – | 5 |
| Cellulose | 6 | 5 |
| Minerals | 6.8 | 4 |
| Vitamins | – | 2 |
| Water | 80.8 | – |
These animals were submitted to SD for 9 months and, at intervals of 3 months (0 month, 3 months, 6 months, and 9 months), five Psammomys were sacrificed. Zero month corresponds to the period before the start of the experiment. P. obesus, weighed, were sacrificed humanely after having fasted for 18 h. The blood was collected into heparinized tubes. The relative weights of the liver and of the visceral adipose tissue were determined. The livers were rinsed with cold 0.9% NaCl and cut. One part of the liver was fixed in 10% formalin for histopathological investigations and for immunohistochemical studies. The other part was frozen in liquid nitrogen and then stored at −80 °C for later use in biochemical studies.
The treatment of all the animals was in conformity with Directive 86/609/EEC, which regulates the use of animals for experimental and other scientific purposes, which was adopted in the EU in 1986 (EU Directive, 2010) [15].
2.2 Study of the biochemical parameters
After animals were killed, plasma was separated by centrifugation at 3000 g for 10 min and used for the estimation of glucose, insulin, triglycerides, and total cholesterol.
The glucose content was determined by the oxidase-peroxidase (GOD-POD) enzymatic method [16], whereas the insulin level was measured by radioimmunoassay (Wide & Porath's method [17]). The plasma triglycerides and the total cholesterol were estimated, respectively, by the enzymatic method using the Monozyme diagnostic kit [18] and the Siedel method [19].
2.3 Evaluation of hepatic oxidative stress
2.3.1 Preparation of liver homogenates
Of the liver, 0.1 g was homogenized in a phosphate buffer solution at pH = 7.4 (1:9 w/v). The homogenates were centrifuged first at 1000 g for 5 min at 4 °C, followed by a second centrifugation at 1000 g for 30 min at 4 °C. The supernatants were used to evaluate malondialdehyde (MDA), glutathione reduced (GSH), and total proteins.
2.3.2 Measurement of lipid peroxidation
Lipid peroxidation was determined by the method of Ohkawa et al. (1979), which consists in evaluating the interaction by the reaction malonyldialdehyde (MDA)–thiobarbituric acid (TBA); this reaction formed a colored complex detected by spectrophotometrical measurement of the absorbance at 535 nm [20].
2.3.3 Measurement of glutathione (GSH)
The level of GSH was evaluated by the colorimetric technique as mentioned by Ellman [21], based on the oxidation reaction of GSH with 5,5′-dithio-bis-(2-nitrobenzoic acid) (DTNB) and the release of thionitrobenzoic acid (TNB). The reading of the absorbance was made at 412 nm and the quantity of GSH was expressed as nanomoles of GSH per milligram of protein.
2.3.4 Determination of total protein
The total protein content in hepatic homogenates was evaluated by Bradford's method; bovine serum albumin was used as a standard [22].
2.4 Histopathological study
After fixation in formalin, dehydration and incorporation in paraffin, the liver samples were cut to a thickness of 5 μm. The pieces were stained with hemalum-eosin (H&E) and Masson's trichrome [23] for evaluating by light microscopy (Motic SFC-18) the severity of the disease by the progression from steatosis to steatohepatitis to fibrosis and cirrhosis.
2.5 Immunohistochemical analysis
The liver sections were deparaffined, immersed in target unmasking solution and incubated for 40 min at 97 °C. After cooling down to room temperature, the slides were rinsed with distilled water. The sections were delimited by a pen (pap pen bio export), treated with a 3% solution of hydrogen peroxide for 15 min to block the endogenous peroxidase activity; they were then rinsed in PBS buffer (Sigma Aldrich, pH = 7.4, 0.01 M). For the detection of CD3 and CD20, the sections were respectively incubated with anti-CD3 and anti-CD20 mouse monoclonal antibodies (Cell brand, USA) in the dark for 40 min. After washing in tris buffer, the sections were incubated with a secondary antibody for 60 min. The method used was LSAB (Labelled Streptavidin-Biotin) based on the high affinity of streptavidin for biotin. A primary antibody specifically bound to the target antigen was revealed by a secondary antibody (not specific) coupled with biotin (biotinyled). Streptavidin was coupled with an enzyme, horseradish peroxidase (HRP); it will bind to the biotinyled secondary antibody. The activity of peroxidase will induce the staining of a chromogen. The sections were rinsed in tris buffer to remove the excess HRP. 3,3′-diamino-benzidine (Vector Peroxidase DAB substrate kit, USA) was used for 10 min to reveal the binding of the antibody and then washed with distilled water. The sections were counterstained with Mayer hematoxylin for 5 min. The cuts were observed using a photonic microscope (Motic SFC-18) equipped with a camera (hirocam, 5 megapixels) and connected to a laptop.
2.6 Electronic microscopy observation
The liver sections were fixed in two times, a fixing step in a mixture of 4%glutaraldehyde–2%paraformaldehyde diluted in 0.1 M Sorensen buffer at pH 7.1 for 2 h at 4 °C, then a post-fixing step in a 1% solution of osmium tetroxide during 1 h at 4 °C. The pieces were embedded in epoxy resin 812 [24]. After the contrast ultrathin cuts, the observation was realized with Jeol 1400 and Jeol 1200 EX transmission electron microscopes.
2.7 Statistical analysis
All the results were analyzed statistically by the Student t-test. The means of the individual values was calculated for each series and for each parameter; it was followed by the value of the standard error at the mean “ESM”. P < 0.05 was considered significant.
3 Results
3.1 Effects of SD on the weight and the metabolic parameters
Compared to the control group, the P. obesus fed to the standard diet were subject to profound changes in weight, during the first six months, to a development of the metabolic syndrome with a significant increase (P < 0.0001) of the body weight, of the relative weight of the liver and of the visceral adipose tissue. However, beyond the sixth month until the end of the experiment, their weight decreased considerably.
Concerning the metabolic parameters, in the experimental group, blood glucose (P < 0.0001), cholesterolemia (P < 0.0001), and triglycerides increased significantly, while insulin levels increased (P < 0.0001) in the sixth month to decrease in the ninth month (Table 2).
Evolution of the weight and metabolic parameters in control (C, n = 5) and experimental groups (SD, n = 5) groups of Psammomys obesus. (SD: standard diet).
| Parameters | Groups | 0 month | 3 months | 6 months | 9 months |
| Body weight (g) | C | 92.60 ± 2.25 | 93.77 ± 2.45 | 93.89 ± 2.87 | 94.38 ± 3.32 |
| SD | 90.24 ± 2.43 | 129.56 ± 5.87*** | 148.54 ± 5.64** | 78.12 ± 1.32 | |
| Liver weight/body weight (g) | C | 3.32 ± 0.11 | 3.39 ± 0.15 | 3.43 ± 0.19 | 3.38 ± 0.17 |
| SD | 3.27 ± 0.09 | 5.89 ± 0.06*** | 6.54 ± 0.07** | 4.70 ± 0.08** | |
| VAT weight/body weight (g) | C | 0.27 ± 0.01 | 0.29 ± 0.02 | 0.31 ± 0.02 | 0.30 ± 0.01 |
| SD | 0.25 ± 0.01 | 1.67 ± 0.06**** | 2.54 ± 0.07** | 0.23 ± 0.02 | |
| Blood glucose (g/L) | C | 0.61 ± 0.04 | 0.63 ± 0.03 | 0.67 ± 0.04 | 0.64 ± 0.02 |
| SD | 0.60 ± 0.10 | 1.24 ± 0.11*** | 1.81 ± 0.22*** | 2.28 ± 0.26** | |
| Insulin (mUI/mL) | C | 33.7 ± 8.68 | 34.4 ± 7.56 | 33 ± 9.4 | 34.2 ± 3.39 |
| SD | 28.33 ± 3.63 | 281.66 ± 40.77*** | 385.5 ± 40.36** | 56.66 ± 36.6 | |
| Triglycerides (g/L) | C | 0.65 ± 0.13 | 0.67 ± 0.09 | 0.66 ± 0.11 | 0.68 ± 0.08 |
| SD | 0.60 ± 0.21 | 2.04 ± 0.32*** | 2.6 ± 0.32** | 3.17 ± 0.22** | |
| Cholesterol (g/L) | C | 0.64 ± 0.05 | 0.66 ± 0.66 | 0.63 ± 0.05 | 0.65 ± 0.03 |
| SD | 0.61 ± 0.04 | 1.37 ± 0.19** | 1.70 ± 0.16*** | 2.25 ± 0.15** |
** P < 0.01.
*** P < 0.001.
**** P < 0.0001 SD compared with the C group.
3.2 Effect of SD on the oxidative stress of liver tissue
The effect of a high calorie diet on the lipid peroxidation (MDA) content was manifested by a significant increase (P < 0.01) on the third month of SD. The content of MDA continued to increase (P < 0.0001) until the end of the experiment. On the other hand, the GSH (reduced glutathione) level increased slightly (3 months of SD: 0.0822 ± 0.002 μmol/mg protein) vs. (0 month: 0.0701 ± 0.005 μmol/mg protein) to drop brutally at the sixth and ninth months of experimentation. The activities of GSH and MDA were unchanged in the control group (Fig. 1).
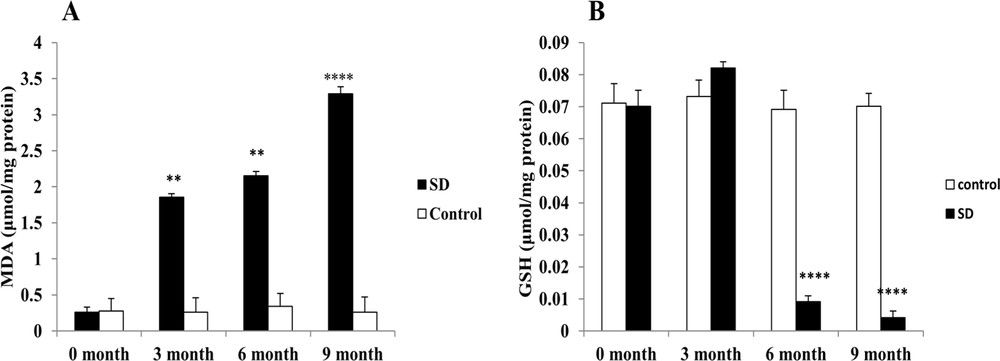
Evaluation of the intrahepatic oxidative stress. MDA (A) and GSH (B) levels, respectively, were measured in the frozen liver homogenate of Psammomys obesus submitted to SD.** P < 0.01. **** P < 0.0001 versus to the control group.
3.3 Histopathology
The analysis of the histological sections of the liver throughout the experiment allowed us to follow the evolution of the disease compared to controls (Fig. 2). The liver of the controls presented a normal lobular architecture. Each lobule was composed by hepatocytes that converge towards the central vein (Fig. 2A). In the third month of SD, hepatocytes were loaded with lipids in micro and macro vesicular form: the steatosis stage (NAFLD) (Fig. 2B). In the sixth month of SD, the liver sections showed a complication of steatosis by infiltration of the inflammatory cells at the lobular and portal levels, with the onset of fibrosis (Fig. 2C). Inflammatory clusters were composed essentially of lymphocytes and neutrophils (Fig. 2D). In the ninth month of SD, Masson's trichrome staining showed fibrosis progression in NASH with lobular, perisinusoidal fibrosis and collagen fibers in green located between vacuolated hepatocytes (Fig. 2E). At this stage, we observed an alteration of the portal vein by progression of the fibrotic process and septum formation. Septa contain inflammatory cells. We suggested that it is due to the installation of cirrhosis (Fig. 2F).
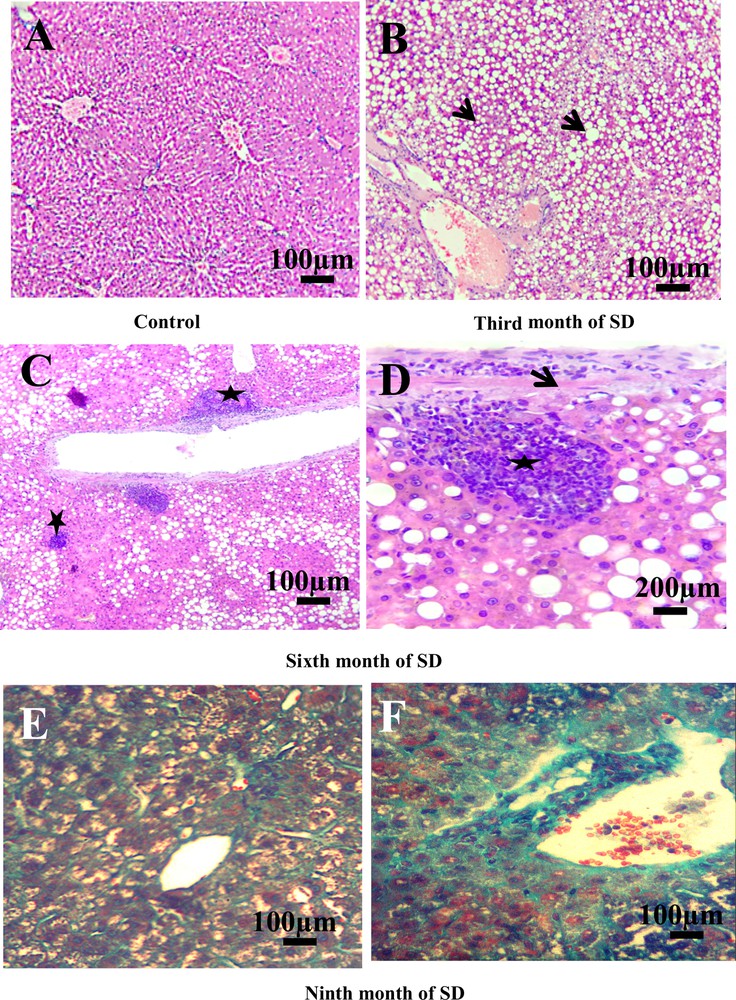
Histopatology of the liver. A. Liver of control groups stained with hemalum–eosin (H&E) (scale bar = 100 μm). B. Nonalcoholic fatty liver disease. Microvesicular and macrovesicular fatty degeneration of hepatocytes (arrows). No inflammation, no fibrosis (H&E) (scale bar = 100 μm). C. Hepatocyte ballooning and portal and lobular inflammatory infiltrate (stars) (H&E) (scale bar = 100 μm). D. Detail of inflammatory cells (star) and early fibrosis (arrow) (H&E) (scale bar = 200 μm). E. Perisinusoid and lobular fibrosis with collagen fibers (in green) and vacuolization of hepatocytes (Masson's Trichrome). F. Portal fibrosis and installation of cirrhosis (Masson's Trichrome) (scale bar = 100 μm). Masquer
Histopatology of the liver. A. Liver of control groups stained with hemalum–eosin (H&E) (scale bar = 100 μm). B. Nonalcoholic fatty liver disease. Microvesicular and macrovesicular fatty degeneration of hepatocytes (arrows). No inflammation, no fibrosis (H&E) (scale bar = 100 μm). C. Hepatocyte ballooning and portal and lobular inflammatory ... Lire la suite
3.4 Effect of SD on lymphocytes infiltration: immunoreactivity of CD3 and CD20
In the control group, we noted the absence of membrane staining of the T lymphocytes (CD3) throughout the experiment, which allowed us to evidence the absence of inflammatory process in this group (Fig. 3A). On the other hand, in this same control group, CD20 labeling was found to be weakly positive in the cytoplasm and the membranes of the B lymphocytes (Fig. 4A), due to the normal presence of B lymphocytes in liver tissue. By contrast, after the third month of SD, a positive expression of CD3 and CD20 at the sinusoid level was revealed (Figs. 3B, 4B) and, at the 6th month of SD, we observed an immunostaining at the level of the central vein and an increased marking intensity at the sinusoids (Figs. 3C, 4C). In the ninth month of SD, the expression of CD3 and CD20 was strongly positive in the whole of the hepatic parenchyma, which lost its structural architecture (Figs. 3D, 4D).
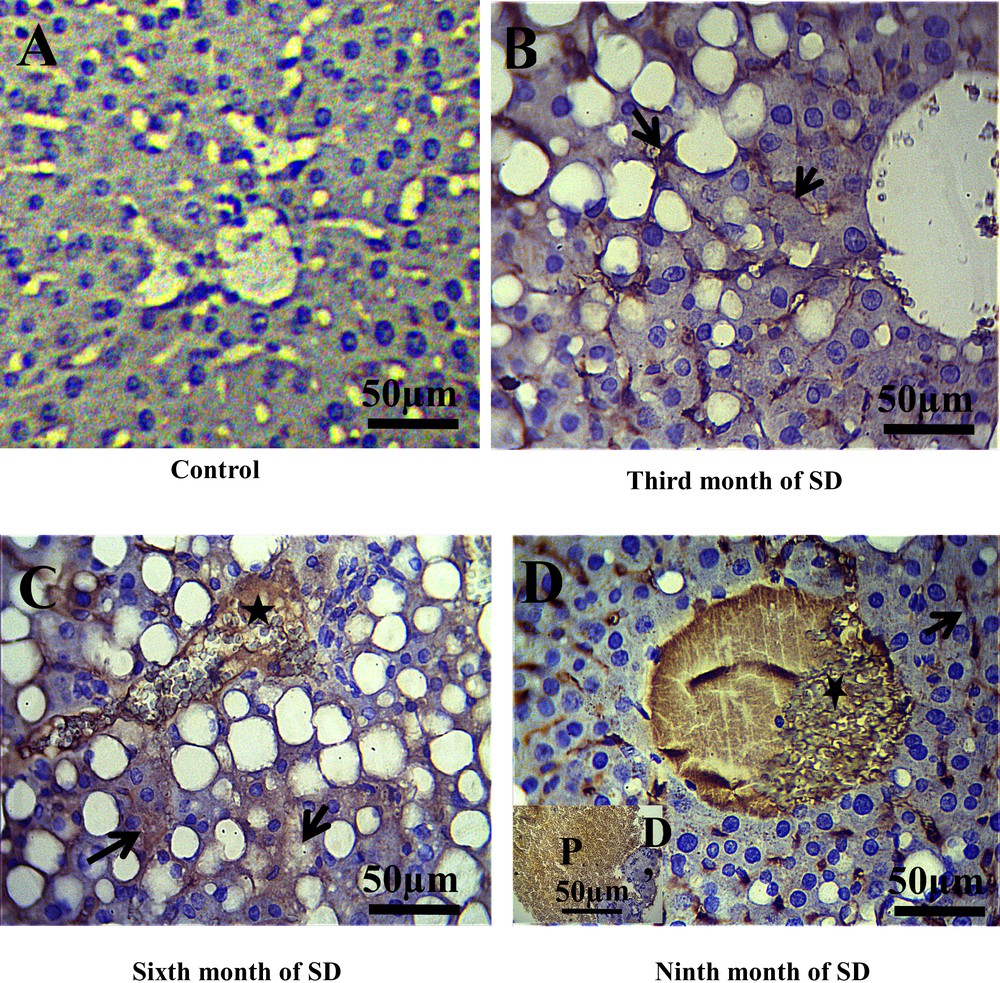
Immunohistochemical staining of CD3 (T lymphocytes membranes) in the liver of Psammomys. A. Absence of CD3 immunostaining in the control groups. B. At the third month of SD, CD3 immunostaining was revealed to be positive at the sinusoids situated between hepatocytes cords (arrows). C. At the sixth month of SD, immunostaining in the central vein was observed (star) and an increase immunoreactivity of CD3 in the parenchyma hepatic was noted (arrows). D–D′. At the 9th month of SD, CD3 was highly expressed in the liver parenchyma, the central vein (D) and portal (D′) (scale bar = 50 μm). Masquer
Immunohistochemical staining of CD3 (T lymphocytes membranes) in the liver of Psammomys. A. Absence of CD3 immunostaining in the control groups. B. At the third month of SD, CD3 immunostaining was revealed to be positive at the sinusoids situated between hepatocytes ... Lire la suite
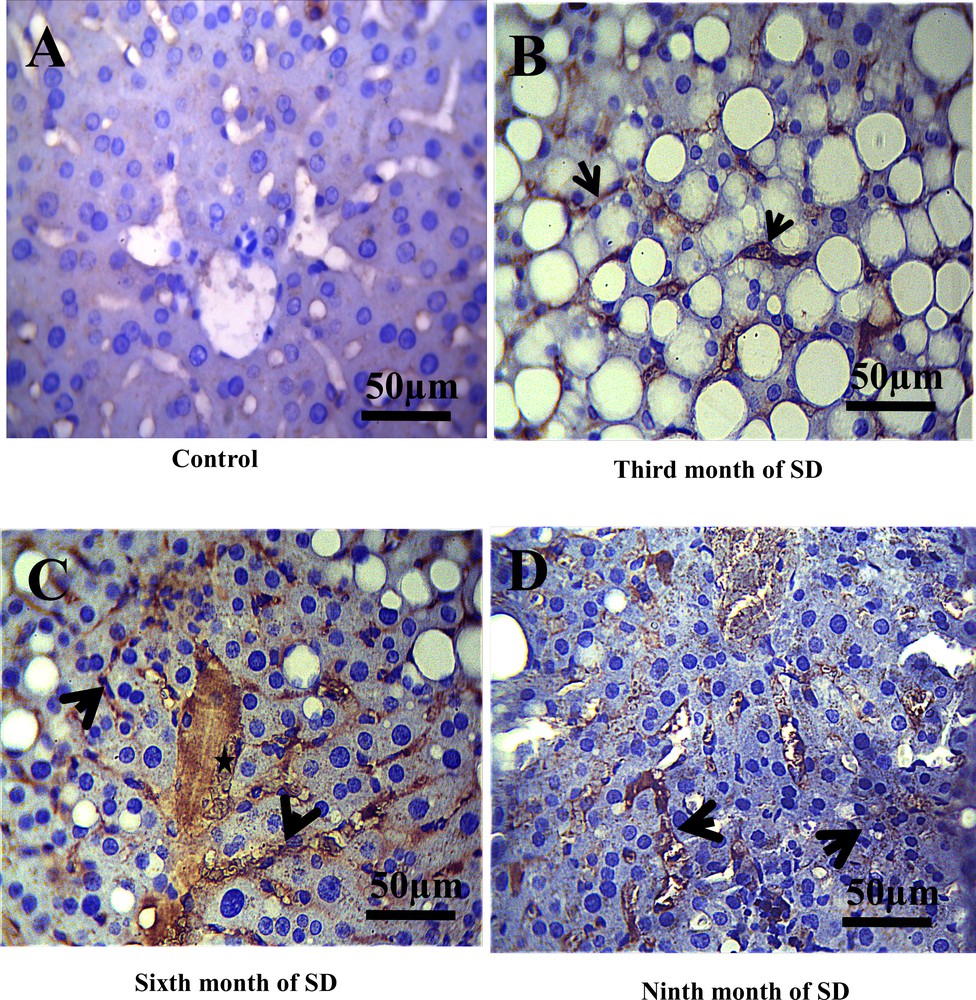
Immunohistochemical staining of CD20 (B- lymphocytes cytoplasmic and membranes) in the liver of Psammomys obesus. A. Immunoreactivity of CD20 in control groups was revealed to be weakly positive. B. In the third month of SD, immunoreactivity of CD20 at the level sinusoids was evidenced. C. In the sixth and ninth month of SD (D), we noted an increase in the immunostaining of CD20 in the whole of the hepatic parenchyma, the central vein (star), the portal and sinusoids (arrows) (scale bar = 50 μm).
3.5 Electron microscopy analysis of mitochondrial morphology in the pathology and progression of NAFLD
3.5.1 In NAFLD, mitochondria protect the hepatocytes
The mitochondria of the hepatocytes in the control groups presented a homogeneous distribution in the cytoplasm with elongated and rounded forms (Fig. 5A). These mitochondria were composed of a very electron-dense matrix, and an inner membrane formed thin and clear lamellar crests (Fig. 5B). In the third month of SD, the mitochondria changed shape and grouped together in a network near lipid vacuoles (Fig. 5C). According to the observations, our results suggest that mitochondria protected hepatocytes against excessive deposition of lipid vacuoles.
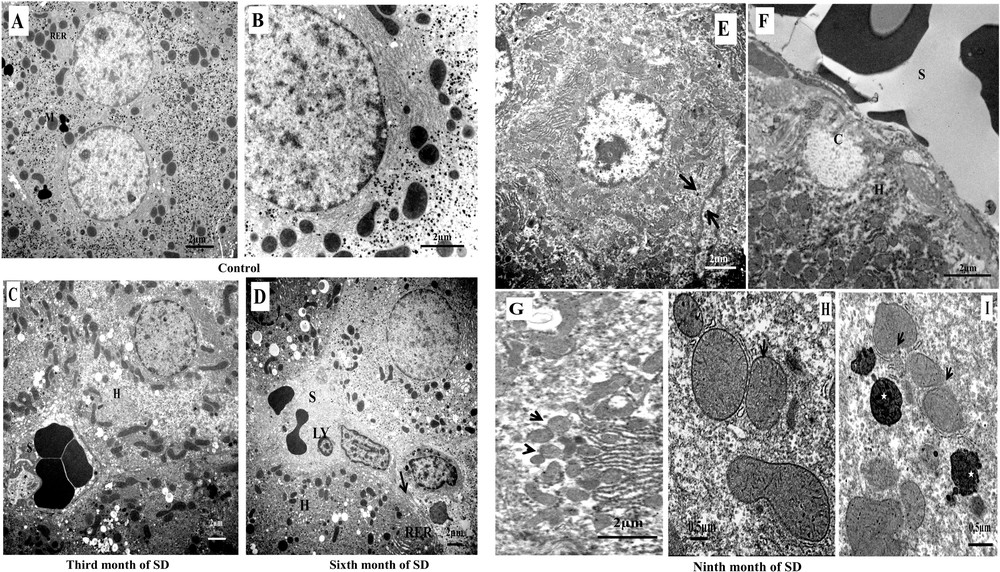
Electron microscopy analysis of hepatocytes mitochondria in the progression from steatosis to steatohepatitis to cirrhosis. In the group of controls. A. Distribution of mitochondria (M) and granular endoplasmic reticulum (RER). B. Typical structure of the mitochondria of Psammomys obesus livers subjected to the natural diet. C. Mitochondria in NAFLD, grouping of mitochondria of different forms in proximity to lipid vacuoles, hepatocyte (H), and sinusoid (S). D. Mitochondria in the progression from NAFLD to NASH, numerous mitochondria at the sinusoidal poles of hepatocytes (H), lymphocyte infiltration (LY), healing of the plasma membrane of hepatocytes with a deposit of collagen (arrow) (scale bar = 2 μm). Transmission electron micrographs showing the effect of progression of NASH in mitochondria alteration. E. Hepatocytes lost their adhesions (arrows) with nuclear pyknosis and mitochondria invaded the hepatocyte cytoplasm (scale bar = 2 μm). F. The sinusoidal (S) pole of the hepatocytes was obstructed by a collagen armature (C). In the cytoplasm of hepatocytes (H), numerous and small mitochondria were accumulated. (Scale bar = 2 μm). G. Electron micrograph of suspected mitochondrial fusion/fission in hepatocyte (arrows) (scale bar = 2 μm). H. Mitochondria with fragmentation and rupture of crests membranes (arrow) and a less dense matrix compared to controls (scale bar = 0.5 μm). I. Rupture of the mitochondrial membrane (arrows) and formation of an autophagosome by the rough endoplasmic reticulum membrane: mitochondria in the process of degradation. The cytoplasm contained de numerous electron-dense vacuoles (asterisk) (scale bar = 0.5 μm). Masquer
Electron microscopy analysis of hepatocytes mitochondria in the progression from steatosis to steatohepatitis to cirrhosis. In the group of controls. A. Distribution of mitochondria (M) and granular endoplasmic reticulum (RER). B. Typical structure of the mitochondria of Psammomys obesus livers subjected ... Lire la suite
3.5.2 Mitochondria in the progression from NAFLD to NASH
In the sixth month of the SD, the mitochondrial network was localized at the sinusoidal poles; in that area, it was noted, on the one hand, a rupture of the plasma membranes of hepatocytes (necrosis) and, on the other hand, an excessive deposit collagen: healing layers of altered plasma membranes (fibrosis). In the sinusoidal lumen, we showed lymphocyte infiltration, i.e. inflammation (Fig. 5D). Our result suggested that lipid peroxidation and damaged mitochondria were related directly and/or indirectly to necro-inflammation-fibrosis mechanisms.
3.5.3 Alterations and morphological changes of mitochondria in NASH progression
In the ninth month of SD, the number of mitochondria increased dramatically; they invaded the cytoplasm of the hepatocytes. At this stage, we observed the disruption of inter-hepatocyte adhesion function (Fig. 5E) and the isolation of hepatocytes by formation of a collagen barrier (Fig. 5F). The small mitochondria of various forms were suspected of fission/fusion reaction process (Fig. 5G). The detailed observation of the mitochondria showed a change in the matrix structure and an alteration by fragmentation of the inner membrane of the crests (Fig. 5H). The defective mitochondria lost the contents of the matrix by rupture of the mitochondrial membranes. These mitochondria were surrounded by granular endoplasmic reticulum membranes and destined to degradation (mitophagy) (Fig. 5I). These observations suggested that mitochondria reacted by activation of the fission/fusion process and by removal of the damaged mitochondria.
4 Discussion
In this study realized on the liver of an animal model, P. obesus, when submitted to SD, develops NAFLD, which is complicated with the persistence of this regime, hypercaloric for this animal. In the present study, we established, for the first time, the relationship between obesity, oxidative stress, inflammation, and fibrosis, as well as their actions on the morphological changes in mitochondria, by observing mitochondria at different stages: NAFLD, inflammatory NASH, fibrosis, and cirrhosis. Our results showed that, when P. obesus was exposed to conditions approaching its biotope, it never developed any pathology, but when exposed to SD, it developed obesity, hyperglycemia, hyperinsulinemia, and dyslipidemia. These metabolic disturbances were due to diabetic stress after an abrupt change in the diet [25,26]. In the third month of SD, on the liver sections, we noted an accumulation of lipid vacuoles in the cytoplasm of the hepatocytes. According to [27], the accumulation of lipids in the hepatocytes was a consequence of an imbalance between a large influx of fatty acids through diet, lipolysis of fatty tissues and hepatic lipogenesis, and a decrease in the elimination and oxidation of fatty acids. On the other hand, our results corroborated the work of [11], which showed that P. obesus was an animal model of NAFLD/NASH that perfectly mimicked the hepatic manifestation of the metabolic syndrome in humans. Our cytological sections of the hepatocytes showed a change in the form and organization of the mitochondria. The latter were grouped in a network nearby the lipid vacuoles. We suggested that this mitochondrial reorganization intervened to protect hepatocytes from the deleterious effects of hepatic free fatty acids (FFAs). Indeed, according to [28], under the conditions of a metabolic change by release of an excess of FFAs, the mitochondria intervened to overcome this lipid charge by stimulation of the mitochondrial fatty acid oxidation, the induction of the cycle of tricarboxylic acid, and the stimulation of oxidative phosphorylation. These data explained our results through the formation of the mitochondrial network–lipid vacuoles complex. In addition, according to [29,30], AMPK (adenosine monophosphate-activated protein kinase) reduces the hepatic triglyceride content by inhibiting lipid synthesis and stimulating beta-oxidation mitochondrial of fatty acids. Earlier work [31] showed that, in obese patients, excess fatty acid will be used as a substrate and oxidized by hepatic mitochondria. These last will release reactive oxygen particles. Indeed, according to [32,33], mitochondria were the main site for the formation of reactive oxygen species (ROS). At this experimental stage, in the third month of SD, the results of dosage of liver oxidative stress showed an increase in the lipid peroxidation rate (MDA). These results were explained by the auto-oxidation of lipids, which were probably induced by obesity or hyperglycemia or both [34]. In parallel, we noted a slight increase in the antioxidant (GSH) levels in the experimental group compared to controls. This increase was probably a positive form of regulation to accelerate the use of fatty acids by mitochondria. Our suggestion was confirmed by [35]; indeed, glutathione (GSH) treatment of patients with dyslipidemia significantly reduced triglyceride and non-esterified fatty acid levels.
In the sixth month of SD, our results showed a strong decrease in the rate of the antioxidant GSH versus a high level of oxidant (MDA). According to [36], the overproduction of reactive oxygen species can directly deplete antioxidant molecules such as glutathione (GSH). In addition, many studies realized on type-1 and 2 diabetic patients showed that a significant decrease in antioxidant capacity was indicative of the onset of oxidative stress and of lipid peroxidation production [37]. Electron microscopic observation of hepatocytes at this stage of experimentation showed alteration and rupture of the hepatocyte membranes at the sinusoidal poles. According to [38,39], the peroxidation of membrane lipids modified the physical properties of lipid bilayers, in particular the fluidity and permeability of the membrane. In fact, in vitro studies on the oxidation of lipid monolayers demonstrated that the resulting lysophospholipids were easily solubilized in the cytosol [40]. In addition, experimental studies confirmed that the entire oxidized chain could protrude into the aqueous phase, thus allowing recognition of macrophages [41]. Indeed, our results on histological sections showed an infiltration of the immune cells, resulting in portal and lobular inflammation. In parallel, labeling with CD3 and CD20 revealed the presence of humoral (B lymphocytes) and cellular (T lymphocytes) immune cells. Using a mouse model subjected to MCD (methionine choline deficiency), [42] showed that oxidative stress can contribute to the progression of NASH by stimulating the humoral and cellular immune responses. In this regard, many studies proved that lipid peroxidation products from oxidation of phospholipids can induce humoral and cellular immune responses by forming immunogenic adducts by interaction with cellular proteins [43]. Studies in adults and children with NAFLD/NASH revealed the presence of circulating antibodies against lipid-peroxidation-derived antigens, particularly malonyldialdehyde (MDA) [44,45]. Indeed, according to [46], recognition antigens derived from lipid peroxidation were recognized by hepatic T cells, proving that oxidative stress may be the source of neo-antigens capable of promoting adaptive immune responses. These data were perfectly correlated with our results; we suggest the existence of an interdependence between the increase in the MDA production rate and the over-expression of CD3 and CD20 (T and B lymphocytes). This combination induces the progression of NASH. Additionally, we observed an activity of the stellate cells of the liver, producing an excessive extracellular matrix leading to fibrosis. This was the complication of NASH. According to [47], immune cells and damaged hepatocytes release cytokines that act directly on the stellate cells of the liver, inducing progressive fibrosis. We also found that the mitochondrial network was associated with lipid vacuoles in the process of degradation. Transmission electron microscopic observation allowed us to identify lipid vacuoles in the form of a heterogeneous content autolysosome. This mechanism was called lipophagy by Singh and Cuervo [48]. According to these same authors, lipophagy was a form of regulation of the triglyceride flow that clogs the hepatocytes and causes their alteration. On the other hand, during stress caused by metabolic variations, MDA, and inflammatory cytokines, the cell responded by adapting its metabolism to protect itself and survive through the lysosomal degradation pathway [49]. Our results suggested that lipophagy observed in hepatocytes was a form of cellular adaptation to stress induced by the persistence of SD (six months) and that this mechanism intervened to limit insulin resistance and the effects of lipid peroxidation caused by nutritional stress. Furthermore, the studies showed that the quantity of lipid metabolized by lipophagy varies with extracellular nutrient intake and the cell's ability to degrade lipids by lipophagy [50]. Similar results were reported by [51] on cultured mouse hepatocytes. The results showed that ethanol-induced macroautophagy appeared selective for damaged mitochondria and accumulated lipid droplets. In the ninth month of SD, the increasing number of mitochondria observed under the electron microscope was spectacular. We suggested that mitochondria reacted by dividing to adapt to the different stresses caused by inflammation, the severity of the metabolic syndrome, namely, hyperglycemia, hyperinsulinemia, and hyperlipidemia, as well as the lipid peroxidation, which manifested itself by a high rate of MDA. We observed hepatocytes isolated from their environment by a frame of collagen fibers: fibrosis. Indeed, works by [52,53] on skeletal muscle and lungs showed that the number of mitochondria was regulated by mitochondrial biogenesis to meet the energy needs of the cell and to compensate for cellular damage. Other studies on the skeletal muscle of obese fa/fa rats showed a disruption in the mitochondrial dynamics in favor of fission by a decrease in the expression of the enzyme of the mitochondrial outer membrane, mitofusin 2, involved in mitochondrial fusion [54]. The mitochondrial fission–fusion process was the subject of many studies in human pathology and in murine models. Indeed, in rodents and humans, Sivitz and Yorek [55] demonstrated that abdominal obesity was associated with the defective dynamics of mitochondria manifested by mitochondrial dysfunction and reduced generation of ATP. Further work by Kowaltowski et al. [56] and Yisang Yoon et al. [57] in diabetic patients indicated the involvement of mitochondrial dynamics abnormalities with overproduction of ROS in type-2 diabetes. These studies supported our results and we suggested that damaged mitochondrial respiratory chain and reduced ATP production would trigger the activation of mitochondrial fission by formation of new mitochondria. Indeed, in accordance with Otera and Mihara [58], those mitochondria continually changed their shape through fusion–fission and movement throughout the cell; these dynamics were related to metabolic diseases contributing to the distribution of mitochondria in response to the local demand for ATP. According to these same researchers, excessive mitochondrial fission often resulted in an alteration of the respiratory chain. However, slightly defective mitochondria fused with active mitochondria allowed the individual to recover respiratory activity. On the other hand, highly altered mitochondria cannot fuse with active mitochondria. Furthermore, and with reference to Bereiter-Hahn and Jendrach [59], according to the cell type and the cellular pathophysiological situation, mitochondria showed various morphotypes: small and rounded, elongate, tubular, and interconnected networks. These data from the literature explained the morphological changes of mitochondria observed in our hepatocytes submitted to SD.
5 Conclusion
P. obesus, a natural polygenic rodent model, appears to be an excellent model adapted to research on environmental interactions, diet, and their pathological consequences in the liver, such as the regulation of mechanisms and survival for hepatocytes suffering by destruction of numerous damaged mitochondria. P. obesus is an animal model allowing us to explore mechanisms previously inaccessible in humans.
Disclosure of interest
The authors declare that they have no competing interest.
Acknowledgments
This research is supported by the General Direction of Scientific Research and Development of Technology, Ministry of Higher Education and Scientific Research, “DGRSDT-MESRS”, Algeria.