

Version française abrégée
L'étude de la stabilité des systèmes biologiques et l'identification de patrons de distribution récurrents dans le temps et l'espace sont des questions centrales de l'écologie des communautés, à la fois sur le plan théorique, pour comprendre le fonctionnement de ces systèmes, et sur le plan appliqué, pour mesurer l'impact de mesures de gestion environnementale. Plus particulièrement, l'étude du synchronisme vise à identifier et à expliciter la concordance temporelle de différents systèmes biologiques distants géographiquement. Le synchronisme a fait l'objet de nombreuses études au niveau des populations. En revanche, ces études sont plus rares à un niveau d'intégration supérieur tel que les assemblages.
Bien que les méthodes multi-tableaux soient bien connues des statisticiens, les usages en écologie sont rares et concernent essentiellement l'étude de la stabilité temporelle des peuplements. Un certain nombre de méthodes multi-tableaux sont basées sur une optimisation de la covariance entre les tableaux. Dans le cas le plus simple, l'analyse de co-inertie multiple permet l'ordination simultanée d'un ensemble de tableaux (K-tableau). Dans les cas plus complexes, l'analyse de concordance permet l'ordination simultanée d'un K-tableau avec un tableau et l'analyse de co-inertie multiple généralisée permet l'ordination simultanée d'un K-tableau avec N tableaux. Pour traiter du synchronisme dans la variabilité temporelle des assemblages, nous avons utilisé l'ACOM afin de déduire une structure temporelle de référence à partir de chacun des tableaux de notre K-tableau. Le support mathématique de l'ACOM est implémenté dans le logiciel ADE-4 et permet de reproduire les calculs.
Nous illustrons l'usage de l'ACOM à partir de séries temporelles d'invertébrés aquatiques collectés en plusieurs sites distants du bas Rhône. Cette analyse permet l'étude simultanée des sites d'échantillonnage considérés comme plusieurs tableaux et comportant la proportion de différents taxons (variables) pour chacune des 15 années prospectées (relevés). Du fait de la phénologie des taxons et de l'apparition d'espèces invasives, la composition faunistique de chaque site d'échantillonnage est variable d'une année à une autre. On montre, cependant, qu'il est possible de mettre en évidence une structure temporelle commune aux différents sites. Ce résultat suggère un fort contrôle abiotique (caractères physico-chimiques et hydrologiques) au niveau régional, malgré la flexibilité des réponses biologiques aux changements environnementaux locaux. En complément, l'ACOM permet (1) de visualiser les écarts par rapport à la structure temporelle de référence et (2) de mettre en lumière les taxons responsables des déformations de la structure temporelle de référence. Cette méthode s'avère donc un outil prometteur dans l'analyse de la persistance et de la stabilité des communautés.
1 Introduction
The study of the stability of ecosystem components and the identification of repeated temporal and spatial patterns of such components are key questions both for community ecologists who aim at learning and understanding ecosystem functioning and for managers who require an independent assessment of the value or consequences of their environmental policies [1]. Ecosystem monitoring usually results in time series, which often comprise several lists of taxa (assemblages) sampled at various localities, thus yielding 3-dimensional arrays (taxa × time × space). Statistics for investigating the persistence (continued presence, e.g., [2]) or stability (relative abundance, e.g., [2]) of such assemblages in time and space include univariate (e.g., [3–6]) as well as multivariate techniques (e.g., [7–9]).
The relative abundance of species in assemblages (i.e., stability) naturally fluctuates in space and time according to how species respond to ecological conditions [10]. This variability has important consequences for the detection of global temporal trends of species assemblages [11]. Among these trends, synchrony has been given emphasis in ecology. Synchrony can be defined as the degree to which different biological systems show similar temporal evolution [5,12]. Synchronous fluctuations in species within an assemblage have been widely studied in population ecology [10] in order to understand how population are regulated. Spatial synchrony in populations is generally attributed either to the influence of climatic factors or to the dispersal of individuals [13]. By contrast, synchrony among assemblages has rarely been addressed (e.g., [5,6,9]). Therefore, it may be timely for introducing statistical tools in ecology that explicitly address the concept of synchrony with the aim of investigating the degree to which different assemblages within a region behave similarly through time. Among these tools, multitable techniques represent alternatives that have rarely been taken into account in ecological works although they are well known by statisticians (e.g., [14–18]). Following a comparison of various biological data sets by way of the Individual Difference Scaling (IDS), Oksanen and Huttunen concluded that multitable techniques were too complex to be used by ecologists [19]. By contrast, partial triadic analysis was designed as a preliminary approach to multitable techniques and can be handled with a simple PCA programme [20]. Though considered as a key reference [21], only few works refer to partial triadic analysis for analysing ecological data (e.g., [22]) probably because it applies to a particular case where the same variables are recorded for the same individuals at various occasions. Consequently, multitable techniques have been used in few studies essentially to assess the temporal stability of aquatic living biota [23–28].
Studying the synchrony in the temporal variability of aquatic communities requires analysing the covariation between several tables (locations), which comprise the occurrence or abundance of taxa at several sampling occasions (date). Several multitable techniques are based on a covariance optimisation criterion. In the more simple case, Multiple CO-inertia Analysis [15, MCOA] enables the simultaneous ordination of a set of several tables (K-tables). In more complicated cases, Concordance analysis [29] enables the simultaneous ordination of K-tables with one table and Generalised Multiple Co-inertia Analysis [30] enables the simultaneous ordination of K-tables with N tables. To fulfil our objective of analysing the synchrony in the temporal variability of assemblages, we selected Multiple CO-inertia Analysis [15, MCOA] in order to set up a reference temporal structure from each location and analyse whether each location deviated from this reference.
The aim of this note is thus to show how Multiple CO-inertia Analysis [15] can be applied to the study of the synchrony of assemblages despite the spatial and temporal fluctuations of species distributions. We illustrate the potential of the technique by analysing a time series of stream invertebrate samples collected over nearly two decades by the CEMAGREF of Aix-en-Provence and the ARALEP [31] to assess the warming impact of nuclear activities along the Lower Rhone River.
2 Principle of Multiple CO-inertia Analysis (MCOA)
MCOA is an ordination technique that enables the simultaneous analysis of K tables (each table denoted by has n rows and pk columns). MCOA optimises the variance within each individual table and the correlation between the scores of each individual table (individual ordination) and synthetic scores providing a reference structure. MCOA thus optimises a covariance between several individual ordinations and a reference ordination. Mathematical details are available in [15]. Briefly, let be the individual species composition table and let and be the column and row weights of , respectively. Contrasting to other eigenvector analyses, MCOA does not use a singular value decomposition of the data matrix but rather constructs axes one after another. Along step 1, MCOA searches for a set of vectors (-normalised) maximizing (i.e., the projected variance of on ) and one auxiliary vector (D-normalised) maximizing (i.e., the projected variance of on ) so that the following quantity is optimised:
As indicated above, this latter expression means an optimisation of the squared covariance between the first rank synthetic auxiliary axis () and the first rank co-inertia axes (). Along step 2, MCOA searches for vectors (-normalised) and one auxiliary vector (D-normalised) using the same optimisation criterion and with the additional constraints of orthogonality between and (i.e., ) and between and (i.e., ), respectively. The iteration of m analyses thus yields m auxiliary axes and mk co-inertia axes. Note that if K=1, then MCOA corresponds to usual PCA. In that case, the first auxiliary variable represents the first principal PCA components of the juxtaposed tables weighted by the inverse of its inertia.
MCOA statistics and graphical outputs of this paper were computed with the ade4 library implemented in the R freeware (http://www.r-project.org/). The ade4 library [32] can be obtained freely at http://pbil.univ-lyon1.fr/R/rplus/ade4dsR.html. Access to updates and user support through the ADEList mailing list as well as a worldwide web documentation and downloading page are also available at http://pbil.univ-lyon1.fr/ADE-4/ADE-4.html.
3 Illustration: synchrony of stream invertebrate assemblages
In a multitable approach, the way in which tables are matched is a key step for the interpretation of the outcomes [20,33]. A preliminary arrangement of tables includes which items (taxa, locations, dates) will occur as rows, as columns or as tables. In our example dealing with synchrony, locations had to be the tables since we wanted to compare locations, and in addition, sampling occasions and taxa had to occur as rows and columns, within each table, respectively (Fig. 1). Such data organisation yields two options: (1) to consider the average temporal structure as reference or (2) to take into account the average species composition as reference. Since our purpose was to analyse the synchrony of species assemblages we selected the first option.
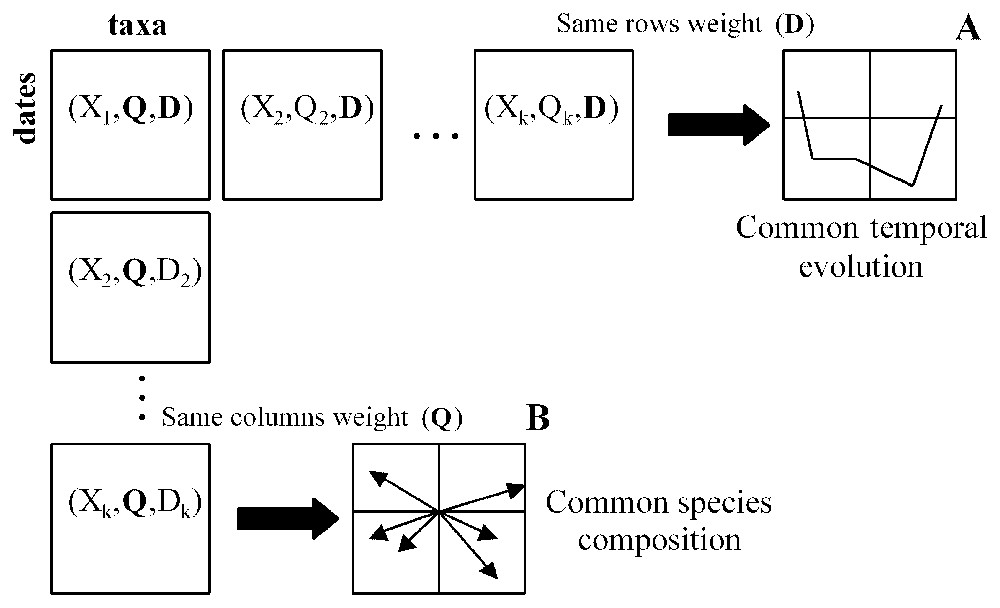
Two different ways for matching several tables and their resulting reference structure. In our subsequent example, the rows and the columns of each table correspond to years and taxa respectively and the number of tables (k) equals 6. A. Row matching (years) involves that the referecne represents some kind of average temporal evolution. B. Column matching (taxa) involves that the reference represents the average faunistic composition. The study of spatial synchrony of temporal variability implies an arrangement and an analysis of tables as in A.
To illustrate the technique of MCOA, we used data from quantitative invertebrate surveys available on the Lower Rhone River since two decades. Data consisted of stream invertebrate's basket sampling collected in the vicinity of three nuclear power plants distributed along 150 km of river. Two sites were selected upstream and downstream of each power plant and were visited 3–4 times each year between 1985 and 1999. These sites were situated in the artificially modified main channel of the river and were thus similar in their physical characteristics involving low habitat heterogeneity [34]. This is due to regulation, which has involved low slope (less than 0.7 m km−1) and low flow velocity (0.3 m s−1 on average) [34]. A total of 61 stream invertebrate families were recorded over the period. The abundances were ln(x+1)-transformed to reduce the effect of dominant species. Finally, the raw data set consisted of six tables (corresponding to the six locations), which contained the percentage abundance of each invertebrate family per year. Each table (location) included 15 rows (years) and a given number of columns, which corresponded to the total number of families collected at each site over the 15-year period. The total number of families ranged between 32 and 50.
We first ran a Principal Components Analysis (PCA) on each table (location) to check for the existence of a two-axes structure in each location. We then performed MCOA on the juxtaposed tables (cf. Fig. 1). We synthesized the temporal structure using the first two synthetic auxiliary variables. The common temporal structure exhibited two periods (dotted line in Fig. 2A) with a first temporal evolution of assemblages from 1985 towards 1990 and a secondary evolution of assemblages from 1992 towards 1999. The noticeable change occurring in 1991, which appears to be a transitional period, implies that assemblages did not return to their initial state of 1985.
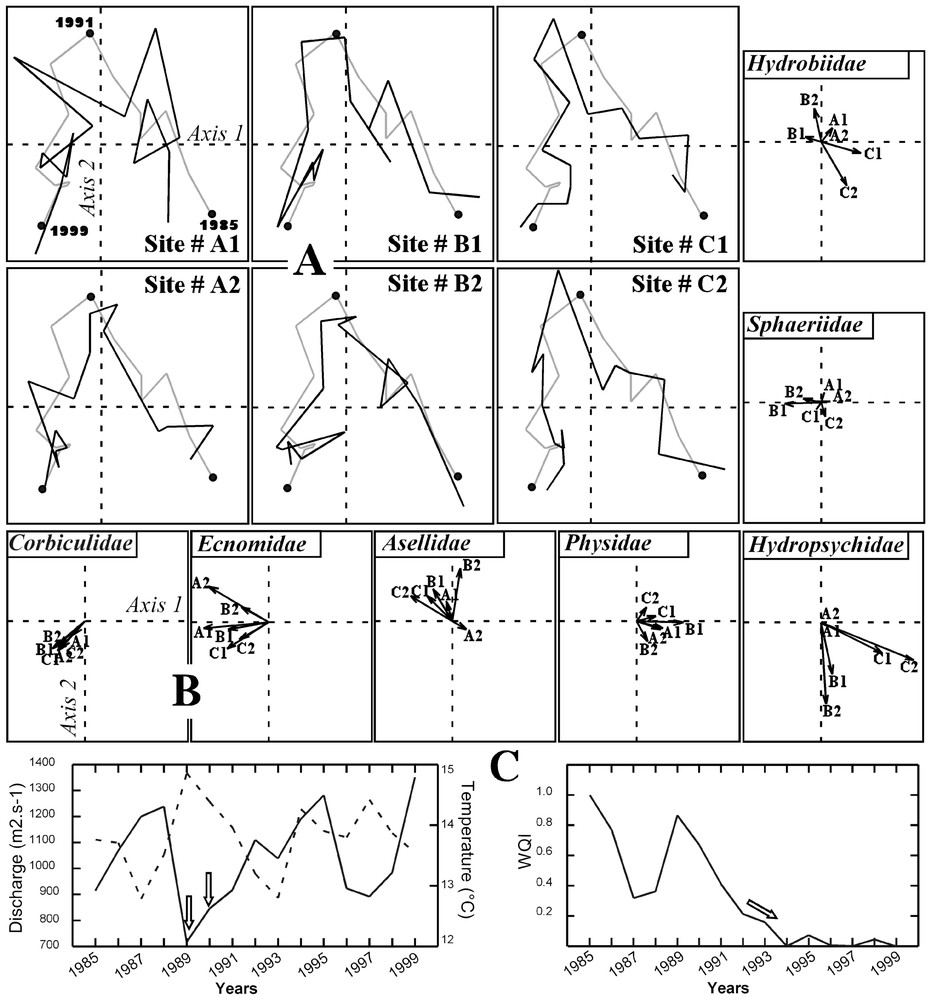
A. Reference temporal structure (dotted line) and superimposition of the 15 sampling years (solid lines) for each site (labelled # A1 to # C2) resulting from an MCOA. B. MCOA site scores of the main families (numbers stand for sites). Arrows point towards the direction of the higher relative abundance of a given family within a given site. C. Evolution of yearly discharge and temperature (left), and water quality index (noted WQI, right; a high value of WQI indicates high Biological Oxygen Demand and high ammonia nitrogen concentrations and thus a low water quality). Average yearly water temperature (data from ‘Électricité de France’) and average yearly discharge (data from the ‘Compagnie nationale du Rhône’) were obtained from continuous recordings. Physical and chemical data were available from the National Water Quality Network (SEQ-Eau, ‘Réseau national de bassin de l'Agence de l'eau Rhône–Méditerranée–Corse’) and were downloaded at http://rdb.eaurmc.fr/.
The values of the squared covariance (noted cov2 in Table 1) between each individual set of table scores and the set of reference scores shows that all sites participate in the same way to the construction of the temporal structure. Furthermore, the high similarity (cos2 in Table 1) between the first two axis scores of the separate PCA of each location and the first two axis scores of the MCOA confirms the good fit between each location and the synthetic auxiliary variables. Finally, the values of RV coefficients, which measure the correlation between two given tables [35] are close to one, demonstrating the strong relationships between the temporal evolution of each site and the reference temporal evolution. This relationship is graphically confirmed (Fig. 2A).
Statistics for the first two axes of a Multiple Co-inertia Analysis. Cos2 (squared cosines): correlation between the scores of individual tables and the synthetic variable of the same rank (1st or 2nd). Cov2: squared covariance between the scores of individual tables and the synthetic variable of the same rank (1st or 2nd). Note that in MCOA, the weighted sum of squared covariance is optimised. RV: correlation between the temporal evolution of each individual table and the common temporal structure
| Axis rank | cos2 | cov2 | RV | |
| Site # A1 | 1 | 0.801 | 0.178 | 0.880 |
| 2 | 0.686 | 0.096 | ||
| Site # A2 | 1 | 0.901 | 0.243 | 0.870 |
| 2 | 0.755 | 0.117 | ||
| Site # B1 | 1 | 0.956 | 0.319 | 0.861 |
| 2 | 0.756 | 0.118 | ||
| Site # B2 | 1 | 0.900 | 0.129 | 0.900 |
| 2 | 0.915 | 0.254 | ||
| Site # C1 | 1 | 0.896 | 0.212 | 0.884 |
| 2 | 0.880 | 0.162 | ||
| Site # C2 | 1 | 0.938 | 0.258 | 0.886 |
| 2 | 0.829 | 0.196 |
The invertebrate families showed either a spatially stable temporal evolution (e.g., Corbiculidae, Ecnomidae, and Hydropsychidae, Fig. 2B) or demonstrated spatial variation in their interannual evolution (e.g., Sphaeriidae, Hydrobiidae, Fig. 2B). The first period (1985–1991) was mainly characterized by rheophilic caddisflies larvae (e.g., net-spinning Hydropsychidae, Fig. 2B), which showed a slight decrease in proportion (especially in sites # B1–2 and # C1–2) towards 1991 and by grazing molluscs (e.g., Physidae, Fig. 2B). Leeches (not shown) and isopods (e.g., Asellidae, Fig. 2B) dominated the beginning of the second period (1992–1999) also marked by an extension of the more lentic taxa of caddisflies (e.g., Ecnomidae, Fig. 2B) and dragonflies (e.g., Libellulidae, Platycnemididae not shown). The propagation of the alien family Corbiculidae (filtering molluscs, Fig. 2B) is noticeable as well. This family includes species having a high capacity for colonisation combined with high fecundity [36], enabling a rapid dominance of the assemblages at all sites and thus contributing strongly to the similarities among sites.
The observed reference temporal structure is related to a combination of long-term changes in physical and chemical properties of water and discharge variations. The common temporal evolutions detected along the first and second synthetic axes were positively related to an improvement in water quality (R2=0.75, p<0.001 and R2=0.64, p<0.001, respectively) mainly due to a decrease in the Biological Oxygen Demand and the ammonia nitrogen concentrations (decrease in the water quality index, Fig. 2C, right). Furthermore, exceptional low water levels experienced by aquatic assemblages in 1989 and 1990 were responsible for higher water temperatures (arrows in Fig. 2B, left) and may explain the change in the reference temporal structure in 1991.
4 Conclusions and perspectives
Some problems must be overcome in the analysis of the synchrony of assemblages. The first problem concerns the obvious variation of species composition in space and time due to the dispersal of individuals and regional history [37]. Some species may be evidently present only in a few sites or may be specific to a particular site due to the natural fluctuations of populations and the variability of recruitment. Because, we used the family level, this problem is in our case of minor importance. The second problem concerns the variability of the quantitative importance of species in the temporal structure due to natural immigration or extinction across time. As a result, the similarity among assemblages may not be due to the same species over the studied period since climatic features (e.g., temperature) may be favourable to the growth of a group of species while the same conditions may impair other species that will not be involved in the temporal structure. In addition, some species may take advantage of a decrease or a collapse of one or several dominating species, and subsequently increase in dominance [38].
In the present study, we show that MCOA optimises the visualisation of a reference temporal evolution of assemblages. Since we wanted to address synchrony, we focused on within-site variations in the compositional characteristics of the assemblages and MCOA was used to emphasise the common temporal changes in assemblages of geographically distant localities. These results suggest a strong abiotic control of assemblages at the regional scale despite the flexibility of species response to environmental changes at the local scale, which does not strongly alter the synchrony among sites.
The advantage of MCOA over classical ordination techniques for addressing synchrony in assemblages is twofold. First, MCOA helps to focus on the comparison of the temporal structure of sites and on the weight of each table in the establishment of the reference structure. Second, MCOA puts an emphasis on the stability around the common temporal evolution by showing which taxa are driving this temporal evolution and which taxa are responsible for the deformation of the common temporal evolution. Multitable techniques thus appear as relevant alternatives for analysing multiple time series and for depicting spatial and temporal patterns of assemblages. They allow space and time to be accounted for as ecological objectives. However, the preliminary organisation of three-ways data sets has to be linked to an ecological meaningful aim [20]. As shown in our Fig. 2, the organisation of our data set led to at least two options according to whether we wanted to emphasize the common temporal structure or the common species composition. This further difficulty is probably the reason for the lack of use of multitable approaches in ecology. Since the analysis of long-term data is vital to evaluate the ecological integrity of ecosystems, multitable exploratory techniques should be better integrated to the usual statistical tools used by ecologists.
Acknowledgements
We wish to thank George Carrel of CEMAGREF in Aix-en-Provence, France, for valuable comments on an earlier version of this work. We also thank M.R. Scarsbrook, who kindly gave us linguistic advices. Finally, we thank the referee for constructive comments, which helped to improve the manuscript. This work was funded by the programme GICC-AQUABIO (French Ministry of Environment).