

Version française abrégée
Les forêts tropicales sont fortement menacées par les coupes de bois et les mises à feu. La situation est particulièrement critique dans la forêt sèche sur la côte ouest de Madagascar. Dans cette région, la forêt ne brûle pas naturellement sur une grande surface, mais la répétition des feux conduit à la destruction des arbres et à leur remplacement par une végétation herbacée. De même, l'exploitation du bois, même menée de façon sélective, semble avoir un impact négatif sur certaines espèces animales.
Nous nous sommes proposé de tester l'impact du feu et de l'exploitation sélective sur une communauté d'oiseaux terrestres endémiques de Madagascar, les couas. Trois espèces de couas ont été étudiées dans deux stations, distantes de 500 km, mais toutes deux situées dans la forêt sèche. Ampijoroa est caractérisée par le passage répété de feux de forêt. La zone d'étude couvre plus de 250 ha, comprenant des zones forestières intactes et des zones forestières brûlées une ou deux fois. Kirindy est, au contraire, une zone où la forêt a été exploitée de façon sélective, conduisant à une mosaı̈que de parcelles forestières intactes et de parcelles dégradées. La zone d'étude couvre plus de 10 000 ha. L'histoire des deux stations a pu être reconstituée de façon précise grâce aux documents écrits et aux témoignages recueillis auprès des habitants.
Les couas étudiés sont les suivants : le coua de Coquerel (Coua coquereli) et le coua à tête rousse (Coua ruficeps) à Ampijoroa ; le coua de Coquerel et le coua géant (Coua gigas) à Kirindy.
Nous avons d'abord déterminé l'existence de neuf « habitats » dans les deux stations en fonction du niveau de dégradation et de l'éloignement ou de la proximité de l'eau. Nous avons ensuite mesuré les caractéristiques structurelles de la végétation dans chaque habitat. Une étude statistique confirme les différences structurelles entre ces différents habitats. Nous avons enfin déterminé les densités de chacune des espèces de coua dans chacun de ces habitats.
Une analyse canonique nous permet d'associer les variables d'habitat les plus importantes pour chacune des densités de couas observées. Il apparaı̂t que chacune des espèces de couas est associée à des caractéristiques de végétation différentes. Le coua de Coquerel apparaı̂t ainsi lié à des habitats où la végétation de sous-bois est bien développée et où la canopée (plus ou moins ouverte) est assez élevée. De plus, cette espèce est franchement plus abondante dans les forêts ayant brûlé une fois et dans les forêts où le bois a été exploité. En revanche, elle est absente des zones où la forêt a brûlé au moins deux fois. La végétation de sous-bois peut être favorable à cet oiseau en fournissant des sources de nourriture et des zones de nidification.
Le coua à tête rousse est lié à des habitats franchement ouverts, avec une prédominance de petits arbres, formant une canopée peu élevée. Cette espèce est ainsi absente des forêts galeries, mais est en revanche encore présente dans les zones où la forêt a brûlé au moins deux fois.
Enfin, le coua géant est plutôt retrouvé dans des habitats avec une haute canopée (permettant d'avoir des sites de nidification en hauteur) et peu de végétation de sous-bois, permettant à cette grosse espèce de se mouvoir plus facilement. Cette espèce tend à devenir moins abondante dans les zones forestières éloignées des cours d'eau, où la canopée tend à devenir moins élevée. L'exploitation du bois (qui enlève les arbres les plus élevés) et la mise à feu des forêts (qui augmente la densité de la végétation de sous-bois) font régresser cette espèce.
L'ensemble de ces résultats montre la nécessité de créer des réserves forestières à Madagascar afin de maintenir des zones de forêt sèche intacte où ces oiseaux pourront maintenir des populations stables.
1 Introduction
Tropical forests are heavily threatened by human activities [1]. Monitoring animal populations and their habitats has become increasingly important and in a conservation perspective, it is interesting to know how the animals use their habitat, and how they respond to disturbance [2].
Logging and burning are the main threats to the western dry forest in Madagascar [3–6]. This dry forest cannot burn naturally over a great surface [7–9] and natural fire has little impact on the vegetation structure, if it occurs only once. In this case, only leaf-litter is burnt, although some canopy trees can be killed [10,11], understorey growth may be more vigorous, and forest may regenerate after some years [7,8]. More damages are caused by a second fire, which will be enhanced by the dead wood. In this case, the canopy is more seriously affected [10,11].
In tropical forests, selective logging produces physical effects on the forest floor that resemble changes associated with natural tree fall, but with more effects than natural tree fall rates [12]. Selective logging is practised in the western dry forest of Madagascar and it has been shown to alter forest structure [13–15]. Although in this case the rate of timber extraction was low [16], the ecology of some species of birds was affected too [10,11,17,18]. The main and common effects of fire and logging on the vegetation structure of the western dry forest of Madagascar are an increase in understorey vegetation and a reduction of the canopy height and cover [10,11].
The vegetation structure of the dry forest in Madagascar is also modified by natural variations, due to geology and climate variations [19,20]. The result of all these disturbances is the creation of a mosaic of undisturbed and disturbed forest patches.
Couas are endemic birds of Madagascar [21]. These birds are terrestrial and insectivorous, and may be particularly sensitive to habitat disturbance. Terrestrial insectivorous birds select habitat for their entire life [22] and are often considered as sensitive to forest disturbance [23–27]. Study of these birds in habitats differing in their level of disturbance may permit us to understand which impacts forest management will have on their ecological requirements and improve their conservation status.
This paper describes an analysis of the different habitats used by three terrestrial bird species, according to the effects of logging and fire in the western dry forest in Madagascar. Our aim was to evaluate if the different species respond differently to habitat disturbance and to identify which habitat variables were important in causing their responses. Knowledge of this information is important in a conservation perspective. We studied the vegetation structure and we measured also the density of each species in different habitats. We also suggest some management conclusions for these bird species.
2 Material and methods
2.1 Study site
All the observations were made in two areas of the western dry forest, separated by 500 km (Fig. 1). The first one, Ampijoroa (15°59′–16°22′ lat. S, 47°56′–47°12′ long. E), is adjacent to the ‘Réserve naturelle intégrale’ of Ankarafantsika, 120 km from Mahajanga. Rainfall is comprised between 1000 and 1500 mm per year, with a wet season from November to March. Daily temperatures range from 17 to 35 °C, with a daily mean of 22 °C during the dry season and 29 °C during the rainy season [4].
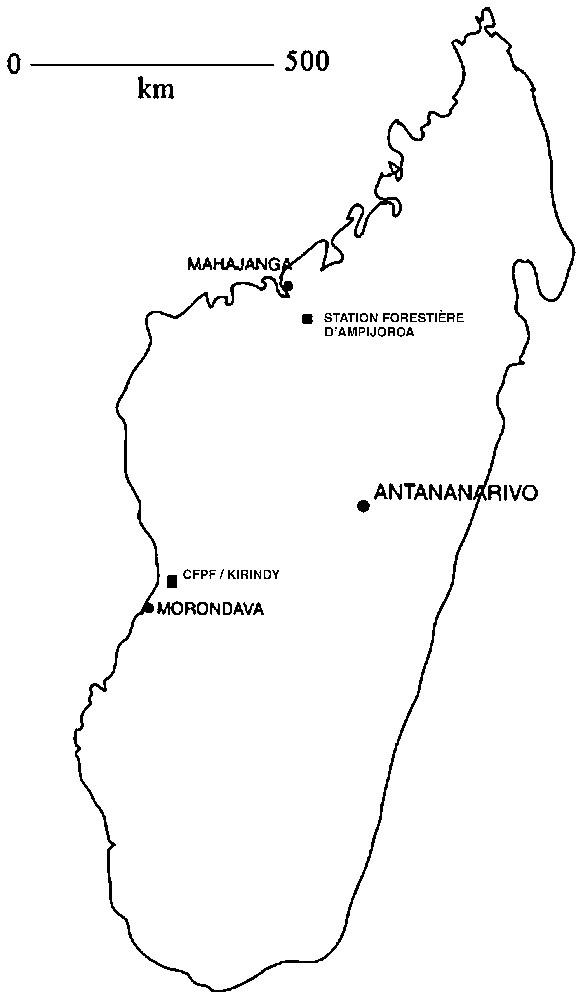
Situation of the two areas where the study was performed. CFPF: ‘Centre de formation professionnelle en foresterie’ in the Kirindy Forest; ‘Station forestière d'Ampijoroa’ (forest station of Ampijoroa) in the Ankarafantsika region.
The second area, Kirindy (44°39′ lat. E–20°03′ long. S), is located in the Menabe region, 60 km north of Morondava, in the 10 000-ha concession of the ‘Centre de formation professionnelle en foresterie’ (CFPF) of Morondava. Rainfall varies from 300 to 1400 mm per year, with a mean of 800 mm [28]. Temperature variability may be very large: mean daily maxima are around 36 °C and the minima around 19 °C [29]. The Kirindy River crosses the station, and influences the vegetation structure [28,30].
In both areas, vegetation structure differed according to the distance from water. We arbitrarily named ‘dry forest’ the forest plots situated at more than 1 km from water where we performed some measurements, and ‘gallery forest’ the forest plots situated near water. We did not take into consideration the distance from water in our study because we were only interested in comparing the effects of the vegetation structure on the bird densities. In Ampijoroa, the dry forest is located on the sandy plateau (‘Jardin botanique’ A) and harbours many deciduous trees. It is possible to distinguish three habitats in the dry forest: an undisturbed dry forest, one once-burnt forest, which burnt in 1983 [11] and a twice-burnt forest, at the southeastern side of the study area (Fig. 2). This latter habitat is due to a fire that occurred in the previously burnt forest (Rabemazava, pers. comm.). In the valley, the forest is considered as a gallery forest, with high canopy and more evergreen trees. This forest has to be considered as disturbed, because of the proximity of human settlements close to the station, which use the forest for pasture.
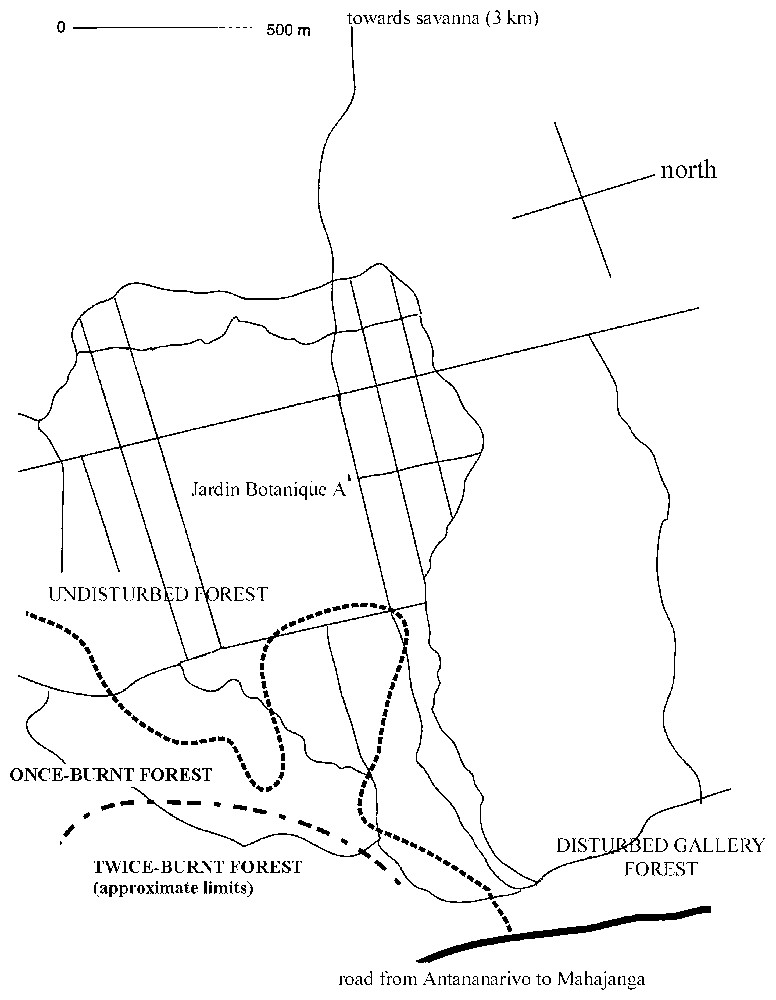
Map of the Ampijoroa station. The bold lines indicate the limits of the burnt forest plots (once-burnt and twice-burnt forests). The other lines indicate the trails around the ‘Jardin botanique’. Vegetation characteristics and bird density were measured in the different forest habitats described on the map.
In Kirindy, the concession of the CFPF is divided into different parcels of 100 to 130 ha (Fig. 3). The vegetation is tallest on the humid soils near the river, with more evergreen trees. This forest is considered as a gallery forest, while the forest far from the river tends to be a more deciduous dry forest. This forest was partially logged by the CFPF from 1978 to 1991. Logging was selective, and only 5 to 12 m3 ha−1 were extracted, which corresponded to 7 to 15 trees·ha−1 [16]. In addition, the CFPF provided a lot of attention to restore the forest after exploitation [31,32]. Five habitats were distinguished in this station: logged gallery forest (parcel CS6), unlogged gallery forest (CS7), logged dry forest (N5), unlogged dry forest (N7) and bush (S0 and S1).
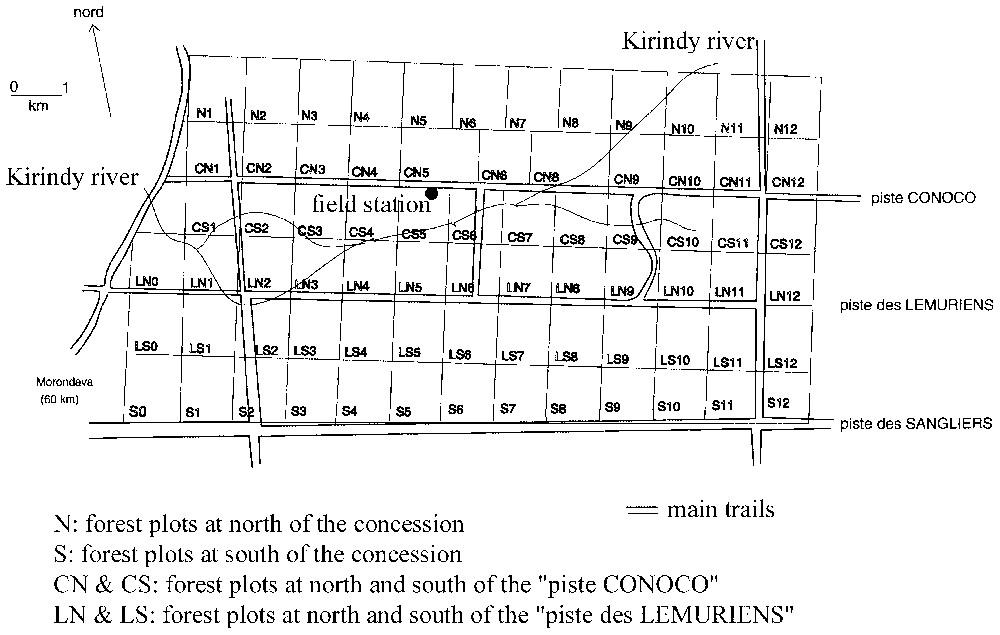
Map of the Kirindy Forest, indicating the different forest plots (identified by letters and figures) used by the CFPF to exploit timber. Superficies of the different plots vary from 100 to 130 ha. Vegetation characteristics' measurements were performed in the plots S0, S1 (habitat K5), CS5, and CS7 (habitat K1); CS6 (habitat K2), N5 and N6 (habitat K4). See text for explanations of the vegetation characteristics. Bird densities were measured in the same forest plots.
The different habitats in both stations will be referred as follows:
- – for Ampijoroa, A1, disturbed gallery forest; A2, once-burnt forest; A3, twice-burnt forest; A4, unburnt forest;
- – for Kirindy, K1, logged gallery forest; K2, unlogged gallery forest; K3, logged dry forest; K4, unlogged dry forest; K5, bush forest in the western side of the concession.
2.2 Species
Two terrestrial coua species are encountered in Ampijoroa: the Coquerel's coua (Coua coquereli), and the red-capped coua (Coua ruficeps). In Kirindy, Coquerel's coua occurs with the giant coua (Coua gigas). These three species are endemic from Madagascar. They are insectivorous and mainly terrestrial birds, although they can forage in upper levels of vegetation. Previous works about these three species were conducted by Appert, Milon, Urano and Masuda [33–38]. Size varied between species, with giant coua being twice the mass of Coquerel's coua, and red-capped coua slightly larger than the latter species. No sexual and morphological dimorphism is known for these species. All these species are not listed as endangered [39], but increasing hunting in Madagascar could have some impact on their abundance.
2.3 Study period
One of us (P. Chouteau) measured macrohabitat variables from January to June 1997 in both stations. We studied couas density during the rainy season in 1999, when the individuals were singing and responded to the playback.
2.4 Vegetation measurements
Studies of the general habitat requirement for a species should use a large-scale measure of vegetation structure [40]. This scale corresponds to the macrohabitat scale (⩽10 km2), which includes the minimum area where the individuals can select their territory [41]. Field studies using large spatial scales are important to separate the effects of forest management from natural disturbances.
Vegetation structure and bird diversity may be linked, and the most important elements to consider were canopy height, canopy cover and vegetation stratification [42–44]. These macrohabitat measures allowed us to study the relation between habitat and presence of a given coua species. We used some variables derived from Hawkins [10], who worked in the same areas, and studied another terrestrial insectivorous bird, the White-breasted Mesite (Mesitornis variegata) living in the same habitat as couas.
We realised 41 transects (26 in Kirindy and 15 in Ampijoroa), 100 m long and 2 m wide (200 m2 or 0.02 ha). We preferred to use line transects instead of circular plots (with 0.04 ha as standard measure) because of the difficulty to move through dense vegetation in disturbed habitats. Line transects allowed to move easily and more quickly into these habitats, without destroying the surrounding vegetation. Transects were separated at least by 200 m in order to study a great surface of dry forest.
All trees on the transects were measured and placed into four size classes, according to diameter at breast height (dbh): 1–5 cm, 5–10 cm, 10–20 cm and >20 cm. We counted also the total number of lianas, stems under 1 cm in diameter and the total number of shrubs.
We divided each transect in 10 points where we estimated the following variables: canopy height; canopy cover (estimated at the nearest 10%); estimated mean distance visible at 0, 1 and 2 m height, measured in two different directions. Visibility was used as an index of the understorey vegetation density: vegetation density=1/visibility.
In a first step, we tested the effects on vegetation structure of logging, burning and distance from water by a Kruskal Wallis test [45], as a preliminary analysis indicated the variables were not normally distributed and so, use of parametric tests not allowed.
We performed in a second step a principal component analysis (PCA, [46]) to reduce the dimensionality of the vegetation data for subsequent Canonical Correspondence Analysis (CCA). We wanted to reduce our original variables to a case-to-variable ratio of 1:3, in order to be analysed by CCA. If two variables were strongly correlated (r>0.80), we retained only the variable most highly correlated with the first principal component (PC). A second PCA was performed to summarize the habitat variables in the various habitats.
2.5 Measure of the coua density
We used the transect method to study the density of each coua species, because this method was considered to provide more data than the single points counts [47]. The different coua species were located by using song playback. We performed several bird transects in the different vegetation habitats (defined as below) of both stations. Transects lengths varied from 2000 to 3600 m, and were located in the same plots where vegetation structure was studied. They were covered in the morning from 7.00 h to 10.00 h. We used the different existing tracks in each station to move quickly. We took great care to control that one transect was always performed into the same habitat.
A recorded song of 20 s length of one species was broadcast at 200 m intervals along the transect, and we waited 2 min for an answer before playing the song of the other species, and waiting 2 min too. If one individual responded to the tape, we estimated its distance from the survey point by walking to this individual and counting the number of paces.
Two hundred metres was the distance we estimated the best to prevent the record of the same bird, because individuals continued singing long after the playback, and moved towards the site where we performed the song. A preliminary analysis on 100-m-spaced points, at a distance usually considered as the best to record birds in tropical habitats [27] indicated that this distance was too low to avoid the record of the same bird.
The call playback we used here did not allow us to separate the different individuals by sex (because no morphological difference exits between males and females) and by age (only adults birds were observed). In addition, because the couas were silent during the dry season, we obtained information only for the wet season. Further comparisons between seasons were not possible.
Densities were calculated with the program DISTANCE [48]. The call-playback sites were treated as point transects, each transect was considered as a single sample, and repeats of the same transect were considered as part of the effort for this sample [49].
2.6 Analysis by Canonical Correspondence Analysis
We examined the relation between the abundance of the three coua species (measured as number of individuals by square kilometre), and macrohabitat structure by a canonical correspondence analysis (Procedure Cancorr, [45]). Canonical analysis allowed us to examine the relation between two sets of variables (vegetation structure and couas densities), and indicated which macrohabitat variables were potentially the most important for couas presence and abundance.
We attributed arbitrarily a low density (1 ind km−2) to the red-capped coua in the twice-burnt forest in Ampijoroa to take attention to its presence in this habitat, although it was not possible to measure exactly its density. We obtained six important macrohabitat variables and three density variables, and a set of 41 observations.
By including all the habitats of both areas where the three coua species were either present or absent, the canonical correspondence analysis allows us to determine the level of degradation for which a coua cannot stay in this habitat.
3 Results
3.1 Habitat structure
3.1.1 Dry vs gallery forest
In Kirindy, gallery forest and dry forest (without regard of the degree of disturbance) did not differ in their tree size distribution (χ2=3.34, df=3, P>0.05, Fig. 4a). However, canopy was taller and canopy cover was also more important in the gallery forest in this station (Table 1). Visibility at 0, 1 and 2 m high was also greater in the gallery forest than in the dry forest (Table 1). This result indicated a denser understorey vegetation in the dry forest, and a decreased visibility.
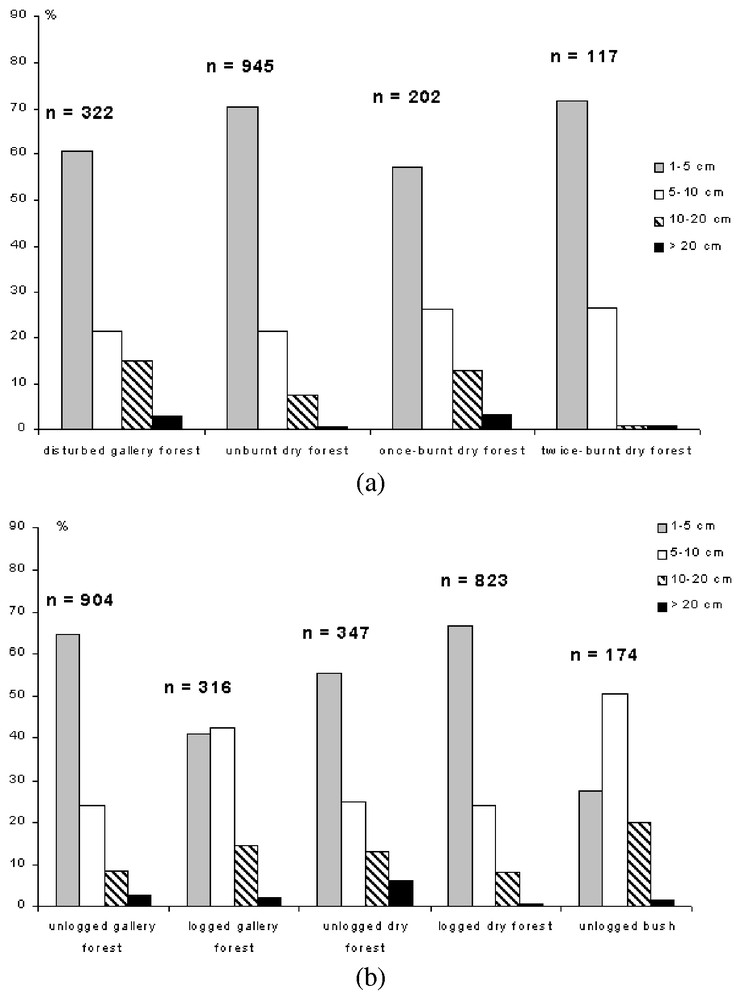
(a) Tree diameters in the different habitats in Ampijoroa (number of trees measured: 1586). (b) Tree diameters in the different habitats in Kirindy (number of trees measured: 2564).
Comparison of the vegetation structure of the different forest habitats in Ampijoroa and in Kirindy. Mean and standard deviations are indicated. χ2 is a Kruskal Wallis test, except for the number of trees >10 cm dbh, where χ2=parametric χ2. : P<0.001; : P<0.01; : P<0.05; ns: no significant
| Ampijoroa | gallery forest | dry forest | χ 2 | unburnt dry | burnt dry | χ 2 | Once-burnt | Twice-burnt | χ 2 |
| forest | forest | forest | forest | ||||||
| % trees >10 cm | 17.70 | 9.76 | 15.56∗∗∗ | 8.36 | 16.34 | 12.02∗∗∗ | 16.34 | 1.71 | 16.23∗∗∗ |
| Canopy height (m) | 14.45 ± 3.9 | 10.9 ± 6.4 | 29.52∗∗∗ | 11.6 ± 7.0 | 9.15 ± 3.8 | 20.86∗∗∗ | 9.15 ± 3.8 | 4.7 ± 1.3 | 48.13∗∗∗ |
| Canopy cover (%) | 87.9 ± 11.9 | 68.7 ± 17.6 | 36.13∗∗∗ | 67.3 ± 15.5 | 73.1 ± 22.7 | 13.07∗∗∗ | 73.1 ± 22.7 | 76.6 ± 15.2 | 0.003 ns |
| Visibility at 0 m (m) | 4.4 ± 1.5 | 4.5 ± 2.9 | 0.41ns | 4.8 ± 3.1 | 3.2 ± 1.5 | 5.50∗ | 3.2 ± 1.5 | 2.8 ± 1.8 | 0.85 ns |
| Visibility at 1 m (m) | 8.8 ± 2.8 | 11.6 ± 4.5 | 7.64∗∗ | 12.7 ± 3.6 | 4.4 ± 1.8 | 62.32∗∗∗ | 4.4 ± 1.8 | 4.3 ± 1.5 | 0.001 ns |
| Visibility at 2 m (m) | 8.4 ± 2.4 | 12.6 ± 5.1 | 14.22∗∗∗ | 14.2 ± 3.8 | 4.5 ± 2.3 | 60.98∗∗∗ | 4.5 ± 2.3 | 3.4 ± 1.5 | 2.30 ns |
| Number of lianas (/8 m2) | 2.0 ± 1.0 | 2.0 ± 1.0 | 0.14ns | 2.1 ± 1.0 | 1.7 ± 0.8 | 3.81ns | 1.7 ± 0.8 | 1.9 ± 1.4 | 0.19 ns |
| Number of shrubs (/8 m2) | – | 2.2 ± 1.3 | – | 1.5 ± 0.8 | 2.6 ± 1.3 | 17.65∗∗∗ | 2.6 ± 1.3 | 4.4 ± 1.4 | 28.11∗∗∗ |
| Number of stems (/8 m2) | 4.6 ± 1.2 | 4.5 ± 2.0 | 0.13ns | 4.6 ± 2.1 | 4.1 ± 1.5 | 1.93ns | 4.1 ± 1.5 | 6.0 ± 2.0 | 3.02 ns |
| Kirindy | gallery forest | dry forest | χ 2 | unlogged dry | logged dry | χ 2 | unlogged gallery | logged gallery | χ 2 |
| forest | forest | forest | forest | ||||||
| % trees >10 cm | 20.19 | 12.62 | 16.49∗∗∗ | 19.35 | 19.65 | 0.007ns | 11.28 | 16.46 | 5.68∗ |
| Canopy height (m) | 16.8 ± 3.1 | 10.5 ± 3.2 | 64.5∗∗∗ | 14.2 ± 4.0 | 9.9 ± 2.5 | 72.69∗∗∗ | 16.0 ± 3.1 | 17.4 ± 3.0 | 12.8∗∗∗ |
| Canopy cover (%) | 75.1 ± 21.3 | 71.0 ± 16.4 | 22.61∗∗∗ | 77.5 ± 16.3 | 69.9 ± 16.2 | 14.65∗∗∗ | 80.2 ± 20.1 | 70.4 ± 21.3 | 26.6∗∗∗ |
| Visibility at 0 m (m) | 4.8 ± 2.7 | 2.6 ± 1.9 | 95.92∗∗∗ | 7.75 ± 1.9 | 2.3 ± 1.3 | 44.33∗∗∗ | 5.1 ± 3.0 | 4.4 ± 2.2 | 1.68 ns |
| Visibility at 1 m (m) | 10.7 ± 5.6 | 7.1 ± 4.1 | 102.07∗∗∗ | 18.8 ± 7.3 | 6.5 ± 2.8 | 49.59∗∗∗ | 12.9 ± 6.0 | 7.5 ± 2.7 | 78.52∗∗∗ |
| Visibility at 2 m (m) | 9.4 ± 5.3 | 7.1 ± 3.3 | 25.70∗∗∗ | 13.8 ± 4.4 | 6.6 ± 2.6 | 40.90∗∗∗ | 10.9 ± 6.2 | 7.5 ± 2.7 | 13.95∗∗∗ |
| Number of lianas (/8 m2) | 1.8 ± 1.1 | 2.2 ± 1.5 | 6.08∗ | 1.3 ± 0.5 | 2.3 ± 1.5 | 10.50∗∗ | 1.2 ± 0.5 | 2.0 ± 1.2 | 13.91∗∗∗ |
| Number of shrubs (/8 m2) | 1.5 ± 1.1 | 2.2 ± 1.5 | 29.65∗∗∗ | 1.0 ± 0.7 | 2.3 ± 1.5 | 7.63∗∗ | 1.2 ± 0.5 | 1.7 ± 1.4 | 1.28 ns |
| Number of stems (/8 m2) | 3.8 ± 2.4 | 3.1 ± 2.4 | 13.68∗∗∗ | 1.5 ± 0.6 | 3.3 ± 2.4 | 18.37∗∗∗ | 3.6 ± 2.3 | 3.9 ± 2.4 | 1.30 ns |
A different result was obtained in Ampijoroa. There was a significant greater proportion of big trees in the gallery forest than in the dry forest (χ2=16.50, df=3, P<0.01; see Fig. 4b). Visibility was greater in the dry forest, indicating a smaller volume of understorey vegetation. This result was due to the fact that only disturbed gallery forest exists near Ampijoroa, where human populations settle around the station.
3.1.2 Disturbed vs undisturbed forest
Vegetation structure differed in the various habitats in both areas, according to forest management. In Ampijoroa, the once-burnt dry forest showed a greater proportion of big trees than the unburnt dry forest (χ2=22.53, df=3, P<0.01; Fig. 4a) and there was also a significant lower proportion of big trees in the twice-burnt forest than in the once-burnt forest (χ2=17.09, df=3, P<0.01; Fig. 4a).
Burning in Ampijoroa involved a reduction of canopy height, but an increased canopy cover (Table 1). Visibility decreased after burning, indicating an increase in the understorey vegetation. Compared to once-burnt habitat, twice-burnt habitat in Ampijoroa showed a strong reduction of the vegetation height associated with an increase of the number of shrubs (Table 1).
In Kirindy, the unlogged gallery forest had more trees with dbh>20 cm, but less trees with dbh between 10 and 20 cm (χ2=58.90, df=1, P<0.001) than the logged gallery (Fig. 4b). There was also significant difference between logged and unlogged dry forest (χ2=46.8, df=3, P<0.01) with a greater proportion of trees with dbh>20 cm in the unlogged forest (Fig. 4b). Compared to the bush, the dry forest had a greater proportion of trees with dbh>20 cm (χ2=43.51, df=1, P<0.01, see Fig. 4b).
Logging in both dry and gallery forests in Kirindy induced a decrease of the canopy height and cover, an increase of the understorey vegetation and of lianas density (Table 1). However, after logging, shrubs and stems increased in dry forest, but not in gallery (Table 1).
3.2 Reduction of the original set of variables
A first PCA allowed us to reduce from 9 to 6 the set of macrohabitat variables. Visibility at 0 and 2 m high appeared strongly correlated to visibility at 1 m high, and only this last variable was kept in later analysis. Shrubs density appeared highly correlated with all the other variables, and was hence neglected in later analysis (Table 2). The values of the five first principal components are indicated in Table 3.
Correlations between the different macrohabitat variables in the ACP
| 1 | 2 | 3 | 4 | 5 | 6 | 7 | 8 | 9 | ||
| % of trees with dbh >10 cm | 1 | 1 | ||||||||
| Canopy height | 2 | 0.34 | 1 | |||||||
| Canopy cover | 3 | 0.01 | 0.26 | 1 | ||||||
| Visibility at 0 m | 4 | 0.47 | 0.22 | 0.05 | 1 | |||||
| Visibility at 1 m | 5 | 0.44 | 0.22 | −0.01 | 0.96 | 1 | ||||
| Visibility at 2 m | 6 | 0.40 | 0.21 | −0.15 | 0.89 | 0.95 | 1 | |||
| Number of lianas | 7 | −0.27 | −0.05 | −0.19 | −0.79 | −0.73 | −0.59 | 1 | ||
| Number of shrubs | 8 | −0.64 | −0.69 | −0.36 | −0.59 | −0.61 | −0.64 | 0.29 | 1 | |
| Number of stems | 9 | −0.81 | −0.24 | 0.14 | −0.79 | −0.80 | −0.71 | 0.64 | 0.53 | 1 |
Values of the five first principal components (PC) and % of the data variation
| PC | eigenvalue | % | Cumulated % |
| 1 | 5.08 | 56.43 | 56.43 |
| 2 | 1.59 | 17.71 | 74.14 |
| 3 | 1.08 | 12.06 | 86.20 |
| 4 | 0.71 | 7.85 | 94.05 |
| 5 | 0.38 | 4.25 | 98.30 |
Fig. 5 plots PC 1 versus PC 2 and separates the various habitats according to vegetation structure. PC 1 is positively correlated with the volume of understorey vegetation. In addition, PC 1 is negatively correlated with number of lianas and stems. PC1 opposes disturbed (negative values) to undisturbed (positive values) habitats (see Fig. 5). PC 2 is negatively correlated with canopy cover and height (Table 4).
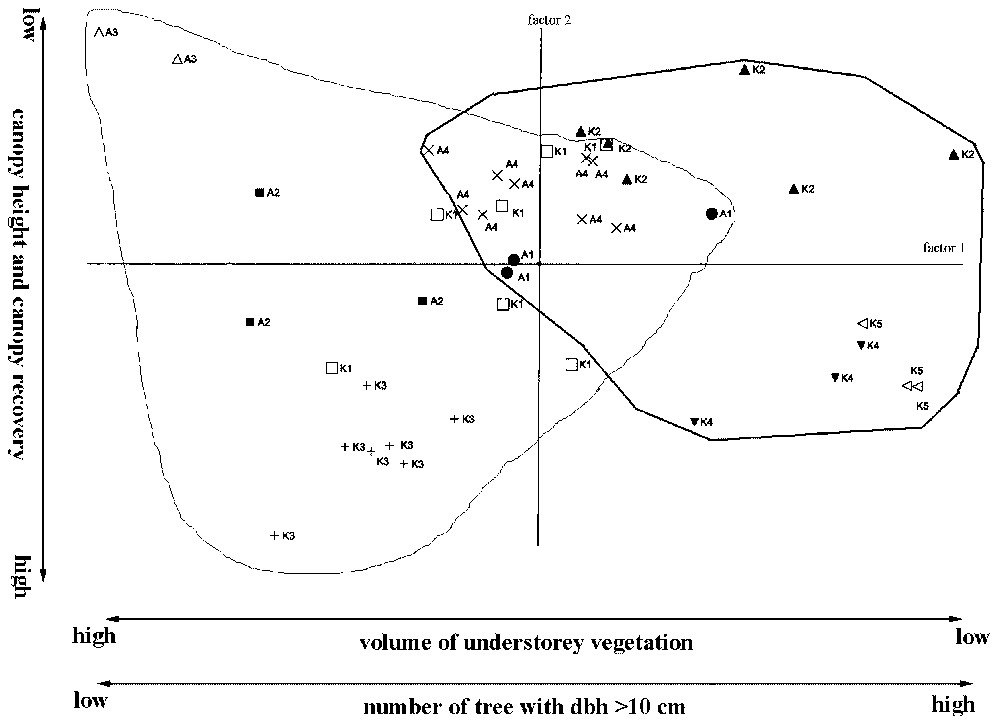
Plot of PC 1 vs PC 2, separating the different habitats by their vegetation-structure variables. A1: Gallery forest in Ampijoroa; A2: once-burnt dry forest in Ampijoroa; A3: twice-burnt dry forest in Ampijoroa; A4: unburnt dry forest in Ampijoroa; K1, logged gallery forest in Kirindy; K2, unlogged gallery forest in Kirindy; K3, logged dry forest in Kirindy; K4, unlogged dry forest in Kirindy; K5, bush forest in the western side in Kirindy. The undisturbed habitats (on the right) are surrounded by a bold line; the disturbed habitats (on the left) are surrounded by a thin line.
Correlation of six selected macrohabitat variables with each of the three principal components having eigenvalues >1
| 1 | 2 | 3 | |
| % trees with dbh >10 cm | 0.67 | −0.23 | 0.49 |
| Canopy height | 0.40 | −0.74 | 0.18 |
| Canopy cover | 0.07 | −0.66 | −0.68 |
| Visibility at 1 m | 0.94 | 0.21 | −0.13 |
| Number of lianas | −0.73 | −0.27 | 0.48 |
| Number of stems | −0.89 | −0.16 | −0.26 |
Habitats with small canopy height are clearly separated from other habitats, but twice-burnt forest in Ampijoroa (A3) have a dense understorey vegetation, which the primary bush of Kirindy (K5) has not. The three gallery forest habitats (A1, K1 and K2) were more clustered than typically dry forest habitats (A2, A4, K3 and K4).
3.3 Coua densities
In Ampijoroa, Coquerel's coua was less abundant in the once-burnt forest than in the unburnt dry forest and was not recorded in the twice-burnt forest (Table 5). Red-capped coua was more abundant in the once-burnt dry forest than in the undisturbed dry forest. It was also recorded in a twice-burnt forest where we saw adults and subadults together, but there was no evidence the species bred in this habitat. Only Coquerel's coua was recorded in the gallery forest in the valley (Table 5).
Density estimate (ind km−2, with 95% confidence interval) of couas species in Ampijoroa and Kirindy, by using DISTANCE to calculate densities. Density of red-capped coua in the twice-burnt forest is not calculated, because of the lack of data, but it has been recorded here
| Ampijoroa | |||||
| unburnt sand forest | once-burnt forest | twice-burnt forest | degraded gallery forest | ||
| Number of transects | 7 | 3 | 2 | 3 | |
| Total survey transects | 7 | 5 | 3 | 4 | |
| Total survey points | 40 | 40 | 20 | 27 | |
| Surveyed area (ha) | 92 | 36 | 28 | 30 | |
| Coquerel's coua | 29.4 | 11.1 | 0 | 8.2 | |
| (18.0–48.1) | (8.2–15.0) | – | (3.3–20.4) | ||
| Red-capped coua | 16.7 | 25.7 | presence | 0 | |
| (9.1–30.6) | (8.6–77.0) | – | – | ||
| Kirindy | |||||
| unlogged gallery forest | logged gallery forest | unlogged dry forest | logged dry forest | bush | |
| Survey transects | 4 | 4 | 3 | 6 | 3 |
| Total survey transects | 8 | 8 | 3 | 14 | 3 |
| Total survey points | 57 | 49 | 38 | 52 | 49 |
| Surveyed area (ha) | 108 | 120 | 152 | 180 | 90 |
| Coquerel's coua | 13.3 | 24.2 | 15.4 | 17.3 | 16.0 |
| (9.0–19.7) | (17.0–34.7) | (9.6–24.8) | (10.9–27.5) | (7.5–34.3) | |
| Giant coua | 5.6 | 3.7 | 5.8 | 2.4 | 0 |
| (4.8–6.5) | (3.2–4.3) | (4.2–8.1) | (1.0–5.6) |
In Kirindy, Coquerel's coua appeared to be more abundant in the logged than in the unlogged gallery forest, but did not show important variations between unlogged and logged dry forest, although it could be more abundant in the logged part of the forest. It was the only species recorded in the bush in the western part of the concession, and its density in this habitat was very similar to that in the unlogged dry forest (Table 5). Giant coua had similar density in both primary dry forest and primary gallery forest, but its density decreased in the two types of logged forest, particularly in the dry forest (Table 5). This species was not recorded in the bush, although we saw one subadult, probably not holding territory.
3.4 Canonical correspondence analysis of habitat structure and couas density
The result of CCA indicated a relation between habitat structure and couas abundance (measured by the computer program DISTANCE) in the different habitats, although the correlation between bird species densities and vegetation structure was moderately high (r=0.51). Three canonical variables will be considered. Eigenvalues for canonical variables 1, 2 and 3 were respectively: 0.757, 0.144 and 0.099 and their canonical correlation were 0.897, 0.663 and 0.593. The three canonical correlations were all >0 (F18.94=8.08, P>0.001).
The three couas species differed in their relation with habitat structure (Table 6). Coquerel's coua was positively correlated with the second canonical variable and also but slightly correlated with the first. This species appears linked to habitats with low canopy cover and a great number of lianas and stems. These results suggest a link between the abundance of the species and slightly disturbed forest. Red-capped coua was positively correlated with the second and third canonical variables. This species would be recorded in habitats with low canopy cover, more small trees (diameter <10 cm) and many lianas and stems, suggesting a link between its presence and highly disturbed habitats. Giant coua was positively correlated with the first canonical variable, indicating a link between this species and habitat with high canopy. This species was also negatively correlated with the second canonical variable, indicating a link between its abundance and a high canopy cover and few lianas and stems, suggesting a preference for undisturbed forest with tall trees (e.g., gallery forest).
Matrix of the canonical structure: correlations between the canonical variables (CV) and the original variables
| Variables | CV 1 | CV 2 | CV 3 |
| Number of tree with dbh >10 cm | 0.195 | −0.237 | 0.215 |
| Canopy height | 0.803 | 0.021 | 0.062 |
| Canopy cover | −0.005 | −0.432 | 0.028 |
| Density of understorey vegetation | −0.317 | −0.224 | 0.075 |
| Number of lianas | −0.267 | 0.311 | −0.116 |
| Number of stems | −0.203 | 0.246 | 0.233 |
| Density of Coquerel's coua | 0.398 | 0.910 | −0.115 |
| Density of red-capped coua | −0.409 | 0.648 | 0.643 |
| Density of giant coua | 0.851 | −0.514 | 0.108 |
4 Discussion
4.1 Habitat structure
In each area, vegetation structure varied between the dry and the gallery forest. Forest near the water has a taller and less open canopy, which are the main characteristics of gallery forest [29]. A gallery forest is also characterised by the absence of dense understorey vegetation, which can provide an important protection against predation by raptors [10].
Forest management, e.g., burning and logging, modifies habitat structure. Logging reduces the canopy cover, and increases the density of the shrub layer, a result similar to that obtained by Hawkins [10] and Hawkins and Wilmé [17]. We obtained different results about height of the canopy. Logging decreases canopy height in the dry forest in Kirindy, but increases it in the gallery forest. This result could be explained by the fact that selective logging was correlated with canopy height. A gallery forest with a high canopy is more likely to have been logged as it contains more timbers by surface unit than a dry forest with a low canopy. For a firm conclusion, it would have been necessary to use before-and-after logged sites to study the effects of logging in Kirindy [10]. However, we took great care to be sure that forest management did indeed occur in the area and at which intensity. Logging has not so an extensive impact on vegetation structure as burning, and macrohabitat scale would not be the best scale to study the changes after logging. A microhabitat scale study would probably be better adapted and give more interesting results.
Burning had different effects dependent on the number of fires that occurred in the forest. One fire does not modify vegetation structure, although the opening of the canopy allows the growth of a dense understorey vegetation. A second fire at the same place, during the next ten years following the first one, is more dramatic for the vegetation and strongly modifies the macrohabitat structure. Our results differ from Hawkins' ones [10], probably because it seems he did not separate the once-burnt from the twice-burnt forest in his analysis. Further comparisons with his results are not possible.
4.2 Macrohabitat variables and abundance of the couas
Our results suggest a strong link between some vegetation variables and the presence and abundance of the three coua species. Coquerel's coua presence appears linked to that of big trees. This can explain its great density in the gallery forest in Kirindy (compared to the dry forest in the same station) and its presence in the gallery forest in Ampijoroa (with a low density, probably explained by the disturbance of this habitat). This species is always present in logged habitat as in Kirindy, and its population density is even slightly increased. A similar pattern was found for the mesites by Hawkins [10,11,18]. He suggested that logging increased the density of the understorey vegetation and more mesites were found because of the increase of the shrub layer, providing a protection against predation and heat, and more potential nest sites. A similar explanation can be applied to Coquerel's coua in the logged habitat. Hawkins and Wilmé [17] suggested also that logging increased food abundance for Coquerel's coua, as caterpillars were more abundant in the logged forests. However, Coquerel's coua could be more disadvantaged by a more important logging (i.e. if dbh of logged trees was decreasing, involving a more severely damaged canopy). Burning forest appears as a more constraining habitat, and severe logging could mimic a burnt habitat [10]. This species seems also sensible to twice-burnt habitat, a very unfavourable habitat for it, by reducing the height and the cover of the ‘canopy’.
Red-capped coua is absent from habitats with big trees and dense understorey vegetation. This result suggests this species could be linked to open habitats. Although its is often seen in savannah [50], it is doubtful that it can survive in this open area, because of its need of trees for nesting. This species nests at medium height in vegetation [21]. Red-capped coua seems particularly scared in the twice-burnt forest in Ampijoroa, compared to unburnt and once-burnt habitat in the same station (pers. obs.). Severe logging and burning could be beneficial for this species and increase its abundance in the disturbed forests.
Giant coua is recorded in habitats with high canopy, but low density of shrubs. Logging has a negative impact on its density, and more severe management, like an increase of logging or burning, could reduce the optimal habitat and decrease the density of this species.
4.3 Implication for conservation
Fragmentation of the primary dry forest in Madagascar [51] prevented the gene flow between the different populations of couas. Before human settlement, western dry forest was considered as a unique biome, but now primary dry forest occurs in different fragments, in a matrix of disturbed habitat [52].
Where burning or logging are severe, forest can be replaced by open savannahs. In this case, no coua, nor any other forest bird, can survive in this landscape, and the populations are restricted to different fragments of relatively undisturbed forest. There is no possibility of gene flow between fragments, and the populations, though they can survive in the greater fragments of forest, will disappear from the smaller ones [53,54]. Couas have low dispersal power, markedly by their avoidance of the open area (especially Coquerel's coua) and their inability to fly over long distance. These birds will probably never colonise fragments of forest separated by several hundred metres, even if these fragments are great enough to support a population. Population isolated in these fragments will collapse by stopping of the gene flow, and effects of the fragmentation, particularly edge effects, will contribute to restrict their habitat requirement.
If burning occurs only once or if logging rate is very low, vegetation structure would not be strongly disturbed, and the forest corresponds to a matrix of exploited and intact parcels. The three coua species have the possibility to maintain individuals in this matrix. However, a second disturbance will strongly modify the vegetation. A species like Coquerel's coua does not occur in this highly disturbed habitat in Ampijoroa, and the lack of Giant coua in the bush suggests that this species too is not able to cross this low canopy habitat. It is difficult to infer which will be giant coua's behaviour in a twice-burnt forest, but because of the similarities between twice-burnt dry forest in Ampijoroa and the unlogged bush in Kirindy, particularly the low canopy height, this species could possibly not stay in such a disturbed habitat. However, disturbing would benefit to red-capped coua, which can survive in this habitat, and can colonise various small sized fragments. This species is aggressive towards Coquerel's coua (Chouteau, unpublished data). We suppose that red-capped coua could probably compete successfully with Coquerel's coua for foraging and nesting sites.
Selective logging is another disturbance for forest insectivorous birds, but its impact is difficult to study in the short term. Our study indicated a positive effect for Coquerel's coua density, but an absence of effect for giant coua. Indirect perturbation could be more negative, by nest predation, or by hunting. Nest predation can be enhanced by the large tracks in the forest. Madagascar coucal (Centropus toulou) is now observed in the Kirindy forest, near the ‘Piste Conoco’, which crosses all the forest from west to east. By using the current network of trails, this species can probably invade all the forest and contribute to the failure of coua nests near the open areas [6].
As for mesites, hunting of couas can contribute to its local rarity around the villages [11], especially in area with non-existing or not applied legal protection. Couas could be used as umbrella species, and their conservation could be useful probably for other restricted species as mesites, because the two species have the same habitat requirements [10].
Our study indicates the selective logging could be restricted to the typically dry forest, which is also usually the most easily reached forest. Gallery forest would be kept as corridor for conservation, especially for the Giant coua. Statistics indicate that timber is more exploited by surface unit in the gallery forest than in the dry forest in Kirindy [55]. Conservation of the gallery forest would be improved if logging were practised in the gallery forest at the same rate as in the typically dry forest. In addition, fire control would be necessary, and the possibility to make lane fire in the western dry forest should be studied.
Acknowledgements
We thank the ‘Commission tripartite’ of the Malagasy Government, the ‘Ministère pour la Production animale et des Eaux et Forêts’ for the permission to work in Madagascar. The staff of WWF Madagascar and Steven M. Goodman provided logistic support and very pleasant hospitality in Antananarivo. O. Langrand initiated the study and advised on the methods. Jean-Marc Thiollay, Christian Erard and Frank Hawkins made some comments on the manuscript. We thank Conservation International for permission to work in Ampijoroa and for accommodation in the station Forestière; Durrell Wildlife Conservation Trust, especially Don Reid, for logistic support in Ampijoroa, Monsieur le doyen de la faculté des sciences de Mahajanga for his collaboration to this study; U. Thalmann, A. Muller, H. Randriamahazo, T. Mizuta (Osaka University), Charles, Jacky and Rabemazava for their reception in Ampijoroa. We thank the Deutsh Primatenzentrum of Göttingen, especially Jorg Ganzhorn and Peter Kappeler, for the permission to use their station in the Kirindy Forest and to take advantage of the logistic; the ‘Centre de formation professionnelle en foresterie’ in Morondava, to facilitate the access to the Kirindy Concession. We thank all the people from the Kirindy Forest and the German students for facilitating the accommodation during the stay in the forest.