

Version française abrégée
Les excellentes performances mécaniques du bois trouvent leur source dans une structuration multi-échelles sophistiquée de composants polymériques. Du fait de sa structure en nid d'abeille, le module d'Young longitudinal peut être directement relié à la rigidité de la paroi, elle-même principalement déterminée par l'angle moyen des microfibrilles cristallines de cellulose par rapport à la direction des fibres (AMF). À partir d'un jeu de données de fluage obtenues sur des échantillons de bois d'angles microfibrillaires variés, nous espérons identifier un comportement viscoélastique de la matière constitutive des parois et proposer des éléments de discussion quant à l'organisation ultrastructurale de la paroi.
Des essais de fluage en flexion quatre points dans la direction longitudinale ont été réalisés sur de petits échantillons de bois d'épicéa, possédant des angles microfibrillaires variés. Dans un premier temps, la complaisance pariétale est déduite des données macroscopiques en tenant compte de la porosité. La complaisance différée est alors convertie en complaisance complexe en utilisant la valeur et la pente des courbes donnant la complaisance en fonction du logarithme du temps. Nous obtenons ainsi, pour chaque essai de fluage réalisé, une trajectoire dans le plan complexe donnant la partie imaginaire de la complaisance complexe en fonction de sa partie réelle. Plus l'AMF est élevé, plus la courbe traduit des complaisances instantanée et différée plus grandes, ce qui est conforme à ce que l'on peut attendre, du fait de la contribution grandissante des zones amorphes de la paroi. Toutefois, lorsque la complaisance complexe est convertie en rigidité complexe, un résultat plus inattendu est observé : les portions de trajectoire de rigidité complexe correspondant à la fenêtre temporelle 103–106 s peuvent être superposées moyennant une translation horizontale, qui est fonction de l'angle microfibrillaire. Nous en déduisons la possibilité de décomposer le module de relaxation longitudinal de la paroi comme la somme de deux termes : (i) une contribution élastique dépendant de l'angle microfibrillaire et (ii) un terme différé n'en dépendant pas.
Nous pouvons ensuite émettre des hypothèses sur la forme géométrique dans laquelle s'inscrivent les trajectoires obtenues. Reprenant l'idée, antérieurement soutenue par Huet, de mécanismes de relaxation paraboliques, nous nous attendons à observer dans le plan complexe des portions de cercle. La forme observée pouvant effectivement être considérée comme le début d'un arc de cercle, nous sommes à même d'obtenir directement, par observation des courbes obtenues, les paramètres d'un modèle viscoélastique solide à trois éléments, constitué d'un ressort de rigidité , fonction de l'AMF, en parallèle avec un ressort de rigidité en série avec un l'amortisseur parabolique de temps caractéristique et d'ordre . Le nombre est inférieur à 1, la valeur 1 correspondant à un ressort linéaire habituel. Les valeurs ainsi identifiées sont les suivantes : (GPa) –, l'AMF ϕ étant exprimé en degrés ; , , (s) ≈7 à 8.
Ce résultat appelle des commentaires. Tout d'abord, la représentation du comportement ainsi identifié suggère inévitablement une interprétation en termes de contribution des différentes couches de la paroi, disposées en parallèle par rapport à la direction longitudinale. C'est ainsi que le ressort (2) pourrait représenter la contribution de la couche S2, et l'ensemble (1) celle des autres couches. S'il en était ainsi, cela voudrait dire que la couche S2, dans la fenêtre expérimentale envisagée (bois sec, fenêtre temporelle de la fraction d'heure à quelques années), ne serait pas responsable de la viscoélasticité du matériau, celle-ci étant principalement prise en charge par les autres couches.
Toutefois, cette interprétation n'est pas cohérente avec ce que l'on peut attendre comme contribution respective des deux couches. En effet, la couche S2 étant de loin la plus importante, tant en terme d'épaisseur que de rigidité, les valeurs obtenues de 35–15 GPa pour sont trop faibles par rapport aux 28 GPa trouvés pour . On peut donner à cela deux types d'explication. Tout d'abord, la branche (2) pourrait ne pas représenter toute la couche S2, mais seulement les lamelles de S2 contenant les microfibrilles, les zones de lignines de S2 contribuant alors à la branche (1). Ensuite, l'évaluation faite de est tributaire d'hypothèses fortes sur la forme des trajectoires, c'est-à-dire à l'extrapolation sur le long terme des processus de relaxation viscoélastique. C'est ainsi que, sur la base d'essais du même type, nous avons proposé dans d'autres travaux des prédictions à long terme basées sur des extrapolations complètement différentes. Quoi qu'il en soit, d'autres choix de modèles auraient pu aboutir à des valeurs de bien inférieures et, de ce fait, plus compatible avec l'interprétation structurelle proposée.
1 Introduction
The exceptional mechanical performance of wood, used as a structural material both by the stems of living trees as well as by human engineers, relies on a sophisticated, multiscale arrangement of polymeric components [1]. The ‘microfibrillar angle’ (MFA), mean orientation of the crystalline zones in the dominant S2 layer within the cell wall, plays an essential biomechanical function by controlling the level of maturation strain at the latest stage of wood formation. It is also commonly recognized as a key factor for wood quality [2]. Due to the honeycomb-like structure of wood, its longitudinal elastic modulus can be directly related to the longitudinal elastic modulus of the cell wall through the following equation:
| (1) |
2 Material and methods
2.1 Material
Specimens of dimensions were cut at various radial positions between the pith and growth-ring number 35 from a tree of European spruce (Picea abies) of age more than 40 years, supplied by INRA-Nancy, France; the latewood proportion is not listed here, but generally fell between 15% and 19%. All surfaces were sanded to minimise surface damage. The specimens were then characterised by measuring (i) the S2 microfibril angle, using the Cave X-ray diffraction method [9–11] on latewood samples with , with the X-ray beam in the radial direction and some checks by the iodine-staining optical method, on thin tangential sections, and (ii) the density and Young's modulus, both of which were measured at 30% RH and 23 °C. Table 1 lists values of growth ring, density , microfibril angle (MFA), the ratio of longitudinal Young's modulus to density and a calculated value , whose meaning will be introduced later.
Characterisation of specimens
| Spec. No. | Growth ring pos. | ρ (kg m−3) | MFA (°) | (MN × m kg−1) | (GPa) |
| 7 | 10.5 | 409 | 17.7 | 34.1 | 12 |
| 27 | 6.1 | 452 | 13.1 | 33.3 | 13.5 |
| 33 | 27.2 | 439 | 6.6 | 41.5 | 0.2 |
| 34 | 30.5 | 414 | 6.3 | 40.0 | 3 |
| 36 | 31.2 | 462 | 6.5 | 42.1 | 0 |
| 39 | 9.1 | 424 | 7.2 | 36.4 | 8 |
| 47 | 7.0 | 458 | 7.5 | 41.6 | 0.4 |
| 49 | 16.2 | 403 | 9 | 39.8 | 3 |
| 50 | 10.1 | 392 | 23.7 | 28.6 | 19.8 |
| 67 | 5.4 | 474 | 12.7 | 31.8 | 15.3 |
2.2 Creep at controlled humidity
The bending-creep experiments were made in an environmental chamber maintained at RH and °C. The testing machines applied longitudinal four-point bending with a nominal stress of 7.5 MPa in the central part of the specimen, and bending axis in R direction, and were described in [12], together with the experimental techniques.
2.3 Analysis method
For each specimen tested, the original data was listed in a table of the bending deflection measured at increasing times . The following steps of analysis are performed [13].
- (1) The deflection values are extrapolated to 1 s by plotting in a scale, converted into relative creep, and into compliance using the evaluation of elastic rigidity obtained by preliminary static tests.
- (2) The values are smoothed by searching for the best-fitting parabola approximating J versus around increasing values of x, and interpolated for these chosen x values. At the same time, we obtain an estimate of the slope of J vs x for these x values.
- (3) The interpolated (J, ) are used to evaluate the components of the complex compliance using the Alfrey approximation [14]:
(2) - (4) The specimen compliance is converted into an estimated longitudinal cell-wall compliance using the specimen density ρ and the cell-wall density (the latter taken as 1500 kg m−3):
(3) - (5) The complex rigidity is deduced from and by:
The analysis is based on a visual assessment of the trajectories in the complex planes or , hoping that they will suggest appropriate rheological models to describe the behaviour of the samples [15–18].(4)
3 Results
3.1 Smoothing and interpolation
The successive stages of the analysis are illustrated in Figs. 1 and 2, in the case of specimen No. 27. In Fig. 1a, the experimental data have been replaced by a few values equally spread in a log time scale: . In Fig. 1b, the values have been used to evaluate the real and imaginary part of the compliance (Eq. (2)) and these have been converted into cell-wall values taking into account the specimen porosity (Eq. (3)). Fig. 2a shows the resulting complex compliance ( vs ) and Fig. 2b the complex rigidity ( vs ), calculated by Eq. (4).
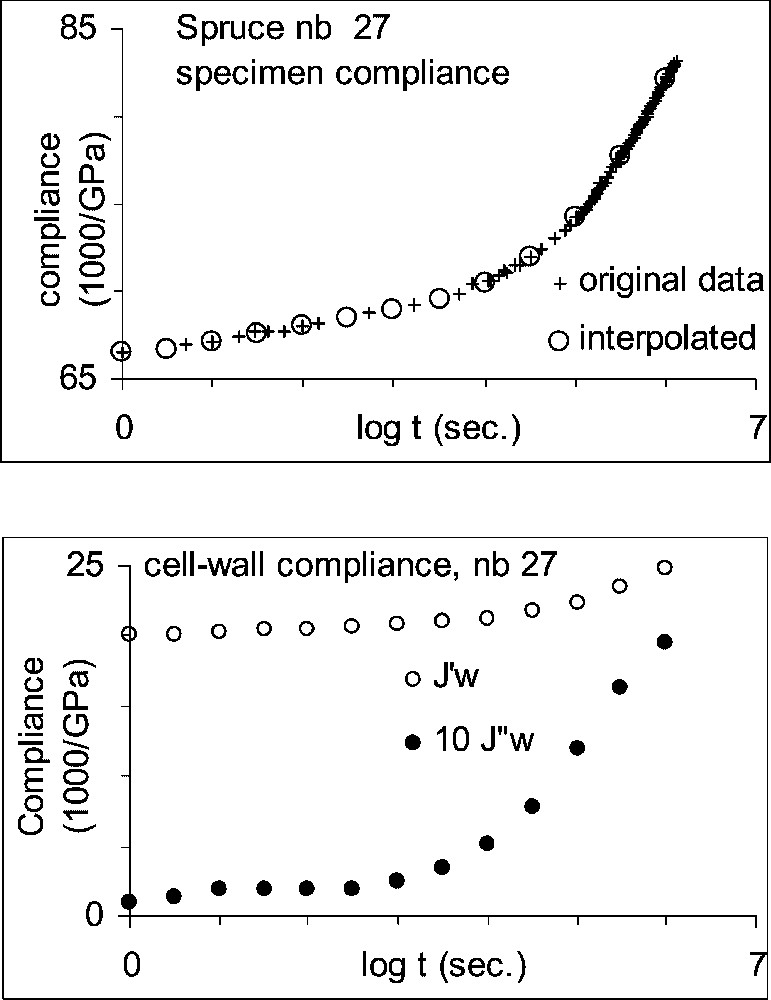
Smoothing–interpolation procedure applied to specimen No. 27: (a) interpolated compliance compared with the original data; (b) estimated components of the complex cell-wall compliance.
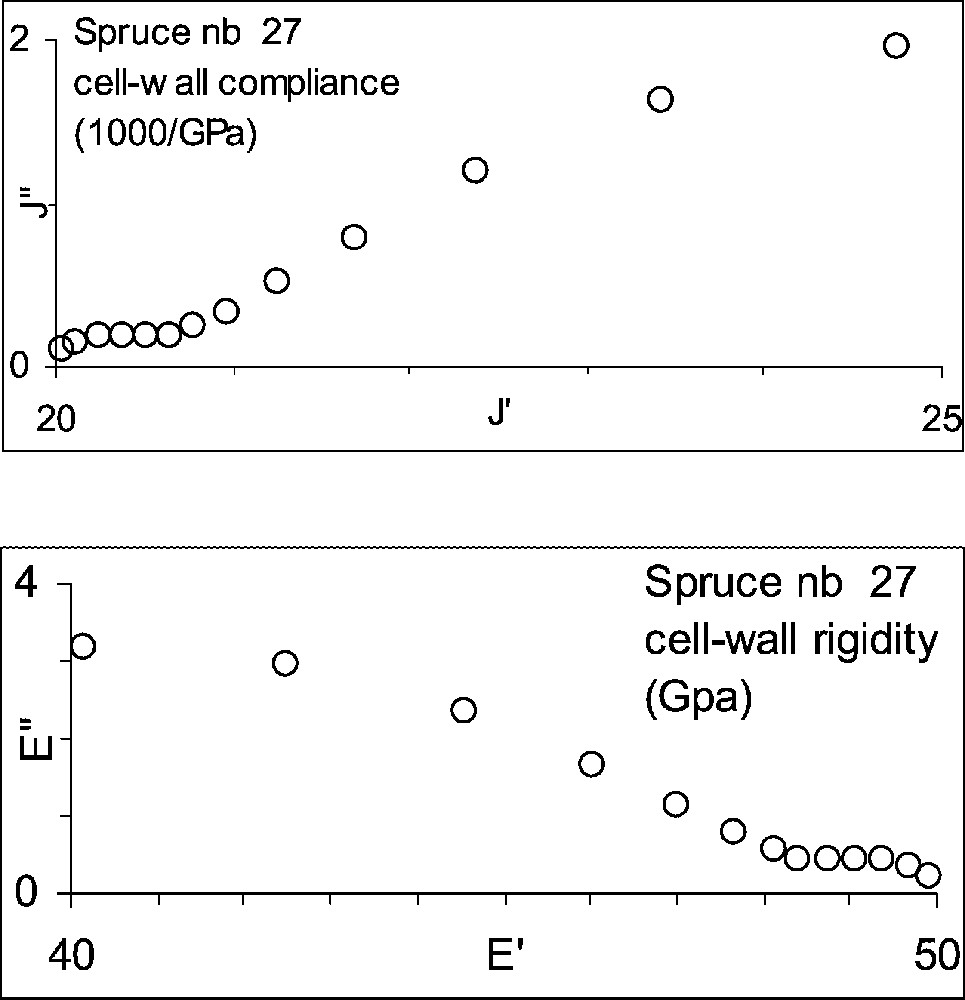
Representation of the results in the complex planes based on Fig. 1b: (a) compliance; (b) rigidity.
3.2 Complex plots and influence of the microfibrillar angle
Fig. 3 shows the complex plots of the whole set of specimens tested during this experiment. In two cases (specimens Nos. 7 and 50), the transducers became ‘sticky’ after a few days, so that we had to remove the two last points from the curves, corresponding to and 6. In the compliance plots of Fig. 3a, each curve represents a creep test, starting from the left, close to the x-axis, and aiming to the right. We observe here a well-known trend: the higher the instantaneous compliance (the intercept of the trajectory with the x-axis), the higher the amount of creep during a given time (the horizontal extent of the curve). However, once the compliance has been transformed into rigidity in Fig. 3b, we observe a rather surprising phenomenon: the size of the trajectories does not depend on the specimen in any clear way, as if they could be deduced from each other by a translation along the x-axis.
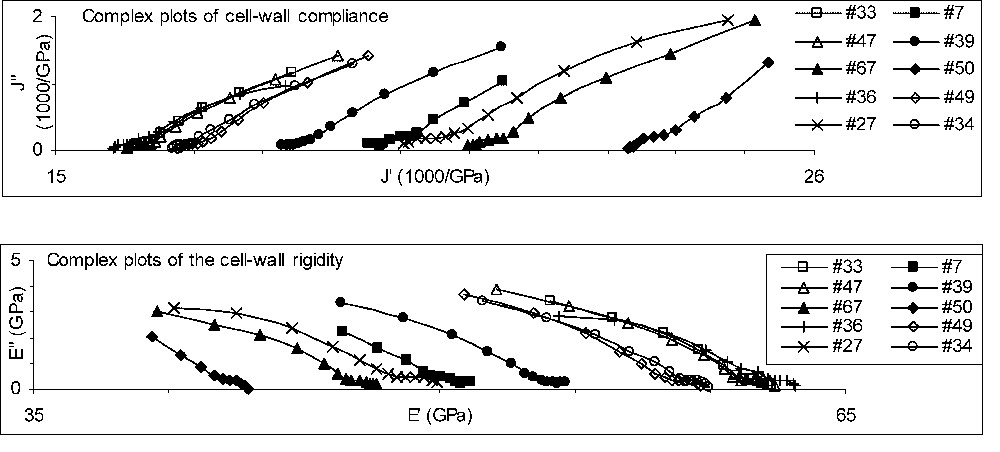
Complex plots for the whole set of specimens tested. (a) Compliance; (b) rigidity.
In Fig. 4a we have applied a horizontal shift to all curves except that of specimen No. 36, which exhibited the highest rigidity values. The amount of shift applied is given in Table 1 as . For each curve, it has been tuned manually, to reach a rather good superposition during the major relaxation process of the test between and 6. The minor relaxation process evidenced in Figs. 3a or 3b for all specimens at the lower time scale, to 3, is subject to more discrepancy. Fig. 4b shows that the horizontal shift increases with the MFA of the specimen, the reference specimen being also that with the smallest measured MFA. This is consistent with previous observations of more relaxation, creep or damping for higher MFA. In our sampling, other structural factors could have also influenced the behaviour, such as the higher growth ring curvature of specimens closer to pith, or varying proportion of latewood. Moreover, our MFA value might not be completely relevant for each specimen, since we did not check MFA differences between latewood and earlywood, or between radial and tangential walls. Therefore, in Fig. 4b, the MFA ϕ should be considered as a parameter expressing the structural variation within the sampling.
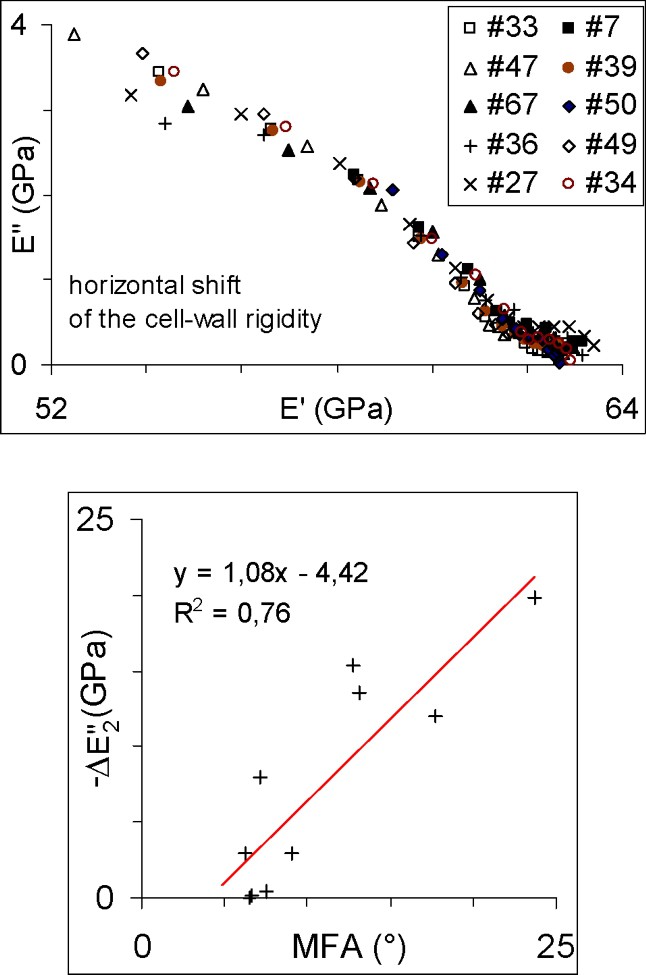
Superposition of the complex rigidity by a horizontal shift: (a) plots for all specimens, specimen No. 34 being taken as reference; (b) amount of shift as a function of the microfibrillar angle.
4 Discussion
4.1 Construction of a predictive model
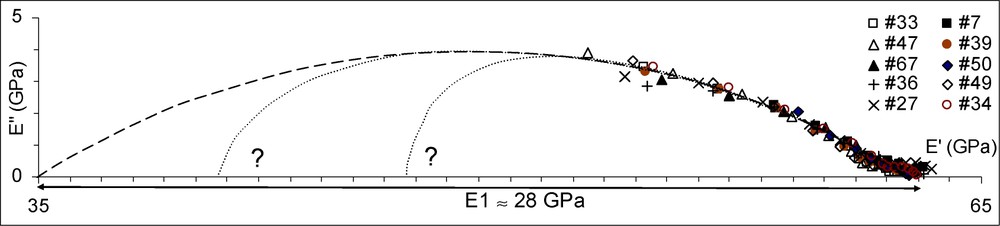
In Fig. 5 the data of Fig. 4a have been redrawn at a wider scale, with equal units for the x- and y-axes. Excluding the points corresponding to the earliest stage of the relaxation process (), the remaining points could be considered as a portion of circle, plotted as a dotted line. As explained by Huet [15], a portion of circle in the complex plane indicates the possibility to use a parabolic model to represent the rheological behaviour of a viscoelastic material like wood. The parameters of the parabolic link can be evaluated by visual assessment of the graph: the rigidity of the link is given by the horizontal extent of the circle portion, the parabolic order by the ratio of the vertical extent to half the horizontal extent, and the characteristic time by the time needed to reach the highest point. In the case of the circle portion shown in Fig. 5, we have , , (s) ≈7 to 8. For , this is a very rough estimate, since obviously the peak has not been reached during the test. The total relaxation function given by this model would be of the form , where is the left intercept with the x-axis of the circle portion; in this case, . For all specimens but No. 36, the horizontal shift should be accounted for, giving an value depending on the specimen, but an unchanged . The plot of Fig. 4b suggests that could be considered, as a rough approximation, as a linear function of the MFA :
Construction of a parabolic model.
4.2 Physical interpretation
The rheological representation of the model proposed is drawn in Fig. 6, with two parallel links. The first link is represented by a spring of rigidity in series with a parabolic dashpot, characterised by and . The second link is purely elastic, with a rigidity depending on ϕ. The image carried by this representation is that the cell wall would be made of two regions, labelled (1) and (2), arranged in parallel with respect to the fibre direction, characterised by the instantaneous rigidities and , respectively. ‘Instantaneous’, in the present case, must be understood as a rough time order of 100–1000 s. In the experimental window considered here (range of time observed), no viscoelastic process occurs in region (2), while it is starting to occur in region (1). At small times, the region (1) supports a part of the load given by , while that supported by (2) is given by . At an intermediate time t, the region (1) supports a part of the load given by . After an infinite time, the region (1) is fully relaxed and supports no more load, while all is supported by (2) – provided no new relaxation process has started.
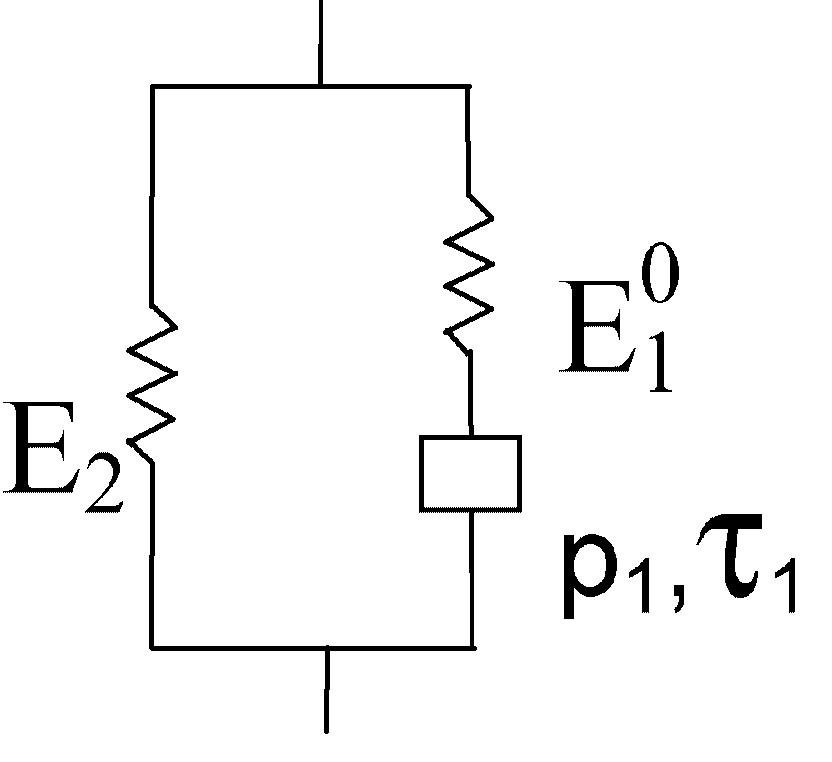
Analogical representation of the rheological behaviour.
Since ϕ is the mean microfibrillar angle of the S2 layer, and only E2 seems to depend on it, it is tempting to assimilate the region (2) to the S2 layer, and the region (1) to S3, S1, P and the middle lamella, considered as a single set. Provided, of course, that our results be confirmed by more extensive experimental data, they would mean that, contrarily to common intuition, the S2 layer is not directly involved in the relaxation process of air-dry wood, at least in the experimental window considered here ().
However, there is a default with this interpretation. In the MFA range considered here, 6 to 24°, the value of decreases from 35 to 15 GPa, in the same order as the value of 28 GPa obtained for . If the two links were corresponding to the two parts of the cell wall, as suggested previously, we would have expected a much higher contribution of S2 to the overall rigidity. Two explanations can be proposed to maintain the interpretation proposed. First, link No. 2 could be considered to represent, not exactly the contribution of the whole of S2, but of the lamellae of S2 containing microfibrils; lamellae of lignin disposed between sub-lamellae of microfibrils, would be contributing to link No. 1. Second, the evaluation of made in Fig. 5 is heavily relying on the assumption that the viscoelastic processes are parabolic. In a previous work, a very different type of extrapolation was proposed based on similar experimental data [19]. Anyway, other models could have suggested other extrapolations, like those indicated on the graph with a question mark. They could result in significantly lower estimates for , more compatible with the proposed physical interpretation.
Acknowledgment
We thank Dr Jean-Michel Leban from INRA–Nancy for kindly supplying us with the test material.