

1 Introduction
The lac operon of E. coli has served as a paradigm for transcription regulation since it was first described by Jacob and Monod in their seminal work in 1961 [1]. The lac operon, which encodes structural genes for the three enzymes involved in lactose metabolism (β-galactosidase, galactoside permease, and thiogalactoside acetyltransferase), is subject to both negative and positive regulation during transcription, depending on the availability of lactose in the medium [2]. Although regulation of lac operon has been the subject of intense genetic, biochemical, biophysical, and structural studies, the structural information regarding the central enzyme of the system, E. coli RNAP, has been lacking until recently. In the past 5 years, however, spectacular advances have been made in RNAP structural studies, including the solving of crystal structures of bacterial and yeast RNAPs, RNAP complexes with nucleic acids, and domains of RNAP subunits with DNA and transcription factors [3–11]. In this review, we present structural information that is currently available for bacterial RNAPs, with special emphasis on their functional implications for the regulation of lac operon, and attempt to integrate them into preexisting body of biochemical and genetic data.
2 RNAP structure and function
2.1 General overview
The DNA-dependent, multisubunit RNAP of E. coli is an evolutionarily-conserved protein which shares functional and structural relatedness with RNAPs of eubacteria, archaebacteria, yeast, and mammals [12–14]. The catalytically competent core has a conserved subunit composition of
A transcription cycle carried out by RNAP proceeds through three stages: initiation, elongation, and termination, all of which are targets of regulation. During initiation, RNAP holoenzyme binds specifically to two conserved hexamers in the promoter at nucleotide (nt) positions −35 and −10 relative to the transcription start site
E
In the absence of external regulatory input, many naturally occurring promoters, including
2.2 Structure of RNAP
2.2.1 Escherichia coli
RNAP is the most extensively characterized bacterial RNAP, both genetically and biochemically. However, the structure of this enzyme determined by cryo-electron microscopy (EM) has a relatively low resolution of
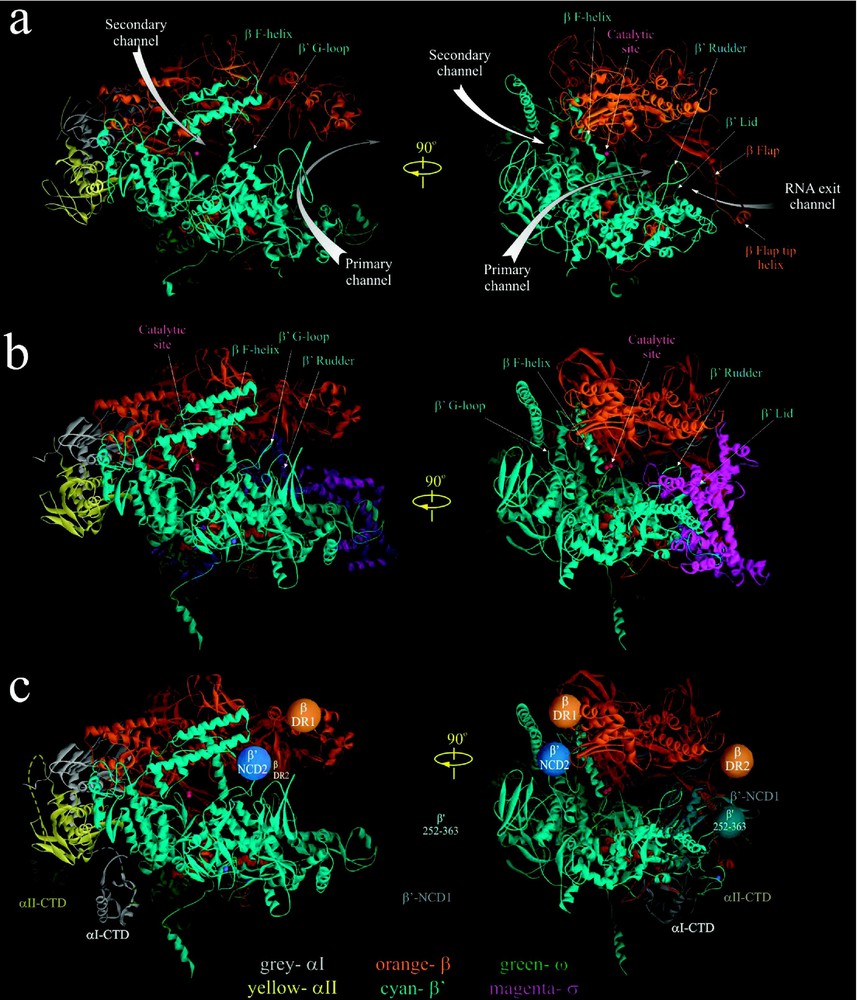
High-resolution crystal structures of Taq RNAP core [3] (a) and Tth RNAP holoenzyme [4] (b). In (c) the approximate locations of αI- and αII-CTD structures [10], as well as positions of nonconserved domains of E. coli β and
High-resolution crystal structures of Taq RNAP core [3] (a) and Tth RNAP holoenzyme [4] (b). In (c) the approximate locations of αI- and αII-CTD structures [10], as well as positions of nonconserved domains of Lire la suite
2.2.2 Non-conserved domains
Despite their overall similarity, the Taq/Tth and E. coli RNAPs also have distinct structural dissimilarities. The major differences reside in four large non-conserved domains of β and
The reported RNAP structures still lack several elements. These include a 109-residue long portion of the non-conserved
2.3 Structure of
E. coli
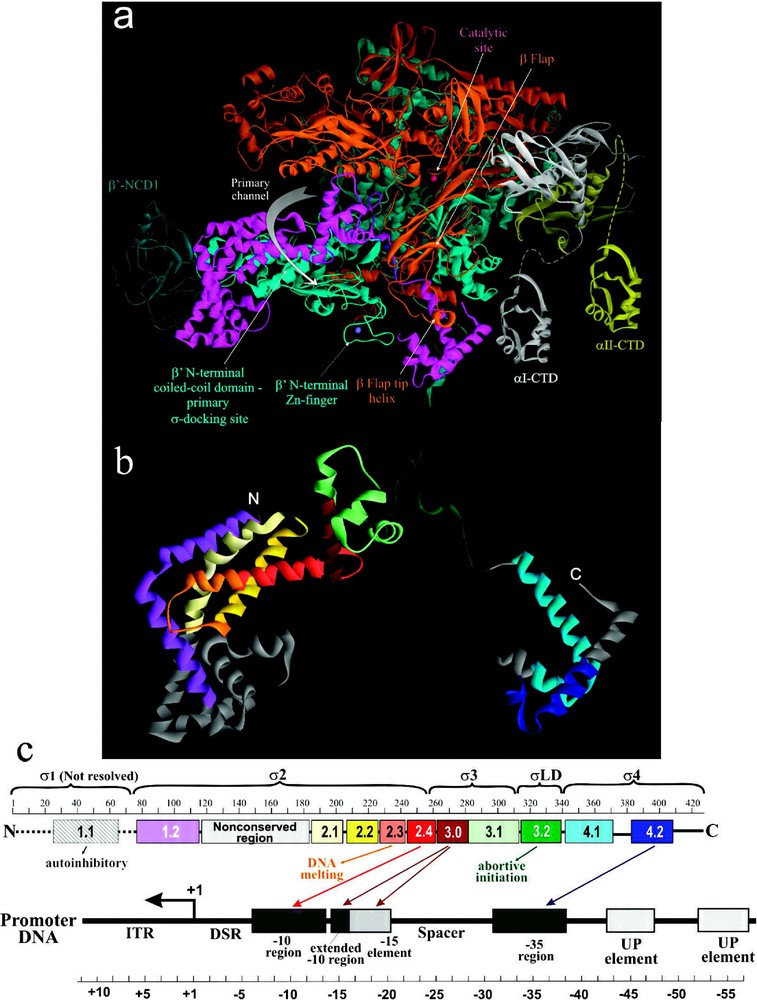
The structural and functional organization of σ. (a) View of Tth RNAP holoenzyme obtained by rotating the left view shown in Fig. 1b 180° about the vertical axis with color coding as above. (b) Ribbon diagram of σ from Tth holoenzyme structure [4]. Colored regions correspond to the evolutionarily conserved domains of σ as shown in (c). (c) Functional map of σ. Top diagram is a linear representation of σ showing structural domains and conserved regions (numbered and color-coded boxes). Bottom diagram shows DNA promoter regions and interactions made by σ DNA binding domains. Masquer
The structural and functional organization of σ. (a) View of Tth RNAP holoenzyme obtained by rotating the left view shown in Fig. 1b 180° about the vertical axis with color coding as above. (b) Ribbon diagram of ... Lire la suite
The extreme N-terminal portion of σ polypeptide (
Recent biochemical and biophysical evidence suggest a multistep and cooperative process of σ-core binding [45,48,49,51,52], which is characterized by a
2.3.1 Conformational flexibility
Structural organization of RNAP is described as a fixed core mass surrounded by four mobile modules [39,49]. The fixed core module comprises two αNTDs, ω subunit, and parts of β and
The intrinsic flexibility of RNAP is also evident during its conversion from core to holoenzyme, which leads to changes in the positions of all structural domains of core by 2 to 12 Å. The RNA exit channel, which now accommodates σ3, becomes constricted by the β flap domain which is shifted by
2.4 RNAP-promoter interactions
Structural information on how RNAP recognizes and binds promoter DNA was gleaned from two crystallographic studies: the 2.4-Å-resolution structure of Taq σ4 in complex with −35 element DNA (from position −26 to −37) [9], and the 6.5-Å-resolution structure of Taq holoenzyme binary complex with fork-junction promoter DNA [8], which partially mimics the RPo. The latter complex contained ds DNA from position −12 to −45, and the ss nt-DNA from −11 to −7. Complemented with vast biochemical, biophysical and genetic data accumulated in the last 20 years, these studies led to construction of structural models of binary RNAP-DNA complexes RPc and RPo [8,49].
2.4.1 RPc
In RPc, the ds promoter DNA lies on the surface of holoenzyme, outside the RNAP active-site channel (Fig. 3a). The RNAP-bound ds DNA appears to be bent at three places: at position around −25, where DNA may bend or kink by
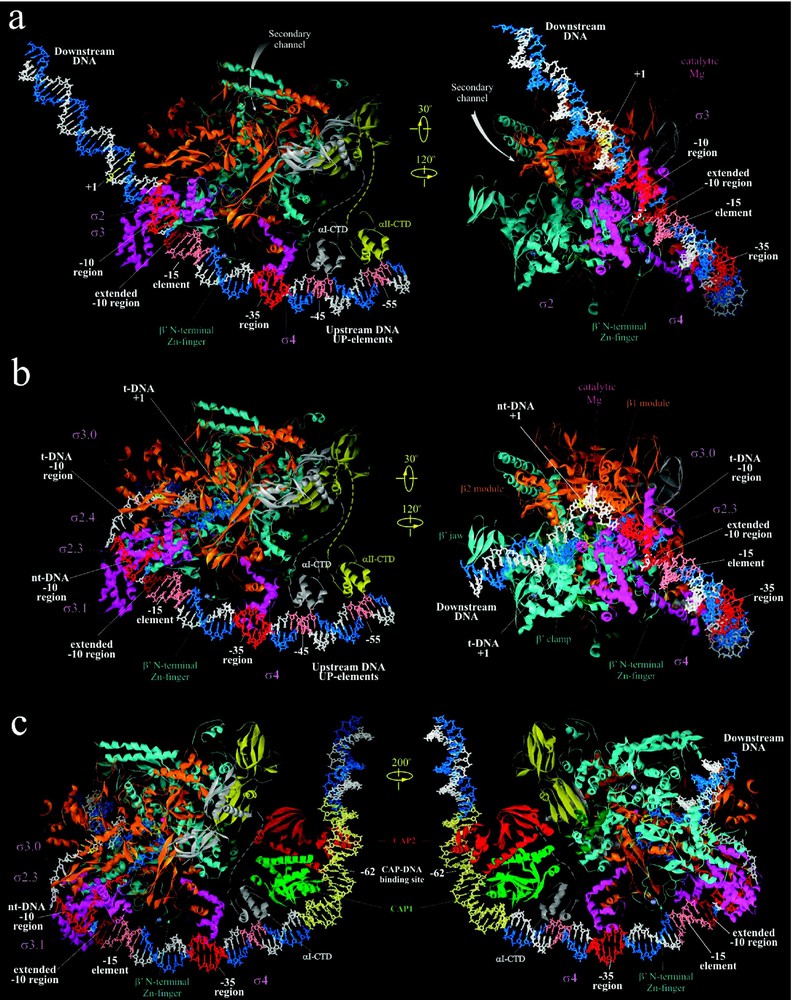
Structural models of RNAP-promoter DNA complexes. (a) Model of Taq RPc based on [8]. (b) Model of Taq RPo adapted from [8,10]. (c) Model of ternary complex of CAP, Taq RNAP and
Structural models of RNAP-promoter DNA complexes. (a) Model of Taq RPc based on [8]. (b) Model of Taq RPo adapted from [8,10]. (c) Model of ternary complex of CAP, Taq RNAP and Lire la suite
All sequence-specific contacts in RPc with the conserved −10, extended −10, and −35 elements of the promoter are mediated by the σ-DNA recognition elements: regions 2.2–2.4, 3.0, and 4.2, respectively (Fig. 2). Interaction with −10 element occurs through base-specific contacts of σ region 2.4 residues (reviewed in [56]). According to the structure, the interacting residues are most likely Q260 and N263 (numbering according to Taq σ70), which face the major groove of the DNA at position −12 and could interact with either A of the template strand or T of the non-template strand, or both. The essential conserved basic residues in regions 2.2 and 2.3, R237 and K241, are positioned to interact with the phosphate DNA backbone of the non-template strand at positions −15/−14 and −13, respectively. The extended −10 element is recognized by two residues of σ region 3.0, H278 and E281 [57] that are facing the major groove of the extended −10 element. E281 makes base-specific interactions with T at position −13 of the non-template strand, whereas H278 may interact nonspecifically with the negatively charged DNA backbone at positions −17/−18 of the non-template strand. Additionally, residues R274, V277, H278 and E281 of σ region 3.0 may be involved in base-specific and nonspecific interactions in the major groove of the ‘−15 enhancer’ element (−17/−12 segment) [32]. More precise assignment of σ residues is not possible yet due to the lack of a high-resolution structure of RPc.
The atomic structure of the complex of Taq σ4 with −35 LacUV5 promoter element provided more detailed information on σ region 4.2-DNA interactions [9]. These interactions occur through ten conserved residues of the helix-turn-helix motif of σ region 4.2 [9,56]. Among these, four key residues are responsible for base-specific DNA recognition: R409, E410, R411 and Q414. On the template strand, the side chain of R409 interacts with −31G and −30T through hydrogen bonds and van der Waals contacts, respectively, and the side chain of E410 makes hydrogen bond and van der Waals contacts with −33C. R413 may have van der Waals contacts with −32T. On the non-template strand, Q414 and R411 establish hydrogen bond and van der Waals interactions with −35T. Additionally, residues R413, R387, L398, E399 and R379, T408 provide nonspecific but strong ionic, polar and van der Waals interactions with phosphate and ribose backbone at positions −31, −32, −33 of the template or −35 and −36 of the non-template DNA.
Depending on the length of the spacer, the extent of DNA bending and the presence of non-canonical enhancer elements between −35 and −10 regions, such as −15 enhancer, residues of σ region 3.0 (R274, V277, H278, E281) and
2.4.2
The proposed model structure of RPo was constructed based on the structure of RNAP-fork junction DNA [8]. It includes both strands of DNA from −60 to +25, the trajectory of which was inferred from footprinting data (Fig. 3b) [8,49]. Unlike RPc, where ds DNA downstream of position −5 does not have strong contacts with RNAP, in RPo both strands of DNA up to +20 position are fully enclosed inside the RNAP main channel (Fig. 3b). The location of the upstream portion of ds DNA (from −60 to −17) is similar to that in RPc, however, at −16 the DNA makes a sharp 37° bend toward the RNAP. The two DNA strands separate at position −11, and take drastically different paths downstream for ∼15 nucleotides until they reanneal at position +3, thus creating the ‘transcription bubble’.
The initial melting of DNA is thought to nucleate from the A/T bp at position −11 [58]. Highly conserved aromatic residues of σ region 2.3, F248, Y253, and W256, are exposed on the surface of σ and positioned to interact with the unpaired bases of the non-template strand of the transcription bubble [8,49]. F248 and Y253 are proximal to −8/−9 and −9/−10 bases, respectively. W256 appears to stack on the exposed face of the
The model structure of RPo does not allow unambiguous identification of the amino acid residues involved in interactions with the ss and ds DNA of the promoter, specifically in the active site channel and in the downstream DNA binding clamp. However, it provides a comprehensive view of RNAP-DNA interactions which lead to promoter melting and formation of RPi. More detailed features of these interactions can be predicted based on the model and tested experimentally.
2.5 lac Operon
Unlike the ideal/consensus promoter DNA used in the structural studies and modeling of RPc and RPo, the Plac of the lac operon in E. coli deviates significantly from canonical promoter [24–26]. These deviations include substitutions of consensus G for T at −34 in the −35 element (TTTACA), and AA for GT at −9/−8 in the −10 element (TATGTT).
In vivo, transcription initiation from
During transcription activation, CAP-homodimer complexed to its effector, cAMP, specifically binds to its cognate 22 bp binding site centered at position −62 of
A structural model of the ternary initiating complex containing CAP, RNAP and
Acknowledgments
Research in S.B.'s laboratory is funded by a grant from NIH. We are grateful to Richard Ebright for providing coordinates of the modeled RNAP-DNA-CRP-αCTD complex. We apologize to those whose work was not cited because of space limitations.