

1 Introduction
Phragmites australis [Cav.] Trin. ex Steud. is a Subcosmopolite clonal grass species, rather common all over the world; it is abundant in North America and Eurasia and widespread in Africa, Australia and South America [1]. Since the 1950s [2], a decline of reed beds has been detected in Central Europe (for a general overview: [3–6]). This phenomenon was defined as “a visible abnormal and non-reversible spontaneous retreat, disintegration or disappearance of a mature stand of common reed (Phragmites australis) within a period not longer than a decade” [5].
The proposed parameters to diagnose the reed die-back syndrome (RDBS hereafter) are manifold and refer to different plant traits. Some symptoms related with the reed decline are, for example, smaller than normal, weaker culms, high incidence of dead or decaying rhizomes, roots and buds, prematurely senesced culms, abnormal lignification and suberization within the adventitious root apices, presence of callus blocking the internal aeration of aerenchyma, clumping habit [4,7–11]. The clumped growth is a peculiar trait and seems to be a consequence of a blockage in the vascular tissue, resulting in the apical dominance breaking down [9,12]. The shoot density, shoot dry mass, leaf area index, time of flowering, number of flowering heads, structure of the root-system are further examples of biometric data indicating die-back conditions for P. australis from different sampling sites in northern Europe; the reed retreat from deep waters is also considered an indication of die-back [5].
Although reed is both directly and indirectly influenced by eutrophication [13], it has been noticed that the reed decline is not restricted to polluted lakes [4]. It is well known that P. australis can thrive without showing obvious signs of decline or damage in hypertrophic lakes [14–18] and can play a role in heavy metal accumulation [19]. The common reed behaves as a highly invasive species in some regions of the world, such as North America [20–28] and even parts of Europe [29]. Nevertheless, P. australis decline is a well-known phenomenon in Europe and it seems to affect the reed-beds regardless of their water quality.
So far, it has generally been suggested that the cause of the decline is due to a combination of factors. The situation is highly complicated since the same factors can be implicated in either decline or increase of reed populations. For most, the RDBS has been attributed to a combination of unnatural conditions, primarily including artificially stabilised water tables and increased eutrophication, but also exacerbated by sediment type, wave action, insect attack, low genetic diversity, grazing, algal mats and algal wash, and by introduction of alien grazers such as muskrat (Ondatra zibethicus L.) and coypus (Myocastor coypus Molina). There are large amounts of specialized literature available describing the patterns and tackling the causes of reed decline in most regions of Europe, but the (sub-)Mediterranean areas are a notable exception. Van Der Putten [5] reported that in the Mediterranean, characterized by hot and dry summers, P. australis shows a vigorous growth even in eutrophicated areas, with a tendency to expansion rather than retreat. Reed die-back in the Mediterranean has not actually been fully investigated yet. Lack of data is perhaps the main reason why the reed die-back is not believed to be an important issue in the Mediterranean and sub-Mediterranean regions of Europe. In the brackish waters of the Po Delta (NE Italy) Fogli et al. [30] reported on a decline of reed populations comparable to the RDBS. At Lake Trasimeno (central Itay), one of the largest freshwater ecosystems in Mediterranean Italy up to 50 years ago, during the last decades the reed bed has shown increasing signs of decline, suggesting the possible occurrence of die-back symptoms [31,32].
Reed beds are extremely important for biodiversity conservation in all the regions where Phragmites australis can be considered a native species, and particularly in Mediterranean areas, where the hydrologic balance of wetlands may be very fragile. In these areas, besides well known threats such as land reclamation, habitat fragmentation, water uptake, eutrophication, the climatic conditions may also play a role in damaging wetlands and their important functions, which are already suffering the effects of global warming. Although the reed beds do not show the highest biodiversity values when compared to other plant communities, the presence of tall aquatic macrophytes in shallow standing waters offers a specific environment for many other components of the ecosystems, from migrating birds to insects to rare planktonic communities [33,34]. Furthermore, they are highly vulnerable to invasions by alien species, which represent an alarming threat [35,36]. It appears therefore imperative to identify the patterns of change which are nowadays affecting these ecosystems and detect the processes underpinning these changes, in order to inform and support those involved in the biodiversity conservation of the most delicate habitats.
In this framework, the specific aim of this study was to use a set of life-history traits to ascertain whether the population changes observed in the reeds in Lake Trasimeno are an indication of RDBS. Further, we investigated the role of eco-hydrological conditions in the pattern-generation of trait syndromes.
2 Materials and methods
2.1 Study area
The study was performed at the Lake Trasimeno (Fig. 1), a shallow lake filling a wide basin in peninsular Central Italy at an average altitude of 257 m a.s.l.; the total area of the present basin, lake included, is 383.4 km2. The average surface of the lake is 121.5 km2 and the average water column depth is 4.2 m [37]. This lacustrine ecosystem is marred by several environmental problems. The water level is subject to great variation due to total dependence on rains and lack of notable tributaries. The anthropic impact is heavy, especially because of the intensive land use in the basin (agriculture and pig farms). The water level of Lake Trasimeno was increased at the end of the 1950s, by an artificially induced influx of water that totally submerged the flat shores [38]. It was an attempt to contrast the natural tendency of the lake to become swampy because of the constantly negative rainfall/evapotranspiration balance. Still nowadays, some intrinsic features of the lake tend towards a worsening of water quality, e.g. the long time, 24.4 years, for water replacement, and the high evaporation rate, 155 × 106 m2/year, due to the laminar shape of the lake [39,40].
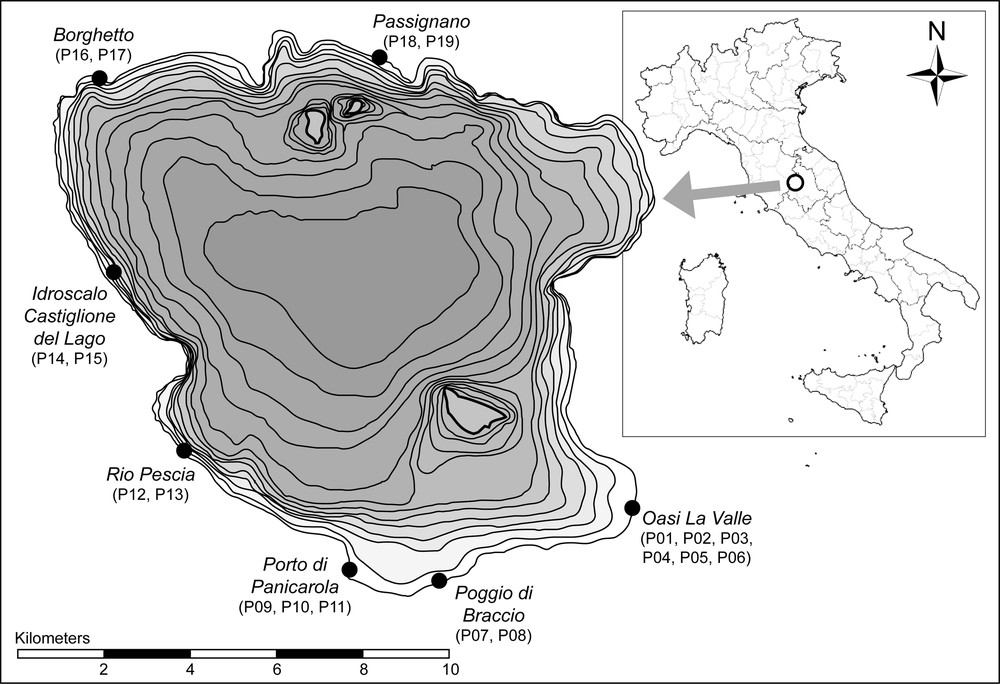
Study area at Lake Trasimeno, Central Italy (bathymetric equidistance on the map: 50 cm); in brackets the plot codes at each site.
Based on climatic data recorded in Monte del Lago climatic station (295 m a.s.l.; data from a period of 30 years), applying the bioclimatic indexes proposed by Rivas-Martínez et al. [41], processed according to Rivas-Martínez and Rivas-Saenz [42], the study area belongs to the Mediterranean pluviseasonal-oceanic bioclimate, upper mesomediterranean low subhumid belt [43]. The mean annual temperature is 13.6 °C, the mean annual precipitation is 747 mm, and the mean potential evapotranspiration is 761 mm.
During the last decades, the reed bed of Lake Trasimeno has been affected by a progressive decline, mostly evident from a notable retreat and certain abnormal traits, which have been recently accentuated [31,32,44,45]. In the last 50 years the surface occupied by the reeds along the lake's shore has decreased; a loss of about 66% of its total surface can be calculated only in the period between 1988 and 2005 (data in [46–48]). According to a diachronic analysis based on the comparison of aerial photographs from different periods during the last half century, a remarkable retreat of the reed bed has occurred in the SE quadrant of the lake's shore, in the area La Valle [49].
2.2 Sampling sites
The investigation was carried out in 19 plots (1 m2) located in seven different sites along the lake shore (Table 1, Fig. 1). The plots were located at different distance from the shore, in order to cover a water gradient from dry to permanently flooded habitats. The plots were located both in sites without any evident macroscopic sign of decay and in areas seemingly affected by retreat and/or decline (La Valle site), as indicated by Filipponi et al. [49].
Names, codes and geographical coordinates of sites and plots.
| Site | Plot code | Geographical coordinates |
| Oasi “La Valle” | P01 | N43° 05,699′ E12° 11,034′ |
| P02 | N43° 05,697′ E12° 11,036′ | |
| P03 | N43° 05,694′ E12° 11,044′ | |
| P04 | N43° 05,684′ E12° 10,925′ | |
| P05 | N43° 05,681′ E12° 10,946′ | |
| P06 | N43° 05,686′ E12° 10,983′ | |
| Poggio di Braccio | P07 | N43° 04,794′ E12° 07,580′ |
| P08 | N43° 04,762′ E12° 07,594′ | |
| Porto di Panicarola | P09 | N43° 05,020′ E12° 06,212′ |
| P10 | N43° 04,859′ E12° 06,518′ | |
| P11 | N43° 04,848′ E12° 06,523′ | |
| Rio Pescia | P12 | N43° 06,752′ E12° 02,943′ |
| P13 | N43° 06,747′ E12° 02,933′ | |
| Castiglion del Lago | P14 | N43° 08,709′ E12° 01,952′ |
| P15 | N43° 08,254′ E12° 02,472′ | |
| Borghetto | P16 | N43° 11,071′ E12° 02,161′ |
| P17 | N43° 11,064′ E12° 02,154′ | |
| Passignano | P18 | N43° 11,412′ E12° 06,491′ |
| P19 | N43° 11,415′ E12° 06,495′ |
2.3 Trait measurements
In order to analyse and quantify the signs of decline, 13 parameters were selected from those documented in literature, and monitored. The list of selected traits is given in Table 2. In each plot, 15 stems of Phragmites australis were randomly chosen and measured. The traits were measured and monitored in the 19 plots for two years (vegetative seasons 2006 and 2007), from the beginning of April to the end of August.
Selected plant traits and environmental factors used in the monitoring of Phragmites australis population at Lake Trasimeno.
| Name of the plant trait | Unit of measurement | Sampling scale type |
| Number of nodes | Number | RM |
| Growth rate of the n. of nodes | Direction coefficient, no/day | RC, RM |
| Stem height | cm | RM |
| Growth rate of the stem height | Direction coefficient, cm/day | RC, RM |
| Stem diameter | mm | RM |
| Growth rate of the stem diameter | Direction coefficient, mm/day | RC, RM |
| Stem density | no/m2 | RC |
| Dead buds | no/m2, % | RC |
| Flowering rate | no/m2, % | RC |
| Clumping habit | no/m2 | RC |
| Rhizome diameter | mm | RM |
| Lateral root diameter | mm | RM |
| Lateral root amount | Class: 1–5 | IC |
| Environmental factor | Unit of measurement | Sampling scale type |
| Water depth | cm | RM |
| Standing litter | Class: 1 = scarce or absent, 2 = abundant | N |
The number of nodes, stem height and stem diameter were measured fortnightly (n = 15 stems per plot). The growth rates of the three above-mentioned traits were calculated for each plot, considering the slope (direction coefficient) of the regression line of the three parameters. The stem density and clumping habit were measured at the end of the vegetative season (end of August). The flowering heads and prematurely dead buds were also measured fortnightly. The rhizomes and roots were measured at the end of August. The amount of lateral roots was estimated using a 5-class interval scale (1: very few, 2: few, 3: medium amount, 4: many, 5: very many).
The environmental factors investigated are also included in Table 2. The type of flooding and the presence/absence of standing litter in the sediment - both presumed to be important for driving vegetation dynamic processes in the reed beds - were reported. The water depth was measured at the start/end of the period of field activity (beginning of April-end of August) each of the two years, in order to show any flooding and its periodicity (permanent/temporary).
2.4 Data analysis
The data gathered were used to build a ‘13 × 19’ matrix (traits x plots) that was used for a cluster analysis. The following strategy was used in the data processing: reduction of the data dimensions by PCA and selection of the Principal Components, which can better explain the total variance; use of fuzzy clustering, fuzzy c-means [50], on the selected Principal Components; identification of the optimal partition by using the Dunn index [51]; identification of the Boolean partition of the plots, induced by the fuzzy partition. For the data analysis, the SYN-TAX 5.0 package [52] was used. The statistical significance of the measured data for the resulting groups was tested by ANOVA; the post hoc analysis was based on Fisher's Protected LSD test.
3 Results
The macro-morphologic and phenologic data differed widely among the 19 plots. Looking at the 13 positive eigenvalues resulting from the PCA, the first four can be seen to account for about 80% of the total variance (Table 3). The fuzzy c-means, applied to the first four principal components (with a fuzziness coefficient = 2), showed that the optimal partition is formed of four clusters. Table 4 shows the correlation coefficients among the first four principal components (PC) and the original variables.
Eigen values resulting from the PCA; the first four account for about 80% of the total variance.
| Eigenvalues | 4.947 | 2.431 | 1.884 | 1.024 | 0.794 | 0.769 | 0.473 | 0.293 | 0.191 | 0.089 | 0.068 | 0.023 | 0.133 |
| Eigenvalues (%) | 38.05 | 18.70 | 14.49 | 7.88 | 6.11 | 5.92 | 3.64 | 2.26 | 1.47 | 0.68 | 0.52 | 0.18 | 0.10 |
Correlation coefficients among the first four principal components (PC) and the original variables.
| PC1 | PC2 | PC3 | PC4 | |
| Number of nodes | 0.894 | 0.199 | 0.021 | −0.052 |
| Growth rate of the number of nodes | 0.869 | 0.024 | −0.141 | −0.086 |
| Stem height | 0.764 | −0.344 | −0.038 | 0.360 |
| Growth rate of the stem height | 0.248 | 0.595 | −0.354 | 0.492 |
| Stem diameter | 0.494 | −0.589 | −0.197 | −0.128 |
| Growth rate of the stem diameter | 0.221 | 0.941 | 0.041 | 0.185 |
| Stem density | 0.690 | −0.424 | −0.390 | 0.331 |
| Flowering rate | 0.790 | −0.162 | −0.214 | −0.245 |
| Prematurely dead buds | −0.520 | −0.447 | 0.281 | 0.626 |
| Clumping habit | −0.576 | −0.140 | −0.229 | −0.141 |
| Rhizome diameter | 0.202 | 0.000 | 0.894 | 0.033 |
| Lateral root diameter | 0.481 | −0.334 | 0.646 | 0.029 |
| Lateral root amount | −0.692 | −0.387 | −0.389 | 0.092 |
The Boolean partition induced by the fuzzy partition, according to the highest membership weight (Table 5), grouped the 19 plots in four clusters as follows:
- • Cluster 1 (CL1): P01, P02, P03, P05, P06;
- • Cluster 2 (CL2): P17, P18, P19, P12, P13, P09, P10;
- • Cluster 3 (CL3): P16, P07, P08, P15, P04, P11;
- • Cluster 4 (CL4): P14.
Membership weights of the 19 plots per cluster, resulting from the Boolean partition; the highest values in each cluster are highlighted in bold: they point out the composition of the groups.
| Cluster 1 | Cluster 2 | Cluster 3 | Cluster 4 | |
| P01 | 0.8380 | 0.0285 | 0.1090 | 0.0245 |
| P02 | 0.5729 | 0.0949 | 0.2884 | 0.0438 |
| P03 | 0.8902 | 0.0177 | 0.0760 | 0.0161 |
| P04 | 0.3489 | 0.1321 | 0.4712 | 0.0477 |
| P05 | 0.5113 | 0.0853 | 0.3581 | 0.0453 |
| P06 | 0.4526 | 0.1034 | 0.2142 | 0.2298 |
| P07 | 0.2694 | 0.2289 | 0.3943 | 0.1075 |
| P08 | 0.1889 | 0.0583 | 0.7343 | 0.0185 |
| P09 | 0.1823 | 0.3429 | 0.3082 | 0.1666 |
| P10 | 0.0956 | 0.4810 | 0.3904 | 0.0330 |
| P11 | 0.1126 | 0.2933 | 0.5592 | 0.0349 |
| P12 | 0.0351 | 0.8623 | 0.0853 | 0.0172 |
| P13 | 0.0640 | 0.7516 | 0.1541 | 0.0302 |
| P14 | 0.0089 | 0.0060 | 0.0081 | 0.9770 |
| P15 | 0.2063 | 0.2340 | 0.4670 | 0.0927 |
| P16 | 0.1004 | 0.0584 | 0.8301 | 0.0111 |
| P17 | 0.2445 | 0.3288 | 0.2962 | 0.1306 |
| P18 | 0.0147 | 0.9382 | 0.0394 | 0.0077 |
| P19 | 0.0394 | 0.8332 | 0.1077 | 0.0197 |
For each cluster of plots, the median, average, maximum and minimum values, 1st and 3rd quartiles, mild and extreme outliers of the 13 plant traits were reported in box-and-whisker charts (Fig. 2). The statistical significance of the measured data (stem height, stem diameter, no of nodes and relative growth rates, the latter expressed respectively in cm/day, mm/day, no/day; lateral root amount and diameter, rhizome diameter, flowering rate, dead buds, clumping and stem density) is also reported in Fig. 2. The data analysis indicated different features for the resulting groups of stands of Phragmites australis. The considered parameters outline a very consistent pattern for the resulting clusters and are briefly described as follows.
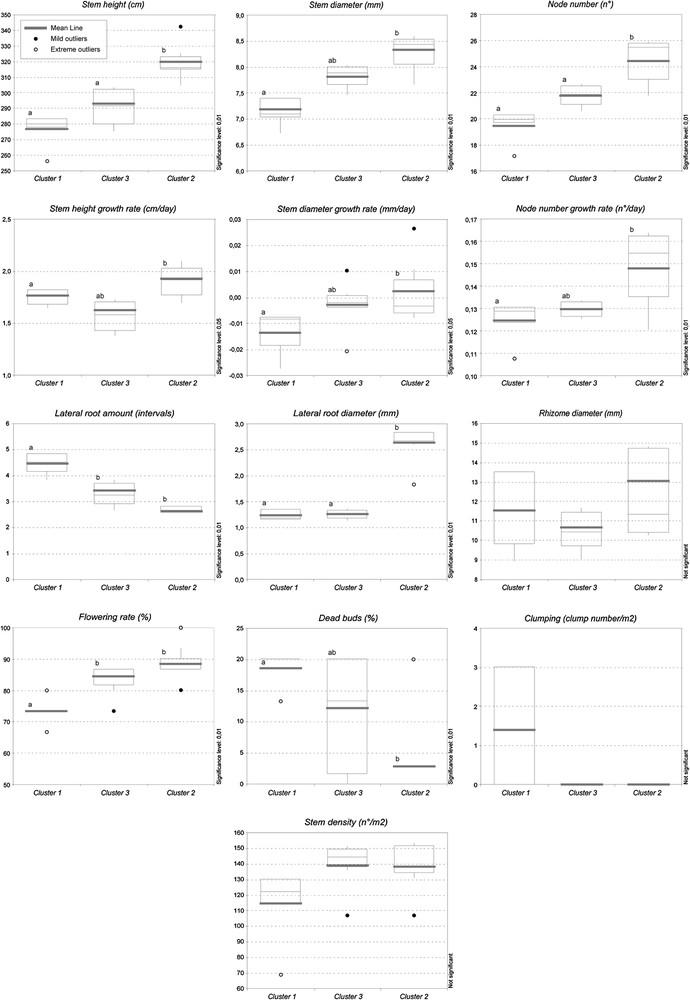
Box-and-whisker charts for the identified clusters of plots (Cluster 4 is not reported since it includes only one plot); median, average, maximum and minimum values, 1st and 3rd quartiles, mild and extreme outliers of the 13 indicated plant traits are reported. Different letters indicate statistically significant differences according to Fisher's protected LSD test; the significance level is indicated.
Cluster 1 (five plots) shows the lowest values for stem height, stem diameter, node number and growth rate of the last two traits. The rate of prematurely dead buds is the highest, the stem density and the flowering rate are the lowest. The lateral root diameter is low, especially when compared to Cluster 2, while the amount of lateral roots is the highest. Cluster 1 includes the only plots where the clumping habit was observed; the growth rate of the stem diameter is more prominently negative. As a whole, the reed stands of the Cluster 1 show a declining, non-vigorous condition together with some typical RDBS symptoms.
Cluster 2 (seven plots) shows, on the contrary, the highest values for stem height, stem diameter, node number and their growth rates; the diameters of lateral roots and rhizomes are also the highest in this group of plots, while the lateral roots are not extremely dense. The flowering rates are the highest, while the presence of dead buds is the lowest on average. The clumping habit was never detected in these plots. As a whole, Cluster 2 groups the plots where the reeds are in the most vigorous condition and are totally lacking in symptoms of decline.
Cluster 3 (six plots) shows in general intermediate values between Clusters 1 and 2. Only the growth rate of the stem height and the rhizome diameter reach the lowest values in these plots. The stem density is generally high. As a whole, the reed stands included in Cluster 3 appear to be in an intermediate condition; considering that prominent symptoms of RDBS are not present, their state can be described as sub-optimal.
Cluster 4 includes only one plot (P14) and thus it has not been included in the box-and-whisker charts; for this Cluster, the recorded values are the following: average stem height (n = 15): 2.073 m; av. stem diameter (n = 15): 6.7 mm; av. number of nodes (n = 15): 21.2; av. stem height growth rate: 1.419 cm/day (n = 15); av. stem diameter growth rate: 0.027 mm/day (n = 15); av. node number growth rate: 0.100 nodes/day (n = 15); stem density: 46.0 stems/m2; prematurely dead buds: 0.0; flowering rate: 66.7%; clumping habit: 0.0 clumps/m2; av. rhizome diameter: 13.70 mm (n = 5); av. lateral root diameter: 1.09 mm (n = 5); av. lateral root amount: 2.8 (interval scale, n = 5). The stem height and diameter are very low, although the latter shows a remarkable growth rate; the density is extremely low, however neither dead buds nor clumping habit are present. The other values are rather close to Cluster 1. Cluster 4 generally shows a non-vigorous, suffering condition, although not so prominent as in Cluster 1; for this reason it can be defined as sub-declining.
As a whole, the most significant parameters to emphasize the declining condition, according to the Fisher's Protected LSD test (ANOVA), are the stem height and diameter, the node number and its growth rate, the lateral root amount and diameter, the flowering rate and the presence of dead buds (p < 0.01), followed by the stem height growth rate and the stem diameter growth rate (p < 0.05).
The flowering rate at the end of the season (end of August) and the delay in the starting of flowering, expressed as number of days after the first plant begins to bloom, are reported in Fig. 3, as average values for each cluster. Lower values of flowering rate have been recorded in the plots where a remarkable delay in the start of the flowering was observed (especially Clusters 1 and 4).
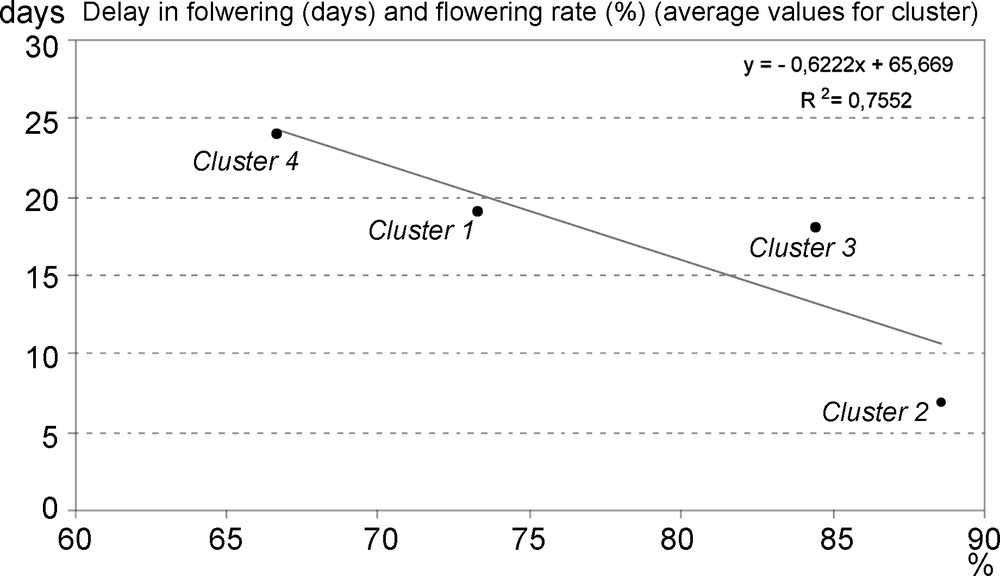
Flowering rate at the end of the season (end of August) and delay in the starting of flowering, expressed as number of days after the first plant begins to bloom; average values for each cluster.
Regarding the environmental features of the 19 plots, flooding is shown in Fig. 4: the median, average, maximum and minimum values, 1st and 3rd quartiles, mild and extreme outliers of the water depth at the end of August were reported in box-and-whisker charts for the three main clusters. Water is not present at the end of August in Cluster 4. The 19 plots relate to two basic types: temporarily or permanently flooded, the latter still being totally submerged at the end of August, the period when, due to climatic reasons, the water level reaches its minimum. All the plots from Cluster 1 are permanently flooded, while all the plots from Cluster 2 are flooded only in winter-early spring and are dry at the end of August. Cluster 3 includes plots of the two types, although the temporarily flooded type prevails; Cluster 4 is flooded only in winter.
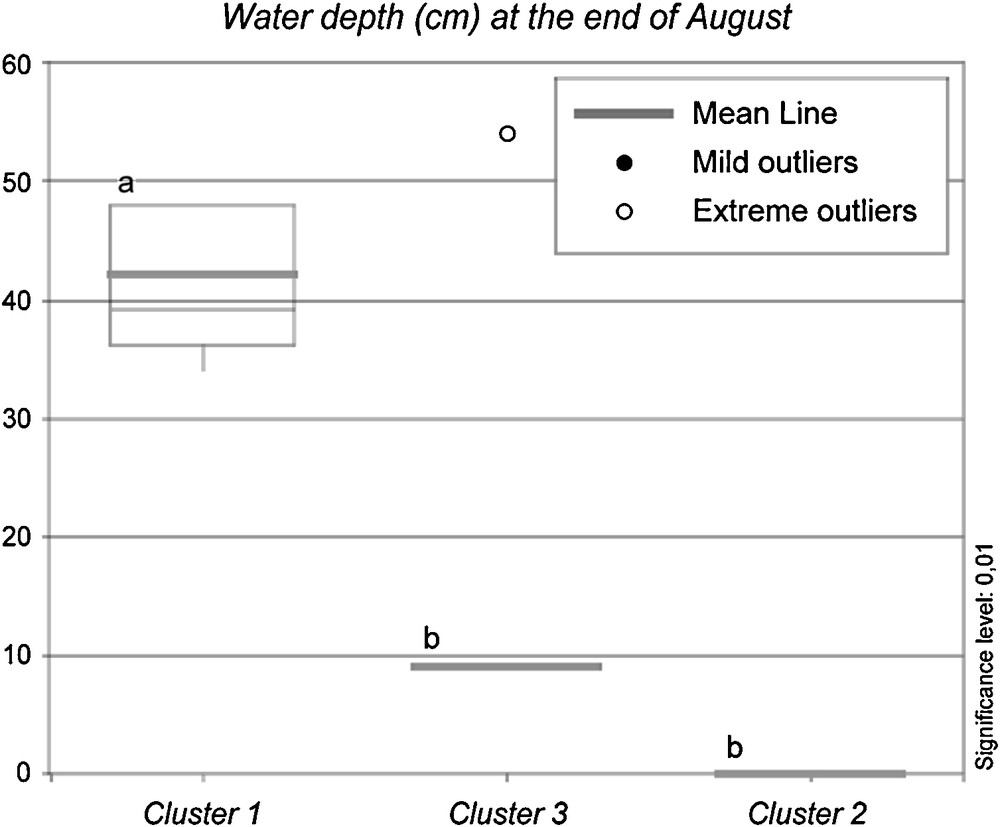
Box-and-whisker chart including median, average, maximum and minimum values, 1st and 3rd quartiles, mild and extreme outliers of the water depth at the end of August for the three main clusters of plots (Cluster 4 is not reported since it includes only one plot).
We calculated the number of plots for each cluster affected by presence of standing litter: all the plots (100%) from Cluster 1 are rich in organic deposits, mainly composed of autogenous reed litter. The same is true for Cluster 4. On the contrary, all the plots (100%) from Cluster 2 are lacking in litter. The plots from Cluster 3 are more variable; standing litter is present in 33% of the plots, but never in large amounts.
4 Discussion
4.1 Reed decline features and significant traits
On the basis of the above results, it was possible to detect a condition of strong decline for the plots of Cluster 1, all located in the S-Eastern sector of the lake (Fig. 1), highlighted by the anomalous values of several morphological attributes. Traits connected with the reed growth (stem height and diameter, node number and the relative growth rates), together with the clumping habit, reduced flowering rate, flowering delay and a relatively high incidence of dead buds, indicate a clear condition of decline for this subgroup of plots. These symptoms are indicative of RDBS as described by Van Der Putten [5], and allowed us to confirm that the syndrome is present in central Italy.
Furthermore, using the progression of the decline symptoms as a basis, the four clusters could be related to different degrees of decline, from suffering to healthy, which can be listed as follows: suffering condition with typical RDBS symptoms, corresponding to Cluster 1; suffering condition without typical RDBS symptoms, corresponding to Cluster 4; sub-optimal condition, corresponding to Cluster 3; optimal condition, corresponding to Cluster 2. This is the first time that this type of classification, based on a multivariate analysis of different symptoms regarding specific plant traits, has been done.
Remarkably, a negative growth rate of the stem diameter was observed in the most declining stands (Cluster 1); this peculiar datum derives from the fact that, during the vegetative season, the new shoots are smaller than the previous ones and the average value decreases in time, as suggested by Engloner [53]. Similar trends were also observed by other authors, who described a decrease in the shoot diameter or height during the vegetative period in declining populations of Phragmites australis [30,54–58].
A high number and surface of lateral roots are generally considered an indication of vigorous state [5]; however, Clevering [59] reports an increased percentage of aquatic roots in relation with an increasing amount of litter in the substrate in flooded conditions. Our results fit with Clevering's data. The extra amount of lateral roots might be a reaction of the plants to the general condition of stress on the root system, due to the permanent submersion and the high presence of litter and organic matter, both phenomena occurring in Cluster 1.
4.2 Ecological traits
When we consider the ecological conditions of the plots we can see in Fig. 4 that the most declining stands (Cluster 1) are characterized by a permanent pronounced submersion (more than 40 cm on average at the end of the dry season) and by constant presence of standing litter (data reported in the text). The area where the most declining stands are located is the La Valle site; at the end of the 1950s it was occupied by a very wide reed bed, larger than 2 km [49,60]. When the artificial rise of the water level occurred at the end of the 1950s [38], this area was affected by a permanent deep flooding that still occurs nowadays, because of its flat morphology. This is also the area where the most notable retreat of the reed bed has been reported [49].
It is known that the water-table fluctuations condition both the root aeration and the mineral availability in aquatic ecosystems [61,62]. It has been reported that the reed die-back generally affects aquatic stands [63,64]. In spite of the reed's well-developed mechanisms of flood tolerance [65], altered or artificially stabilised water tables have been cited as possible causes of the reed decline [66–71]. Ostendorp [4] includes the alterations in the lake levels among the possible causes of reed die-back; disturbance and decline of reed beds have been observed after extreme flooding [72].
Several Authors reported that reed beds tend to retreat from deep waters and to narrow along the banks [4,10,11,73]; this phenomenon might be related to a lack of carbohydrates [74,75]. It has been reported that the water depth where reed beds may occur is related to carbohydrate availability [76]; this suggests that the retreat from deep waters might derive from a shortage in the carbohydrate stock. It has been suggested that an increase in the water table might favour fermentation processes to provide energy [77,78], supporting the theory of exhaustion of carbohydrates as one of the causes of reed die-back and retreat [79].
High water level or prolonged flooding may also support the eutrophication processes, since these are slowed down by accelerated mineralization [80]. In this sense, water level fluctuations may play a positive role [11].
Permanent submergence (≥ 40 mm) of seedling shoots (20–30 mm) can have negative effects on growth and prevent shoot emergence, especially where the inundating waters are rich in algae [71]. Furthermore, according to Rea [67], stabilised water levels are contributing to reed decline due to a lack of vegetative and generative reproduction; eutrophic conditions exacerbate this situation.
It has also been reported that the excessive production and deposition of litter, especially when it completely derives from reed itself, might result in P. australis growth reduction or decline [59,74,75,81–85]. Cízková et al. [11,86] showed that the accumulation of organic matter is harmful to reed stands. It was suggested that reed's ability to maintain itself in deep water is undermined when the substrate contains standing litter; this has been indicated as one of the explanations for the retreat of reed from the water front of littoral zones [59]. Furthermore, it has been pointed out that when the rhizosphere is not oxygenated enough, it can lead to anoxia and production of phytotoxins [87,88]. According to Clevering [59] deep waters and litter-rich soils create unsuitable conditions for P. australis growth; this author suggests that an artificial decrease of the water level might be a successful way to restore declining reed populations.
According to Ostendorp [4], it should be considered that reeds may show a delayed response to changes in environmental conditions, since “Phragmites rhizomes can act as a buffer against unfavourable as well as against good conditions”. Thus, the reed bed retreat and decline observed in the La Valle area might represent a delayed reaction to the past artificial changes of the water table. These results match with other studies which show that the spatial dynamics of the reed beds are linked with water level fluctuations [89–91]. The analyzed data confirm the idea that a long-term accumulation of autogenous litter, combined with permanent flooding, may lead to a condition of reed decline. In dry or fluctuating water conditions, the same reed population shows vigorous condition and no (or few) symptoms of decline.
5 Conclusive remarks
It has been presumed that the reed die-back syndrome hardly occurs in southern Europe, since high average temperatures are typical in the Mediterranean areas, and the break-down of litter should proceed more rapidly [5]. Some studies confirm this hypothesis, e.g. in Portugal no signs of RDBS have been reported [92]. In the present study, however, abundant deposits of litter together with permanent, artificially induced flooding seem to create the conditions for the occurrence of RDBS even in a Mediterranean area. These findings highlight the close interaction existing between hydrological processes and biological systems.
The only Italian area where reed decline has already been observed, up to now, is located at the mouth of the Po river at Sacca di Goro [30]. This area is included, geographically, in the Mediterranean Basin; however, it cannot be called Mediterranean, neither from a bioclimatic nor from a biogeographic point of view [93,94]. Thus Lake Trasimeno is the first area with a Mediterranean climate where RDBS has been detected, indicating a larger diffusion than suggested by Van Der Putten [5].
By creating a gradient of decline, we wish to stress that even the situations currently in sub-optimal conditions already show some symptoms of decay. Reed decline has been considered the first link in a chain which may lead to a deterioration of the littoral biocoenosis [95]. One of the most important targets of the research projects dealing with reed decline in Europe was to individuate useful parameters which could indicate which reed stands are susceptible to dying back [5]. Thus, the identification of a set of significant traits providing indications of a declining trend in the populations might be useful in ecosystem monitoring. The sub-optimal reed stands should be treated with the proper care, in order to halt the decaying process before it reaches a point of no return. The intensity of the reed care should be gauged proportionally to the observed degree of decline, in order to preserve these delicate wet ecosystems.
Disclosure of interest
The authors have no actual or potential conflict of interest pertaining to this journal submission.
Acknowledgements
This study was funded by “Servizio Protezione Ambientale e Parchi”, Perugia's local environmental conservation body; the Authors wish to thank Director Dr. Roberta Burzigotti and Dr. F. Velatta. We also thank the keepers on the natural reserve “Oasi La Valle”, M. Muzzatti and M. Chiappini, for their cooperation.
Vous devez vous connecter pour continuer.
S'authentifier