

1 Introduction
Organic dyes that contain π–electron systems in the molecular structure provide attractive materials for novel photonics and have the potential to manipulate light with remarkable precision. Natural candidates for organic photovoltaics can be found among the porphin families. The most effective dyes that can serve as photoconverters are porphyrins and phthalocyanines [1–3]. Because a large family of these dyes can be easily chemically modified by introducing metal ion in the centre of the molecular core and/or attaching the peripheral groups to the outer rings of the molecular skeleton, one can control charge-separation process followed by electron transfer when dyes are introduced in a photoelectrochemical cell (PEC).
Porphyrins constitute a class of molecules that contain four pyrrole rings linked by the methane carbon bridges (Fig. 1A and B). In basic porphyrin (P), four benzene rings are linked to the methane bridges, whereas the phthalocyanine (Pc) molecules are composed of four isoindole units (pyrrole rings linked by nitrogen atoms conjugated with the benzene rings (Fig. 1C–F). Chlorophylls and bacteriochlorophylls are natural pigments, whose molecular structure is based on the porphyrin skeleton [4] and which were also shown to be promising dyes for photovoltaics [5, 6].

Molecular structure of dyes: MgTPP (A), MgTNP (B), ZnPc (C), aromatic ZnPc (D), alkyl ZnPc (E), fluorine ZnPc (F).
The structural differences in the P and Pc lead to the differentiations in their spectroscopic behaviours and are also expected to affect the effectiveness of these dyes in the photoelectric response.
In the studies concerning the use of natural [5, 6] and synthetic porphin dyes [7–11] in light energy to electric energy conversion, we focus our attention on the processes that are involved in photoconversion and on the determination of its effectiveness. Since there is a competition between the charge separation process and deactivation processes occurring in the dye molecules, the study of dye ability for photoconversion is usually accompanied with the basic spectroscopic investigations that give information on (non-)radiative deactivation of the dye excited states.
2 Materials and methods
P and Pc dyes (Fig. 1) were purchased (Aldrich) and used without further purification. Dyes were dissolved in polyvinyl alcohol (PVA)/DMSO solution (15% v/v). The concentrations of dyes were: 10 μM and 1 mM for spectroscopic measurements (in a 1-cm quartz cuvette) and photoelectric studies in the PEC, respectively. Absorption spectra were monitored with a spectrophotometer Specord 40 (Carl-Zeiss, Jena) and steady-state fluorescence spectra were collected with a spectrofluorometer Hitachi 4500.
The relative fluorescence quantum yields of dyes were estimated on the ground of the absorption and fluorescence spectra according to the method described in Ref. [12] using the following equation:
| 1 |
| 2 |
The photoacoustic measurements were done with a one-beam spectrometer described elsewhere [14]. One modulation frequency (12 Hz) was used at the constant phase shift (Φ = –90 grad). The sample was embedded in a photoacoustic chamber and the signal was detected with a very sensitive microphone. The black body was used to correct the photoacoustic spectra (PAS) for device response. The thermal deactivation (TD) parameters was estimated as a ratio of photoacoustic signal (PAS) to absorbance (A), i.e. TD = PAS/A [15].
For the photovoltaic and photocurrent measurements the dyes in PVA/DMSO were immersed in a sandwich-like PEC constructed of semiconducting (In2O3 or SnO2) and gold (Au) electrodes, distanced with a 60-μm Teflon spacer (Fig. 2). The PEC was illuminated with the white light on the semiconducting electrode side and the light intensity on the sample surface was 140 mW cm–2. The arrangement details for photovoltaic/photocurrent examination are described in [16, 17]. The following measurements were done with the automatic potentiostat–galvanostat (Compex, Poland) device: photovoltaic spectra and kinetics of photocurrent in short circuit. The photovoltaic spectra were corrected for a number of incident photons.
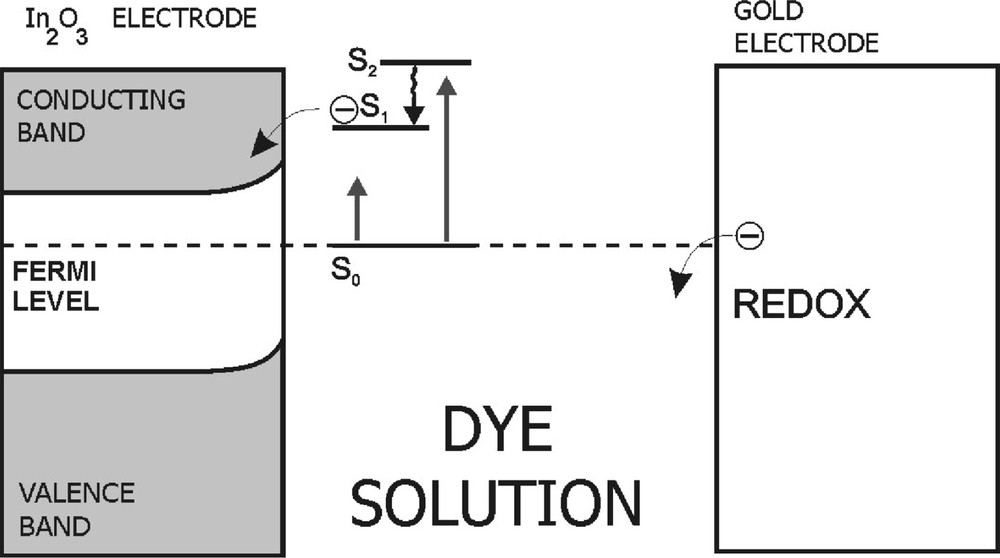
The scheme of a photoelectrochemical cell based on dye dissolved in organic solvent. S0 and S1, S2 are the ground state and excited states of the dye molecule, respectively.
The main goal of this paper is to present the current knowledge on the correlation between the molecular structure of organic dyes that are involved in the solar-energy-to-electric-energy conversion and their abilities for photocurrent generation when embedded in the PEC.
3 Correlation of dye molecular structure and dye photoactivity in the PEC
3.1 Selection of dyes
In this study, the following Ps and Pcs were investigated:
- • metal-free dyes without any substituents [7, 8];
- • non-substituted tetraphenylporphyrin (TPP), tetranaphtylporphyrin (TNP), Pc dyes complexed with metal ion (Zn, Mg, Mn, Co, Cu, Pt, Pd, Pb) (Fig. 1A–F);
- • metal-complexed dyes substituted with the aromatic rings (Fig. 1D);
- • metal-complexed dyes substituted with the long organic chains (alkyl or alkyloxy) (Fig. 1E);
- • metal-complexed fluorine phthalocyanine (Fig. 1F).
The choice of such groups of dyes was postulated for photophysical studies because differentiation in the molecular structure of dyes is expected to lead to variations in their spectroscopic and photoelectric behaviours.
3.2 Spectroscopy of dyes
3.2.1 Absorption studies
In the first stage of the spectroscopic study, the absorption spectra of dyes are always monitored and they provide information on the probability of the absorption transition between the dye ground and excited states and the energetic range of solar energy absorbed by the dye species. Fig. 3A presents the example of the absorption spectrum for MgPc in PVA/DMSO. All spectral parameters of the investigated dyes are gathered in Table 1. The intensive absorption band in the ‘blue’ part of the visible spectrum (Soret band) and the much less pronounced Q bands (‘red’ region) are characteristic for Ps. Pcs absorb very strongly in the ‘red’ region of irradiation. The appearance of the absorption bands in the Soret region is assigned to the S0→S2 transition, and the S0→S1 transition is visualized by the bands that arrive into the ‘red’ part of the spectra [18]. In general, the differences in the spectrum shapes and in the band positions on the energetic scale are due to the kind of metal ions, to the number of π electrons in the molecular systems (14 and 18 π electrons in P and in Pc, respectively), and to the existence of the anchored peripheral groups [19, 20].
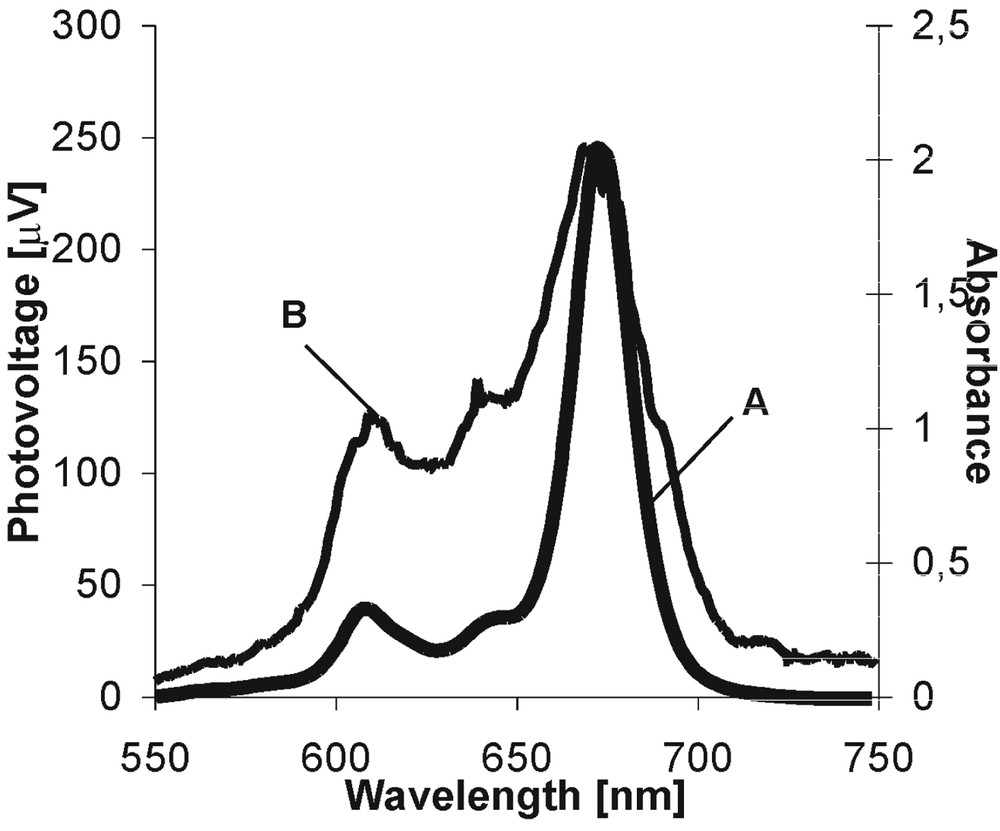
Absorption (A) and photovoltaic (B) spectra of MgPc in PVA/DMSO.
Spectral parameters of TPP and Pc dyes [7–9].
| Dye | λmax (nm) | ϵ (104 M–1 cm–1) | λmax (nm) | Φ | τN (ns) | TD |
| absorption | extinction | fluorescence | fluorescence | fluorescence | thermal | |
| wavelength | coefficient | wavelength | quantum yield | natural | deactivation | |
| lifetime | ||||||
| TPP | 419 | 63.0 | 648 | 0.02 | 16,3 | 1.10 |
| MgTPP | 425 | 59.0 | 620 | 0.08 | 31.8 | 1.00 |
| ZnTNP | 427 | 74.0 | 603 | 0.07 | 25.1 | 1.20 |
| ZnPc | 680 | 13.11 | 694 | 0.14 | 14.02 | 3.51 |
| aromatic | ||||||
| ZnPc | 673 | 6.81 | 678 | 0.11 | 7.67 | 3.18 |
| FZnPc | 638 | 6.05 | 688 | 0.21 | 16.47 | 3.52 |
| ZnPc alkil | 748 | 5.51 | — | — | — | 7.75 |
The shape of the dye absorption spectra and energetic position of the bands were shown to be dependent on a kind of central ion in the porphyrin/porphyrazine rings and on a kind of peripheral group attached the molecular skeleton [9]. The HOMO–LUMO transitions are influenced by the central metal: the more reactive of metal is, the larger the bathochromic shift usually observed in the absorption spectrum is [21]. The shift of the absorption bands can usually be due to the delocalization of π electrons in the conjugated molecular system and/or to aggregation of dyes. Moreover, the elongated chains (alkyl/alkyloxy) [9, 22] and substitutes like the benzene or sulfobenzene rings [9] can cause a substantial increase in the molar absorption coefficient of the Q absorption band. For such reasons, metallic and substituted P and Pc dyes could be promising photoconverters, since they are required to absorb light energy suitable for the energetic gap of the semiconducting electrode and since they absorb intensively in the visible light region.
3.2.2 Fluorescence properties
The Ps and Pc dyes show intensive fluorescence (at 660–710 nm, depending on the dye) [1, 2, 3, 9, 11]. The maxima of substituted Ps and Pcs are shifted towards the long-wavelength region with respect to the non-substituted dyes. The attachment of the peripheral groups to the main molecular skeleton leads to energetic lowering of the singlet level of the dye molecule. On the basis of the absorption and fluorescence data, the natural lifetimes were evaluated (eq. (2)) [13] and fluorescence quantum yields (eq. (1)) [12] (gathered in Table 1) were estimated. The Ps and Pcs lifetimes are of the order of nanoseconds. It means that the electron transfer should be available for about 10–9 s before the excited molecule decays spontaneously back to its ground state, provided that the singlet state is involved in this process. Among the investigated dyes, fluorine ZnPc shows unique properties: the Stokes shift between its absorption Q band and the fluorescence maximum is the largest among the investigated dyes and is characterized by the long lifetime and the highest fluorescence quantum yield. These features indicate that excitation energy transfer (ET) between dye pairs could be neglected and show also the large participation of other (than fluorescence) deactivation processes of the excited state of the molecule.
3.2.3 Photothermal properties
To date little is known about the photothermal behaviour of P and Pc dyes as the potential agents in photonics. Therefore it is needed to study PAS to get information about how much energy absorbed by a dye molecule is changed into heat as a result of the non-radiative processes [15]. The TD parameters (Table 1) indicate that all dyes participate in the thermal relaxation, but with different effectiveness. Among the investigated dyes the long-chained Pcs are the most effective in this process. Unsubstituted MgTNP, ZnPc and fluorine ZnPc (FZnPc) show rather poor thermal deactivation. These results evidently show the correlation between the dye molecular structure and their participation in the photothermal processes. The domination of the alkyl- and alkyloxy substituted dyes in photothermal conversion is due to the presence of mobile long chains that contribute very effectively to the loss of energy.
4 Photoelectric studies
4.1 Mechanism of photosignal generation
In the light of the experiments done in our and other laboratories, the mechanism responsible for the photovoltage signal generation is the electron injection from the excited dye molecules to the semiconducting electrode in the PEC (Fig. 2) [7, 23, 24]. After light absorption by dye molecule, charge separation can occur, followed by the electron transfer process. In this process, the electronically excited dye molecule acts as a primary electron donor and the semiconducting electrode is an electron acceptor. The gold electrode plays the role of a secondary electron donor, and provides an electron in order to make the dye molecule return to its ground state. In view of the close contact of the thin layer of semiconducting electrode material and of the adsorbed dye molecules, the electron transfer from a dye molecule in its excited state to the semiconductor electrode is responsible for the photovoltaic effect. The efficiency of photogeneration was estimated by using the procedure proposed by Garcia et al. [24]. The efficiency of a photoelectrochemical cell based on an organic dye was found to be slightly altered with a type of solvent and markedly with a kind of dye. In our experiments it reaches the values of about 0.01 and 0.02 for PEC with porphyrins and phthalocyanines, respectively.
4.2 Photovoltaic spectra
Fig. 3B shows the example of a photovoltaic spectrum (the dependence of the photovoltaic signal intensity as a function of excitation wavelength) for MgPc in PVA/DMSO in the PEC. The coincidence of the absorption and photovoltaic spectra evidently indicates that the dye molecules are involved into the initiation of photosignal and that they are responsible for the observed effects [7–10]. In all our experiments, fluorine ZnPc shows the highest photovoltaic signal. For the remaining dyes, the generated photovoltage is much lower. The lowest signal was observed for the long-chained dyes, although their absorbance is quite intense. It indicates that these dyes are much less effective than other dye species in light-to-electric-energy conversion.
4.3 Photocurrent studies
4.3.1 Metal influence
The kinetics of photocurrent rise and declining for some dyes are shown in Fig. 4; (intensity of photocurrent was estimated per cm2). In our investigations, we followed the photocurrent in the PEC based on Ps and Pcs complexed with the following metal ions: Zn, Mg, Pt, Pb, Cd, Mn, Pd, and others. Fig. 4A presents the example of photocurrent kinetics (in the second time scale) in the PEC filled with metal-free TPP and its metallic analogue. The influence of the metal ion incorporated in the molecular dye core on photocurrent generation is evident. The similar results were obtained for Pcs (Fig. 4B). It was shown that the intensity of the photocurrent strongly depends on a kind of metal ion complexed with dye. In all our investigations, Mg and Zn dyes give the highest photoresponses [7–10]. Mg and Zn are chemically very active, whereas the remaining metals show rather low reactivity. Our ESR examination [25] showed that a π electron in the conjugated system rather than in the metal is involved in the charge separation process and thus the former contributes to the photoelectroactivity of the dye. Thus we can claim that the metal ion is able to change the distribution of the π electron cloud and can affect the intensity of the observed photocurrent.
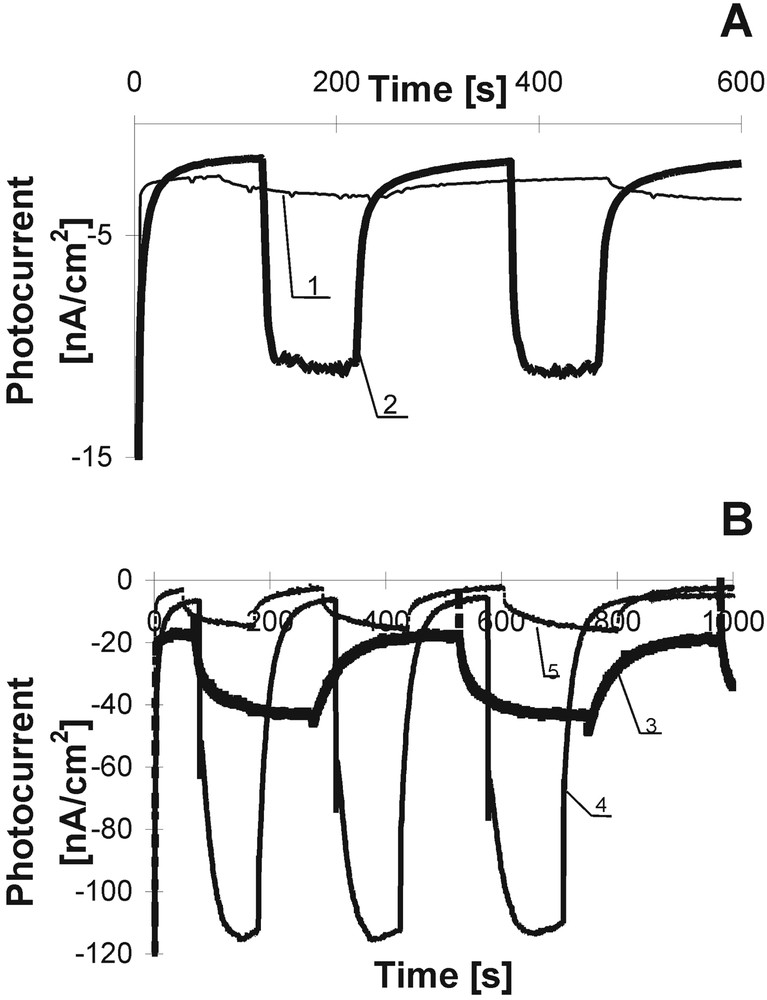
Photocurrent kinetics of porphyrins (A) and phthalocyanines (B) in the PEC: TPP – 1, Cd TPP – 2, ZnPc –3, fluorine ZnPc – 4, alkyl ZnPc – 5.
4.3.2 Aromatic ring substituted dyes
A metal-free TNP that is not complexed with metal gives a photoresponse [8]. Moreover, in this family of dyes, the highest current was observed for ZnTNP [8] and for ZnPc substituted with benzene groups (Fig. 1D) [9]. The obtained results evidently show that the peripheral aromatic groups can also influence the effectiveness of the photoresponse generation. The substitution of the P and Pc dyes leads to the delocalization of π electrons in the P rings due to the various structures and symmetry of the dye molecules [26]. Such a delocalization can weaken the electron bonding with the maternal molecules, followed by the enhancement of the dye electronegativity. Thus, in the light of above results, we have every reason to believe that both a higher number of π electrons and their delocalization lead to the improvement of the photocurrent generation.
4.3.3 Long-chained Pcs
The ZnPc dyes substituted with the alkyl or alkyloxy chains exhibit very low photocurrent intensity [9]. This result can be explained in the light of our photoacoustic examinations. As said above in the alkyl/alkyloxy ZnPcs, most of the absorbed energy is lost in the non-radiative deactivation pathway. Thus, the long-chained substituted dyes contribute rather hardly to photocurrent/photovoltage because of their mobile long chains; they loose energy predominantly by thermal relaxation rather than by charge separation followed by electron transfer [9].
4.3.4 Fluorine ZnPc
The most interesting results were obtained for FZnPc. The only difference between ZnPc and its fluorine analogue is the existence of four fluorine atoms linked to each isoindole unit [1, 3]. FZnPc photocurrent intensity is several times higher than that for ZnPc [9]. As showed above (chapter 3.2), FZnPc shows the highest fluorescence quantum yield. Its Stokes shift is large (Table 1); thus the reabsorption and secondary fluorescence processes can be neglected. The large value of its lifetime indicates the high input of other deactivation processes leading the molecule to its ground state. TD of this dye is low (Table 1). The fluorine atom is the most electronegative element and it can lead to the unique spectroscopic and photoelectric properties of FZnPc. The individual fluorine atom has very strong electron-acceptor character because of its high electronegativity. However, when it is linked to the conjugated carbon system, this property is changed because of the resonance coupling between the fluorine electron clouds and the carbon bounds. In consequence, it leads to the FZnPc electron-donating character and to the enhancement of the photocurrent in the PEC based on this dye.
5 Dye mixtures in the PEC
5.1 Interaction between dyes
Ps and Pcs absorb very significantly, but in different spectral regions, and their absorption covers only part of solar spectrum [1–3, 7–9]. Therefore, absorption of a mixture composed of various dyes instead of one dye could cover wider solar spectrum and thus could lead to the improvement of the photovoltaic effects in the PEC. Consequently, enhancement of the effectiveness of solar-energy-to-electric-energy conversion can be achieved. In this part of our investigation, we show the results for the mixtures of three different dyes: MgTNP, MgPc and merocyanine (Me); the spectroscopic studies accompanied with photoelectric (and electric) properties of the dye mixtures were also investigated [27].
The absorption spectra of these individual dyes (Fig. 5A) show that absorbance of these dyes covers almost the spectral distribution of the visible light. Fig. 5B, which presents the PAS for these dyes evidently indicates the contribution of every dye in the thermal relaxation with domination of the Me dye in this process. Three mixtures of these species were investigated: MgPc–Me, MgTNP–Me, and MgPc–MgTNP. In the absorption spectra of the mixed dyes the contribution of every dye in absorption is observed, but the mixture absorption spectra are not an ideal superposition of those for the individual dyes, most probably owing to the creation of some aggregated forms of the dyes [27]. The changes in the shapes and in the band positions of the absorption, of fluorescence [27] and in the PAS (Fig. 5B, D, F, H) obtained for the dye mixtures when compared with the spectra of the individual dyes indicate the interaction between them. The interaction between dyes can lead to at least two processes: an aggregation of dyes and energy transfer (ET) between them. Thus, on the basis of the spectroscopic examinations, one can expect the influence of the dye mixtures on photoconversion. The analysis of the absorption and fluorescence spectra of the investigated mixtures leads to the conclusions of the possible ET. In the pairs of MgTNP–Me and MgPc–Me the Me dye serves as an energy donor; MgTNP and MgPc are energy acceptors. MgPc is also an energy acceptor in the MgPc–MgTNP pair. The Förster radium R0 was obtained according to the Förster theory [28]. We applied the same procedure as in ref. [29] for chlorophyll in the same solvent. For the dye mixtures the R0 values are as follows: 9.2, 4.4 and 7.1 nm for MgTNP–Me, MgPc–Me and MgPc–MgTNP, respectively. Such R0 values are typical for the dye pairs for which ET can be described by the resonance Förster mechanism [28] and are in good agreement with those found previously in organic solvent for other P-like molecules [29, 30]. In the light of our results, we can conclude that the most effective intermolecular ET occurs between Me and MgTNP. The MgPc–Me mixture is much less effective in ET. The comparison of the absorption spectra and PAS (Table 1 and Fig. 5B, respectively) evidently shows that thermal relaxation in the Me dye is most effective among others investigated dyes. These results let us expect the weak contribution of Me in photovoltage generation in the PEC. This supposition was confirmed by the low Me photocurrent intensity (see section 5.2). The effective ET process between Me and MgTNP is support by PAS examination (Fig. 5B, D, F and H). For the MgTNP–Me mixture, very weak TD (Fig. 5D) is obtained in the range of Me absorption, although the individual Me dye shows effective TD. This observation indicates that energy absorbed by Me is very efficiently transferred to MgTNP. Otherwise, for the MgPc–Me composition, the contribution of Me in thermal relaxation is high (Fig. 5F), because of a rather poor ET to MgPc and to another effect discussed below (charge separation). The variation in the effectiveness of the investigated dyes and of their mixtures in the thermal processes was shown to influence their photoactivities in light-energy-to-electric-energy conversion.
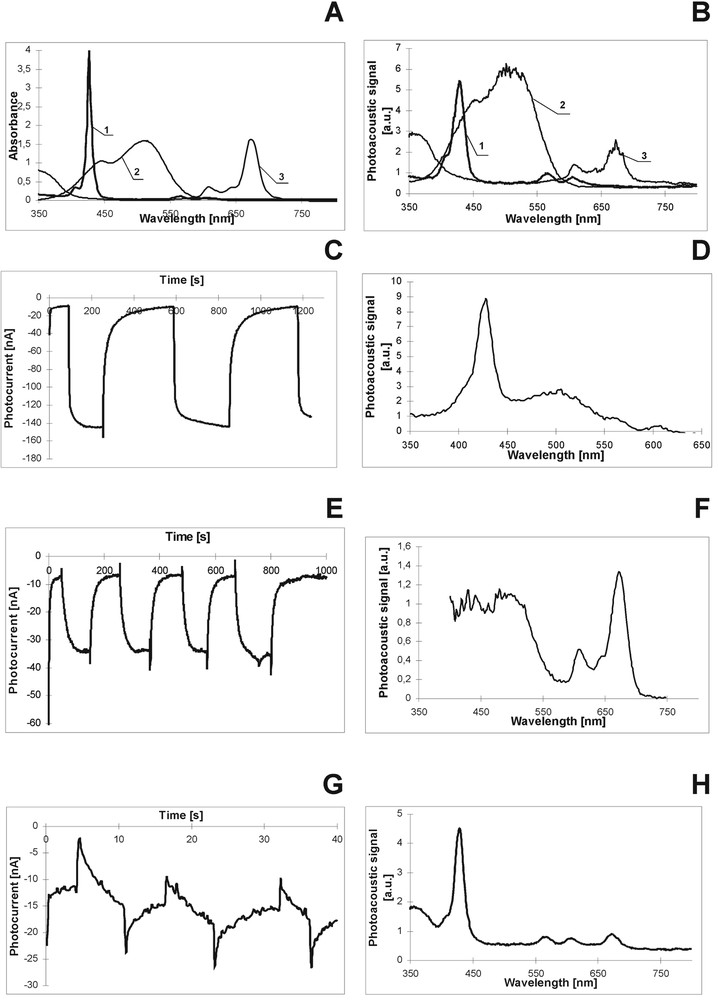
Absorption (A), PAS (B, D, F, H) and photocurrent kinetics (C, E, G) of dyes and their mixtures. A, B: MgTNP – 1, Me – 2, MgPc – 3. C, D: MgTNP–Me mixture. E, F: MgPc–Me, G, H: MgPc–MgTNP.
5.2 Photocurrent generation
The coincidence of the photovoltaic spectra (the dependence of the photovoltage signal as a function of excitation wavelength – not shown) and absorption spectra for the individual dyes confirms that MgTNP and MgPc are able for photovoltage generation [27]. On the other hand Me is a very poor photoconverter since its photosignal is hardly seen (in the accuracy of the experiment). These observations were confirmed by the photocurrent signals; they are as follows: 100, 50 and 10 nA for MgTNP, MgPc and Me, respectively. These values are consistent with the results for other Ps and Pcs monitored under the same conditions [7–10]. In the paper dealing with other type of Me this value was found to be ca. 1 nA [31].
Fig. 5C, E and G shows the kinetics of photocurrents of the dye mixtures in the PEC (intensity of photocurrent was estimated per square centimetre). As we have already seen, the largest enhancement of the photocurrent intensities is evident for the MgTNP–Me mixture. The very complexed kinetics is obtained for the MgPc–MgTNP. Interaction between dyes leads to the differences in dye photoactivities when dyes are mixed together. We discuss two dye mixtures, respectively very good and poor photoconverters (MgTNP and Me), and two good photoconverters (MgTNP and MgPc). The Me dye itself does not participate (or very weakly) in the direct charge separation process, as it was shown for the individual Me dye in the PEC. When Me is mixed with MgTNP, the intensity of photocurrent signal for Me–MgTNP increases several times with respect to the individual MgTNP (Fig. 5C). In the light of the absorbance and fluorescence properties (Me fluorescence and MgTNP absorption overlapping, see [27]) as well as of PAS results (low Me TD), we can claim that the energy transferred from Me to MgTNP is used by the later dye for intensive photocurrent generation. In other words, even if Me does not participate in direct charge separation, when it is in a company of a good excitation energy acceptor (MgTNP), energy absorbed by Me is utilized by the acceptor molecule for charge separation, owing to the effective ET process (provided that Me does not loose its exceeding energy by thermal relaxation, as shown in Fig. 5D). Thus, it can be said that a poor photoconverter (Me) can be indirectly involved in the generation of photosignal by effective ET.
The unexpected results were obtained for the mixture of two good photoconverters: MgTNP and MgPc. The value of the photocurrent generated in the PEC with these blended dyes is much lower than that for the individual dyes. Moreover, the kinetics (Fig. 5G) is very complexed and different from that for the individual dyes. Although the absorption/fluorescence overlapping and the estimated Förster radius could indicate ET between these dyes, also other intermolecular processes can occur between MgPc and Mg TNP. The decrease in the photocurrent is due to the high thermal relaxation of these dyes when they are mixed together. High thermal deactivation is expected for the aggregated dye species [32]. The analysis of the difference spectra (mixture absorption spectrum minus the sum of the individual dye spectra – not shown) shows the existence of MgTNP–MgPc complex in the dye mixture. Ps and Pcs can create stacked forms as a result of the strong interaction between their π orbitals, as found for porphyrin-like molecules in PVA/DMSO [13]. Even the creation of the aggregated species in highly concentrated sample in very polar DMSO cannot be excluded. Thus on the ground of our spectroscopic (absorption, PAS) examinations and photoelectric studies, absorbed energy is lost in thermal processes rather than used for charge separation. Moreover, in the kinetics of the MgPc–MgTNP sample, the drastic jump of photocurrent was observed under light-off and light-on conditions (Fig. 5G) because of a light shock [17, 27, 33]. The charge separation process is always accompanied by the charge recombination and the later one leads to a decreasing of the photosignal, as observed for the MgPc–MgTNP mixture. We can summarize that non-radiative channels of the dye excited states, the aggregated species formation and fast change recombination lead to a drastic decrease in the light-energy-to-electric-energy conversion. On the other hand, effective excitation ET can enhance markedly the process of solar-energy-to-electric-energy conversion.
6 LB dye layers on the solid surface
6.1 Dye interaction and orientation
In the light of the recent study it was stated that only a thin dye layer that is in the direct contact with the PEC semiconductive electrode is involved in the electron transfer process [33]. Therefore we investigated the Langmuir–Blodgett dye layers on the semiconductive (In2O3, SnO2) and conductive electrode surface (Au) to get information about the interaction between dyes and between dye and the electrode surface (mutual dye orientation, orientation of dyes with respect to the electrode) [34]. The example of the absorption spectra of the dye LB layer for two investigated dyes (MgPc, MgTNP) are shown in Fig. 6A and B. The shapes of the dye absorption spectra are significantly changed after deposition on the solid substrate in the form of a LB layer owing to the strong interaction between closely packed dyes and to the interaction between the dye molecule and the substrate. In the MgTNP sample, the long wavelength shift of the dye bands (of about 20 nm) is observed, but the character of the spectrum when compared with the spectrum of the same dye in the organic solvent is not markedly changed. It indicates the domination of the monomeric form of this dye (MgTNP). Otherwise, for MgPc the large ‘red’ shift of the red bands (from 673 nm in the organic solvent to 825 nm in LB) and band broadening can be described as due to the particularly strong interaction between the dye molecules; the π electron structure of Ps and Pcs favours the creation of dye aggregation because of the strong interaction between the closely packed dye molecules [34–39].
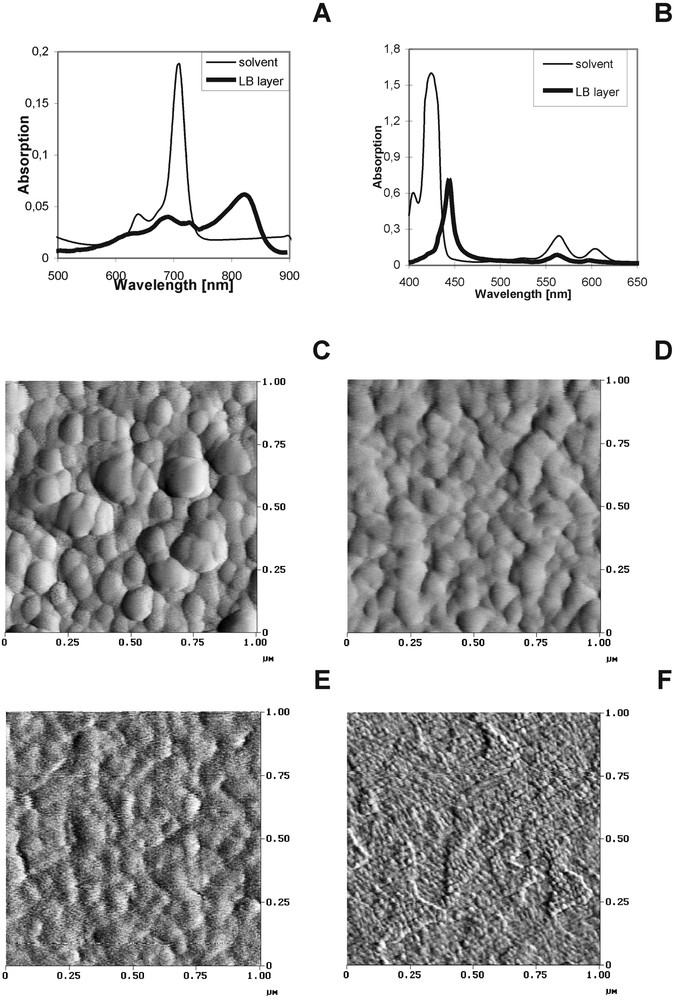
Absorption (A, B), AFM images of SnO2 (C) and In2O3 (E) and when coated with MgTNP on SnO2 (D) and MgPc on In2O3 (F).
In energy transfer and electron transfer processes, the study of both the mutual orientation between the dye molecules and the molecular arrangement with respect to the substrate surface are important. On the basis of the polarized absorption spectroscopy, the angle between the substrate surface and the dye molecular skeleton was determined. The details of the procedure are described in [34]. The angle values are found to be between 22 and 77°, depending on the dye and on the kind of substrate. The angle values indicate that the macrocyclic skeletons are in-plane (for MgTNP) or are tilted off the substrate surface (for MgPc).
The different dye orientation was also confirmed by the (π–A) isotherms. On the basis of the compressive curves, the areas (A) occupied by one molecule are as follows: 110 and 40 Å2 for MgTNP and MgPc, respectively [34]. The literature data indicate the geometrical size of the planar Ps and Pcs of about 60–120 Å2 and 120–190 Å2, respectively [1, 2, 3, 35, 40, 41]. The highest A obtained for MgTNP (110 Å2) confirms the in-plane orientation; otherwise MgPc (40 Å2) is tilted almost perpendicularly to the surface. The in-plane orientation of the dye molecular frame does not favour the creation of the stacked molecular arrangement and the dye molecule in the layer is kept in a monomeric form rather than in the aggregated one [32]. The creation of the aggregated dye forms is closely connected with the molecular dye structure [2, 3, 35–39, 42], but also with the mutual dye orientation [32].
6.2 AFM image of LB dye layer on the electrode surface
Figs. 6C and E show the examples of AFM images of the semiconductive substrates of the large grain (Fig. 6C–SnO2) and for a surface of a small granularity (Fig. 6E–In2O3) and when coated with LB dye layers of MgTNP and MgPc, respectively (Fig. 6D, F).The average roughness parameters Ra were estimated and they are as follows: 2.20 and 0.35 nm for SnO2 and In2O3, respectively [34].
After dye deposition the AFM images are more or less changed, depending on the kind of dye (monomeric or aggregated dye form, dye orientation) and the substrate surface. The change in the AFM images of the surface morphology without and with LB dye layer can be correlated with at least the relation between granularity of the substrate and geometrical size of the dye, the spectral form of the dye molecules (aggregates, monomers), the orientation of the molecular skeleton with respect to the surface.
In the case of SnO2 surface, the roughness parameters Ra is only slightly higher after MgTNP deposition (Ra = 2.24). The substrate grains are still well seen and the small change in the AFM images of semiconductor without and with MgTNP is likely due to the in-plane orientation of the monomeric dye that lies almost flatly on the substrate surface – the dye substrate surface is still smooth. The existence of MgTNP in the monomeric form and its in-plane orientation with respect to the SnO2 surface explain why MgTNP LB layer preserves morphology of the substrate of high granularity.
For In2O3 (small granularity surface), the increase of roughness parameters Ra is observed after coating with dyes when compared with the surface without dyes. The AFM image of In2O3 is markedly changed when MgPc is deposited on the surface (Ra increases from 0.35 to 0.65 nm). The change in AFM images of In2O3 when coated with MgPc could be explained at least as due to the filling of the troughs between In2O3 grains by perpendicular oriented dye. In this case, the AFM image visualizes the morphology of the deposited dye layer rather than the surface structure of the substrate.
7 Conclusions
The presented results evidently show the correlation between the dye molecular structure and dye ability for generation of photocurrent in the PEC. In the light of our experimental results, we can summarize and conclude as follows:
- • study of the dye photoelectric properties must be accompanied with the spectroscopic measurements, since radiative and non-radiative deactivations of the dye excited states compete to charge separation process, which determine the effective photoconversion of light energy to electric energy;
- • the central atom is pre-required for the effective solar-energy-to-electric-energy conversion;
- • the presence of the metal ion upon incorporation in the molecular skeleton may cause the electron redistribution; the highest photoresponses were observed for magnesium and zinc dyes;
- • aromatic groups (benzene, naphthyl) are able to improve the photocurrent generation effectiveness because of their higher number of π electrons and the enlargement of their delocalization;
- • the presence of the long organic chains anchored to the molecular skeleton limits the photoresponse owing to the high mobility of the long chains and the very intensive non-radiative deactivation of the dye excited states by thermal relaxation that competes with charge separation;
- • the unique photoelectric ability of fluorine zinc dye is due to the change of fluorine electron–acceptor properties to electron–donor properties when they are linked to the conjugated carbon system;
- • the region of dye absorption is not the only criterion for the effective solar energy conversion, even when dye absorption bands cover almost the whole solar spectrum;
- • increasing the generated photosignal in the photoelectrochemical cell can be achieved thanks to effective energy transfer between dyes; when a poor photoconverter is used in the photoelectrochemical cell, its excited energy can be transferred to the energy donor (good photoconverter) and then can be used in charge separation;
- • creation of aggregated dye species leads to a decrease in the photoconversion process, since in aggregated dyes the absorbed energy is mostly changed into heat;
- • AFM examination is needed for understanding the dye orientation with respect to, and interaction of dyes with, the electrode substrate;
- • the final morphology of the substrate after dye deposition is correlated with the magnitude of substrate grain and the molecular skeleton size – the substrates of large grains preserve their own topography after coating with the dye layer, whereas the dye layer deposition on the low granularity substrate leads to the change of the surface structure and dyes create their own topography.
The presented results are very essential in the understanding of the mechanisms of photocurrent generation in the photoelectrochemical cell and in controlling some photophysical processes in organic solar cells based on dyes.
Acknowledgements
The Polish State Committee for Scientific Research (KBN) – No. 8 T10B 003 21 – supported the paper. The author acknowledges Andrzej Boguta and Adam Bartczak for their assistance in the preparation of the manuscript.