

1 Introduction
Spectrofluorometry is one of the most sensitive techniques currently available to the analyst and is therefore of increasing general interest, as attested by several studies showing the numerous applications of this technique [1–4]. The fluorescence spectroscopy has excellent sensitivity in determining many fluorescence compounds (pharmaceutical, biomedical, etc.), especially aromatic hydrocarbons that exhibit particularly intense fluorescence.
Spectrofluorometry is based on the assumption that the fluorescence composition and intensity in a sample is quantitatively related to these of the standard. Many errors can arise from using a standard to calibrate and estimate the level of oil contamination in the environment. The errors are more serious from the quantitative point of view when a large-scale investigation is considered. In other words, it is impossible to obtain a reliable of the oil pollution situation over all the oceans when the results are obtained by applying fluorescence spectroscopy using different standards that are significantly dissimilar in their fluorescence patterns due to their various compositions. According to Hargrave and Phillips (1975) [5], fluorescence analysis detects only the aromatic compounds that comprise from 10 to 60% by weight of various oils. This proportion changes during weathering and degradation. If oil is present in environmental samples, it is usually of unknown origin and composition, and there may be significant differences between excitation/emission spectra of samples and the chosen standard.
The present work shows how the final result of oil pollution estimation in marine sediment and organism collected from the Bizerte lagoon in Tunisia during two seasons varied significantly when two different standards were used.
2 Materials and methods
2.1 Study area
The lagoon of Bizerte is the second largest lagoon in Tunisia. Its map with the sampling points is presented in Fig. 1. The surface area is 128 km2 and the depth is between 3 and 12 m. The lagoon is connected to the Mediterranean Sea and to the Lake Ichkeul by straight channels. The exchanges of water between the Mediterranean Sea and the lake determine the salinity of the lagoon of Bizerte, which varies between 32.5 and 38.5 practical salinity units (psu). The water temperature is between 10 °C during winter (wet season) and 29 °C during summer (dry season) [6,7].
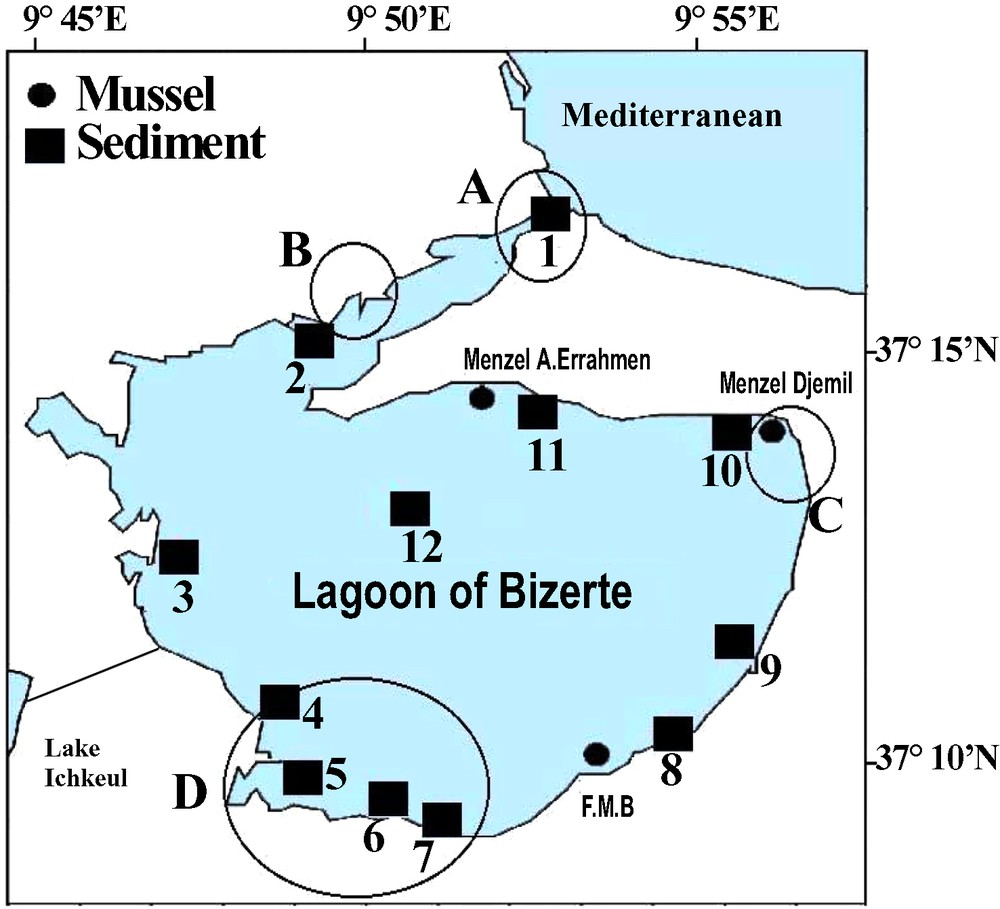
Map of the lagoon of Bizerte with location of the sampling stations. Different types of industrial zones are also indicated: A (oil refineries, food industries, ceramics), B (cements, treatment of metals and sprinkling beverages), C (ceramics and metallurgy), and D (metallurgy (Fe, Zn, Cd, Sn, Hg), naval construction, tire production).
The lagoon of Bizerte is subject to important industrial activities. There are four main zones of anthropogenic influence, also presented in Fig. 1. In zone A are situated oil refineries, food industries, ceramics, in zone B – cements, treatment of metals and sprinkling beverages, in zone C – ceramics and metallurgy, in zone D – metallurgy (Fe, Zn, Cd, Sn, Hg), naval construction, tire production [7,8].
2.2 Sampling and storage
Surface sediments and mussel samples (Mytilus galloprovincialis) were taken during two sampling campaigns (August 1999 and January 2000) on board of a research vessel. The sediments and the organic part of the mussels were frozen on board and later freeze-dried for 48 h, ground and stored in glass bottles until analysis [9].
2.3 Analytical procedures
Analysis of marine sediment and organisms were performed according to the technique proposed by UNEP/IOC/IAEA 1992 [10,11].
Extraction of the samples were realised by a Soxhlet extractor using methanol for marine organisms and an equal mixture of hexane (n-C6H14) and dichloromethane (CH2Cl2) for sediment during 8 h. Samples necessitate a step of purification to eliminate sulphur compounds from sediment using mercury and a step of saponification of lipids from marine organisms. Aromatic fraction is obtained by adsorption chromatography using silica/alumina column, aromatic hydrocarbons are eluted with a mixture of n-C6H14/CH2Cl2 (90:10) followed by 50% CH2Cl2 in hexane.
A semi-quantitative estimate of the type of aromatic hydrocarbons can be obtained by means of fluorescence spectrometry [12,13]. The fluorometer must be capable of synchronous scanning of excitation and emission wavelengths. Emission scans and synchronous excitation/emission scans are recorded and evaluated for the type of aromatic hydrocarbons in the samples. Standard response curves of fluorescence intensity versus concentration are generated for the appropriate oil standard (example: Ropme oil) and for the standard aromatic hydrocarbon, chrysene. All measurements were performed with a spectrofluorometer (Shimadzu RF-5301PC) fitted with a Xenon flash lamp, Hamamatsu monochromators, and 1-cm quartz cell. Spectral data acquisition and processing were carried out by means of the program Fluorescence Data Manager RF-5301PC serially interfaced (RFPC Software) to the Shimadzu spectrofluorometer.
Calibration curves for the two standards chrysene and Ropme oil are presented in Fig. 2.
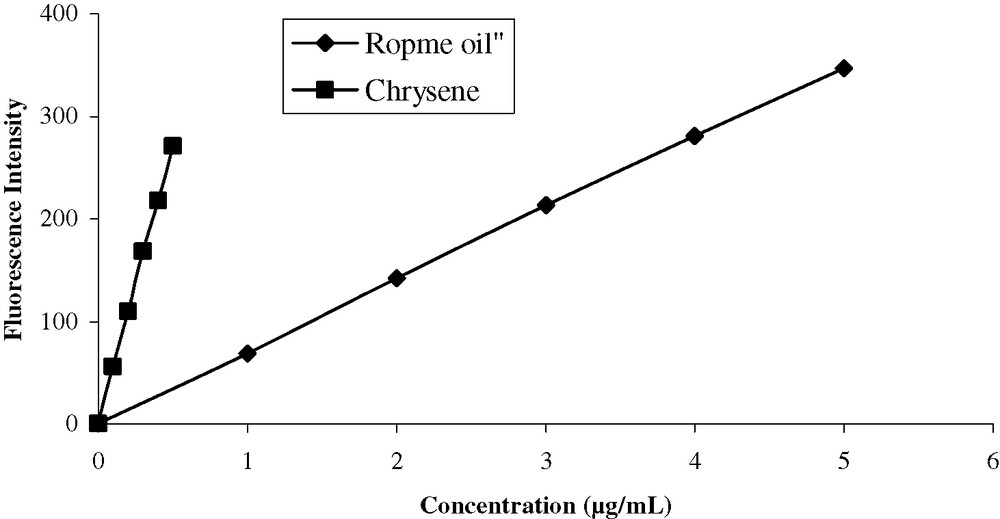
Calibration curves for the two standards (excitation at 310 nm and emission at 360 nm).
3 Results and discussions
For qualitative identification of oil type based on the fluorescence of aromatic hydrocarbon components, a synchronous excitation/emission scan provides a better resolution. It has been reported that possible interference from Rayleigh bands is almost completely eliminated by the use of the synchronous scan techniques [14]. Raman bands can be a more serious problem, as its solvent band frequencies lie in the same region as analyte fluorescence bands. Fig. 3 shows example of synchronous excitation/emission spectra generated from standard oils and extracts from sediment obtained by fluorescence spectrofluorometer with a constant wavelength difference between excitation and emission wavelengths. According to the US Coast Guard Oil Spills Laboratory and the American Society for testing Materials, mentioned in the Reference Methods for Marine Pollution Studies of the United Nations Environment Programme [10], a Δλ of 23 nm has been chosen. Thus, scanning both the excitation and emission monochromator with a constant Δλ, rather than scanning the excitation monochromator while keeping the emission constant, results in an important simplification of the fluorescence spectra. Inspection of these spectra (Fig. 3) indicates that chrysene shows maximums in shorter wavelengths. Crude oil like Ropme shows maximums in higher wavelength regions. Thus for accurate interpretation, the analyst must be familiar not only with the characteristic spectra generated by standards but also with the effects of the different parameters altering the samples fluorescence spectra (weathering processes, microbial degradation, etc.).
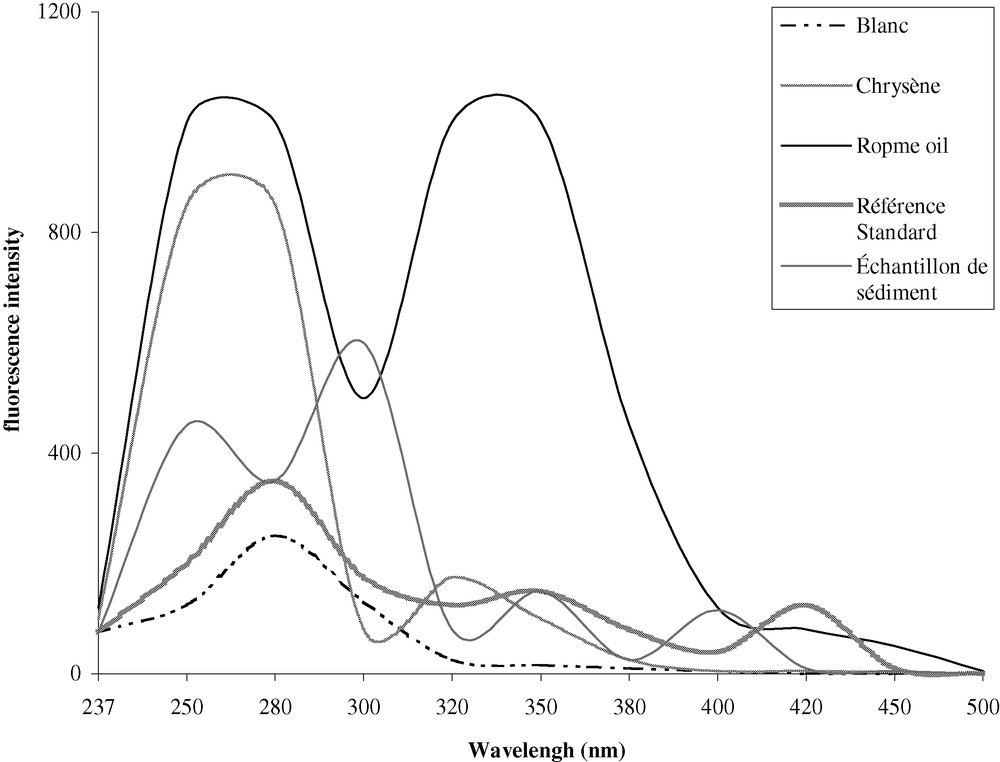
Synchronous excitation/emission fluorescence spectra of aromatic hydrocarbon fractions of hexane blank, chrysene, Ropme oil, reference standard, and sediment sample. Scan from 237-nm to 500-nm emission with excitation set Δλ = 23 nm. Band pass: 5 nm.
A certified reference standard of sediment IAEA 408 from the International Atomic Energy Agency was used for quality control procedure. The results exhibited good agreement with the certified values (Table 1).
Concentrations of total aromatic hydrocarbons in reference material IAEA 408 (n = 3)
| References | Recommended | Found |
| (μg g–1) equivalent chrysene | 6 [4,6–19] | 10.5 ± 1.2 |
| (μg g–1) equivalent Ropme oil | 49 [35–120] | 65 ± 11.4 |
As can be seen from Tables 2 and 3, which included all the results for the sediment and marine organism samples, the total aromatic hydrocarbon contents measured vary significantly depending upon the standard used.
Total aromatic hydrocarbons [TH] contents (μg g–1 of dry mass) measured relative to each one of the two standards (mean values ± standard deviation) in marine sediments collected from different stations in Bizerte lagoon during summer (S) and winter (W)
| Stations | [TH] μg g–1 eq chrysene (S) | [TH] μg g–1 eq. Ropme oil (S) | [TH] μg g–1 eq. chrysene (W) | [TH] μg g–1 eq. Ropme oil (W) |
| 1 | 6.5 ± 0.5 | 49.6 ± 3.5 | 34.9 ±1.4 | 269.4 ± 8.6 |
| 2 | 11.4 ± 0.9 | 87.8 ± 6.7 | 17.8 ± 2.6 | 139.4 ± 16.3 |
| 3 | 7.4 ± 0.5 | 58 ± 4 | 7.7 ± 0.7 | 59.3 ± 3.6 |
| 4 | 4.5 ± 0.7 | 34.9 ±1.2 | 68.3 ± 3.5 | 535.6 ± 10.3 |
| 5 | 19.5 ± 1.2 | 148.2 ±10.3 | 7.8 ± 0.4 | 59.7 ± 2.9 |
| 6 | 5.2 ± 0.3 | 18.6 ± 1.2 | 16.8 ± 1.7 | 12.5 ± 1.2 |
| 7 | 0.50 ± 0.08 | 0.62 ± 0.02 | 0.97 ± 0.08 | 27.4 ± 2.1 |
| 8 | 6.3 ± 0.3 | 48.6 ± 3.2 | 6.8 ± 0.7 | 52.5 ± 1.9 |
| 9 | 9.3 ± 0.5 | 24.5 ± 1.2 | 16.5 ± 1.2 | 65.3 ± 2.4 |
| 10 | 0.050 ± 0.008 | 0.38 ± 0.02 | 0.97 ± 0.08 | 7.4 ± 0.9 |
| 11 | 10.1 ± 1.1 | 78.5 ± 5.8 | 0.25 ± 0.07 | 1.9 ± 0.3 |
| 12 | 8.3 ± 0.5 | 18.6 ± 1.2 | 12.5± 0.5 | 42.5 ± 1.5 |
Total aromatic hydrocarbons contents (μg g–1 of dry weight) measured relative to each of the two standards (mean values ± standard deviation) in mussels collected from different stations (Menzel Abderrahmen, Menzel Bourguiba (FMB) and Menzel Jemil) during Summer (S) and Winter (W)
| Stations | μg g–1 eq. chrysene | μg g–1 eq. Ropme oil |
| MA (S) | 6.3 ± 0.9 | 48.7 ± 1.7 |
| MA (W) | 8.4 ± 1.2 | 66.1 ± 1.8 |
| FMB (S) | 2.7 ± 0.5 | 21.3 ± 1.7 |
| FMB (W) | 7.5 ± 0.9 | 58.5 ± 1.9 |
| MJ (S) | 2.5 ± 0.5 | 19.5 ± 1.1 |
| MJ (W) | 12.1 ± 0.6 | 93.4 ± 1.2 |
In the case of the twelve sediment samples (Table 2), the aromatic contents during summer are scattered in the range (0.05–19.5), (0.38–148.2) μg g–1 (dry wt.) and during winter in the range (0.25–68.3), (1.9–535.6) μg g–1 (dry wt.) when chrysene and Ropme oil respectively were used as standards.
Concentrations in marine organism samples (Table 3) ranged between (2.5–6.3), (19.5–48.7) μg g–1 (dry wt.) during summer and between (7.5–12.1), (58.5–93.4) during winter when chrysene and Ropme oil, respectively, were used as standards.
From the same tables, it can be noted that the variations in the results in either sediments or marine organism samples are usually in an average ratio of 1:7.6 ± 0.2 when chrysene and Ropme oil, respectively, were used. This ratio is found to be very similar to that between the inverse values of the slopes (concentrations) of the two calibration curves for both standards, as shown in Fig. 2. The later ratio is 1:7.8, in the same order as above. Picer and Hocenski [13] studied the improvement in the estimation of petroleum hydrocarbons in marine sediments and organisms by spectrofluorometry using the standard additions methods and have found that after addition of crude oil solutions to sample extracts, there was a significant decrease in the corresponding oil standard solution and a difference between their slopes. There are two possible explanations for the difference observed in the fluorescence intensity: first the loss of the fluorescent material in the oil added during cleaning and evaporation step and second the presence of some quenching materials in sample extracts, even after the cleaning procedure. For these reasons, it is impossible to estimate the concentration of crude oil and its derivatives in sediments and various biota samples with high concentration ranges using the standard addition method. The problem of crude oil recovery during the analytical procedure is solved by using linear calibration curves. Another reason that limits the use of the standard addition method is the expensive cost of standards mainly for routine analysis.
By the data obtained in the present work, we try to show the limitations of the use of fluorescence analysis for quantifying the presence of oil in the marine environment. It is difficult to consider crude oil as the reference standard to estimate the level of oil pollution in the samples. In fact, every crude oil has its own composition and hence its characteristic fluorescence pattern and intensity. The fluorescence characteristics depend upon the composition of aromatic compounds. Moreover, many changes happen to the fluorescent components of a crude oil when released into the marine environment: loss of volatile aromatics through evaporation, photo-oxidation, and biodegradation.
The direct results of these limitations in the application of fluorescence analysis for quantifying petroleum in the marine samples is that the measured aromatic content in the sample of either sediment or marine organism varies significantly according to the standard oil used.
4 Conclusion
We can conclude from the present work that the application of spectrofluorometric analysis to measure the aromatic hydrocarbons in marine samples leads to unreliable and incomparable results because of the arbitrary choice of the standard in this technique.
The spectrofluorometric measurement can be successfully applied in an area suffering from the contamination by one or number of known petroleum oils or standards, which could be taken as standards, while in an area where the sources and types of petroleum are unknown, the usage of this technique leads usually to unreliable results.
The choice of oils used for calibration and the wavelengths for the quantitative measurement will depend on the types of oil seen in samples from individual monitoring programmes. The analyst should compile a ‘library’ of spectra and response curves generated from the particular instrument used.
From our point of view, the comparability of levels of oil contamination in different regions requires, either using the same standard in all similar studies, or establishing fluorescence calibration curves for all of the known crude oils. Indeed, the levels of petroleum pollution in the marine environment could also be estimated relative to one or a group of aromatic hydrocarbons known by their high toxic effects in the ecosystem.