

1 Introduction
Zeolite microporous materials are involved in a large domain of chemical science and technology including catalytic and separation processes [1], gas storage and ion exchange [2,3]. Much research efforts performed both experimentally and theoretically have been thus focused on this class of materials. This is not only because of their technological importance but also because they represent model systems. Indeed, zeolites which are well-ordered nanoporous materials, offer great possibilities for investigating their adsorption properties as a function of many parameters such as size and shape of the pores, chemical composition of the framework (Si/Al ratio, metal substituted aluminophosphate) and nature of the extra-framework cations.
Calorimetric methods can be used for the characterisation of such adsorbent surfaces as well as of adsorption phenomena. Probing the chemical nature of the surface can be directly obtained via such measurements. Microcalorimetry also allows various adsorption phenomena such as phase transitions and successive pore filling to be highlighted. For a deeper understanding of adsorption phenomena, the introduction of computer modelling and simulation is of great interest. This is the case where general trends can be found between experiment and simulation. Furthermore, the prediction of adsorption behaviour can be used in applications.
Zeolites and related materials (aluminophosphates, gallophosphates…) are interesting in that their synthesis conditions can be adjusted to give a wide range of crystal structures and an almost infinite variety of chemical compositions. From a fundamental point of view, the regular pore systems can be indexed by X-ray diffraction and the structure can be elucidated using Rietveld refinement-type methods for example. Such materials are thus excellent candidates to understand adsorption phenomena as well as having a number of industrial applications in ion exchange, gas storage and separation.
The following paragraphs will briefly describe basic experimental methods used in our laboratory for gas adsorption. In the later sections, examples will be given of results obtained at low temperature as well as at ambient temperatures.
2 Experimental methods
Different calorimetric methods are available for the study of gas adsorption. Whilst adiabatic calorimetry is more suitable for the determination of heat capacity, both isoperibol and diathermal calorimetry have been used to follow adsorption phenomena. Isoperibol calorimetry, where no special connection is made between the sample temperature and that of the surrounding environment, was the first to be applied to adsorption [4]. The experimental set-ups and the experiments themselves are complex and comparison of results obtained using this methodology with those obtained by isothermal measurements is difficult. Diathermal calorimeters, where the sample temperature follows that of the surroundings, are more suited to follow gas/solid interactions. The quasi-isothermal conditions of adsorption manometry can be reproduced so that the thermal events that occur during adsorption can be measured. The examples given below were obtained under these diathermal or quasi-isothermal conditions.
For the characterisation of adsorbents, low temperature measurements, in the range of 77 K are generally used. However, data obtained in the temperature region from 298 to 373 K are very much of interest, for example in studies related to gas storage and gas separation. Specific instruments are required for each of these temperature domains.
2.1 Microcalorimetry at 77 K
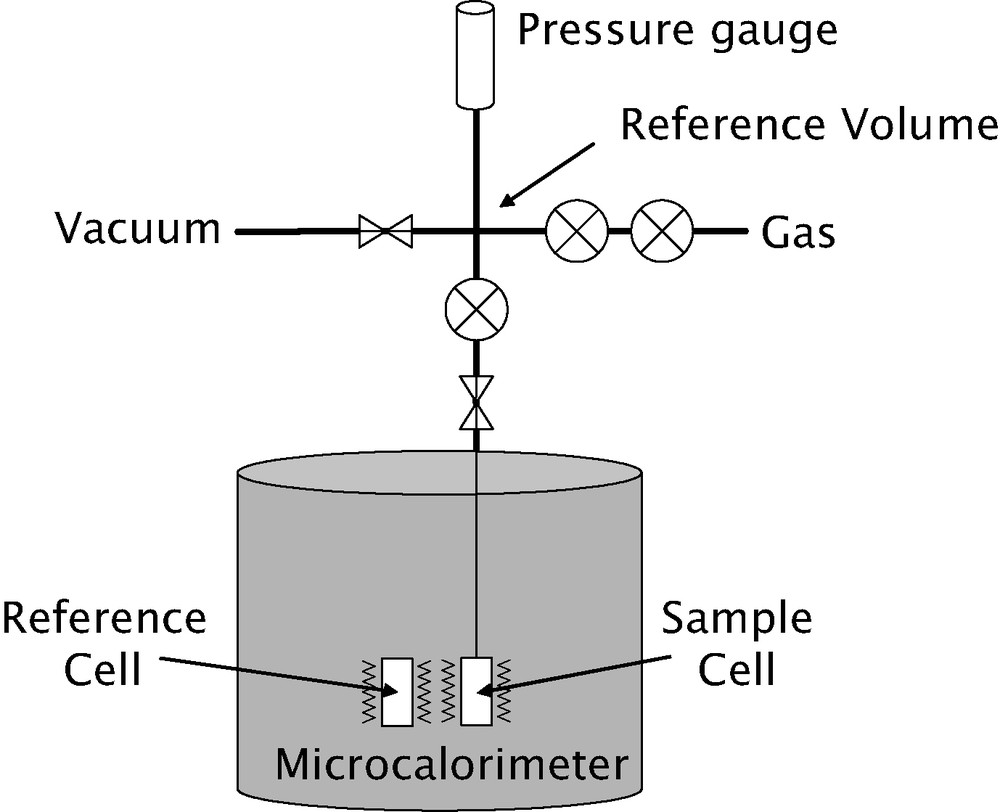
An example of a diathermal calorimeter [5] used for low temperature adsorption studies is given in Fig. 1. This apparatus is formed of three main parts: the dosing apparatus, the sample cell and the calorimeter. The calorimeter is a Tian-Calvet apparatus where two thermopiles are mounted in electrical opposition. The calorimeter is placed upside down, like a diving bell in the cryogenic fluid. Each thermopile is comprised of around 1000 thermocouples that provide an overall sensitivity of around 5 mJ. The electrical resistance is housed in the reference thermopile, allowing calibration via the Joule effect. The calorimeter is maintained in a liquid nitrogen (or argon) cryostat containing around 1000 l of cryogenic fluid. A small flow of helium is maintained through the thermopiles. This helium flow maintains the calorimeter under isothermal conditions, as well as allowing a good thermal contact between the sample and the thermopile.
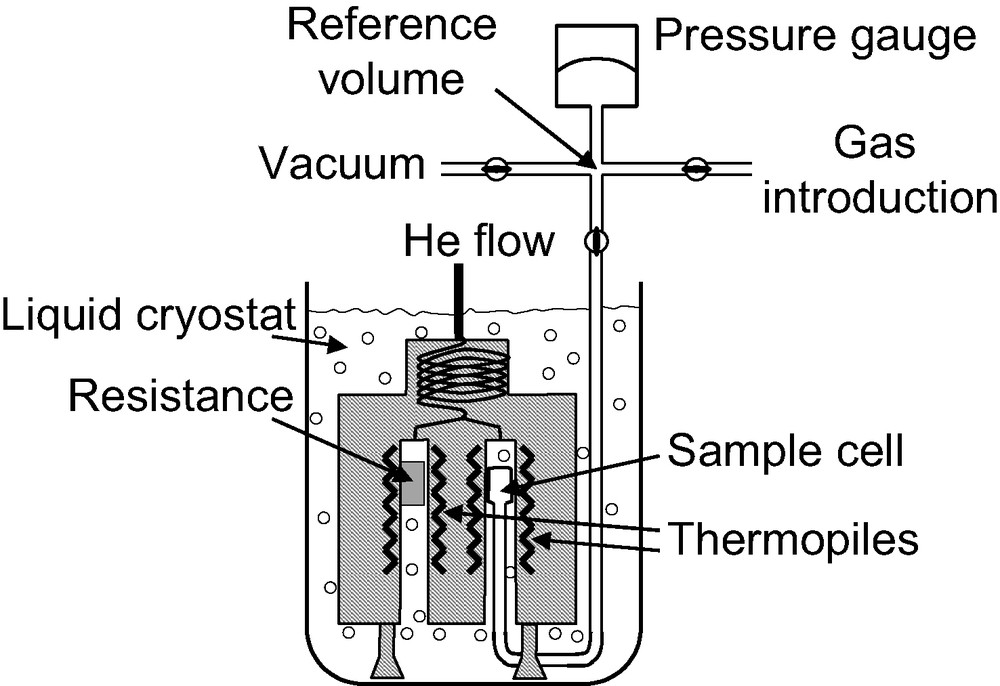
Schematic representation of a calorimeter used for adsorption experiments at 77 K.
There are, however, two different methods of adsorbate introduction. The first, and most common, is to inject discrete quantities of gas to the adsorbent. This method is well adapted for microcalorimetry experiments carried out at room temperatures and will be described in § 2.2 below. For low temperature microcalorimetry, it can be more interesting to employ a method of gas introduction leading to an increased resolution in results.
For the observation of subtle adsorption phenomena such as adsorbate phase changes, an increased resolution in both the isotherm and differential enthalpy curves is required. It would be possible to introduce very small doses of gas to increase the number of data points collected. This is both time consuming and may lead to the summation of a number of errors. However, a continuous introduction of gas leads to an infinite resolution in both curves [5].
Fig. 2 highlights how this resolution can be interesting. The peak A, in the full line would be indicative of an adsorbate phase change which would go unnoticed using the discontinuous procedure of gas introduction. In what has been termed the ‘continuous flow’ procedure, the adsorbate is introduced to the system at a defined rate, slow enough that the adsorbate–adsorbent system can be considered to be essentially at equilibrium at all times [6,7]. To check this equilibrium, it is possible to stop the adsorbate flow and ensure that the heat signal disappears (Fig. 3).
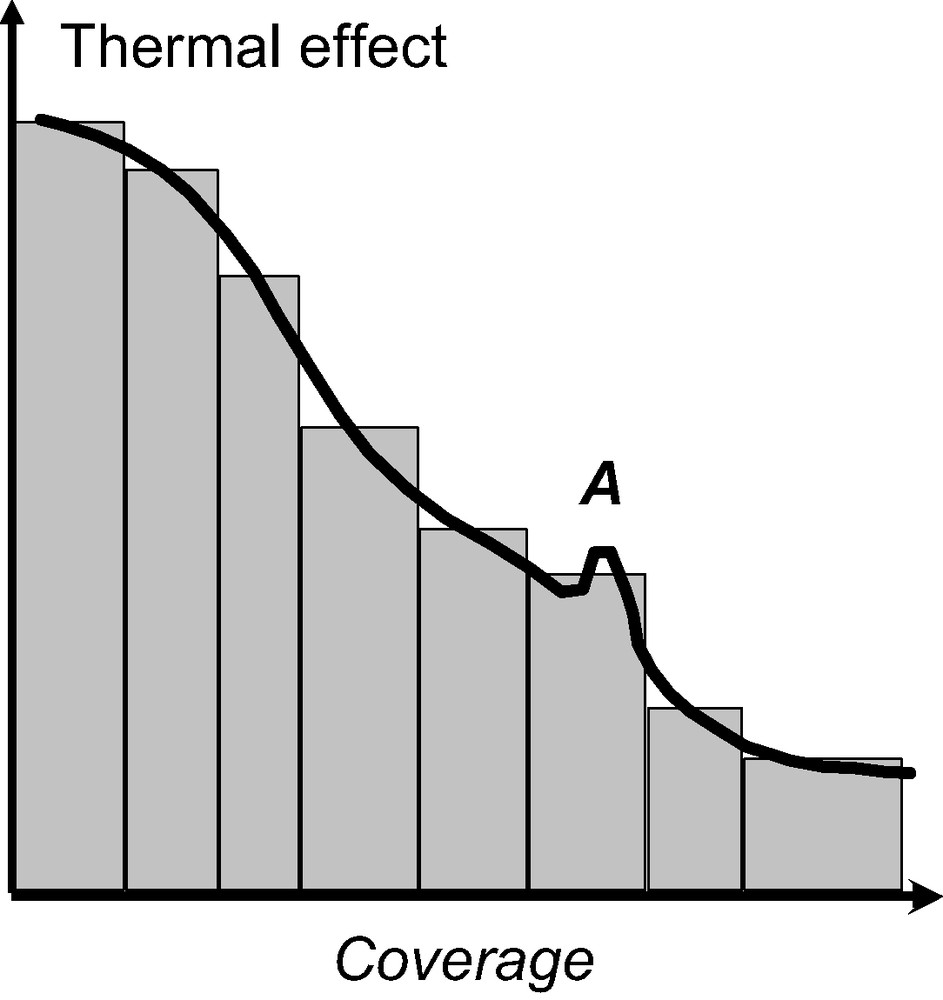
Comparison of the results obtained using either the discontinuous (bars) or continuous (full line) procedure of gas introduction. The peak, A, corresponds to an adsorbate phase change which is overlooked when using the discontinuous procedure of gas introduction.
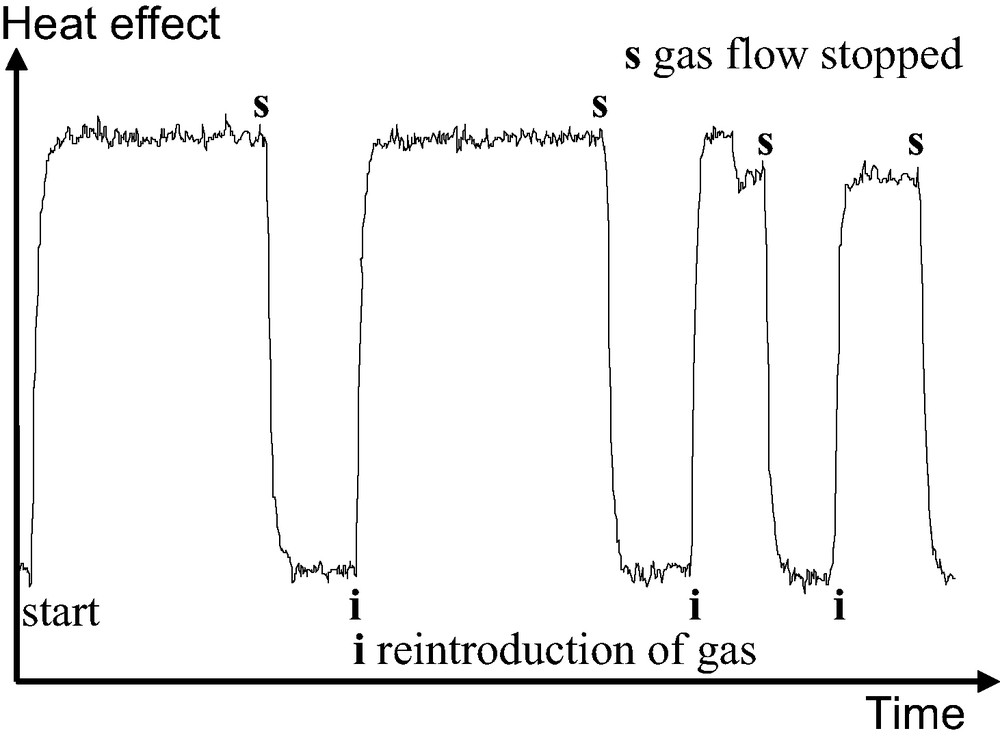
Adsorption of krypton on silicalite-1. The flow of gas to the sample is stopped periodically to verify the adsorbate-adsorbent equilibrium. Note that the return of the signal to the baseline occurs at the response time of the calorimeter indicating gas–solid equilibrium.
In this ‘quasi-equilibrium’ state, the quantity of adsorbate admitted to the system Δn can be replaced in adsorption calculations by the rate of gas flow dn/dt. The calorimeter under these conditions measures a heat flow, φ.
The use of a sonic nozzle allows the gas flow to the sample, f = dn/dt to be maintained constant [5]. A rate of adsorption, fa, can therefore be calculated using the following expression:
| (1) |
Here, Vd and Vc are the volumes of the dosing system and that are accessible to the calorimeter at temperatures Td and Tc. The corresponding heat flow, φ, can be given by:
| (2) |
Combining the last two expressions leads to:
| (3) |
| (4) |
Blank experiments can lead to an estimation of Vc (dp/dt). This term is large during horizontal parts of the isotherm. The error in the estimation of the differential enthalpy thus becomes important. However, in these regions of multilayer adsorption, an estimation of the enthalpy is less interesting and can be readily obtained using the isosteric method.
In the vertical parts of the isotherm, for example during micropore filling or capillary condensation, the term Vc (dp/dt) is minimal. Effectively, during such phenomena, the increase in pressure with time is small. Furthermore, almost all of the flow of gas to the sample is adsorbed leading to f ≈ f a. In such cases, the Eq. (4) can be simplified to:
| (5) |
Thus if the rate of gas flow, f, is constant, a direct measurement of with the amount adsorbed is recorded [5].
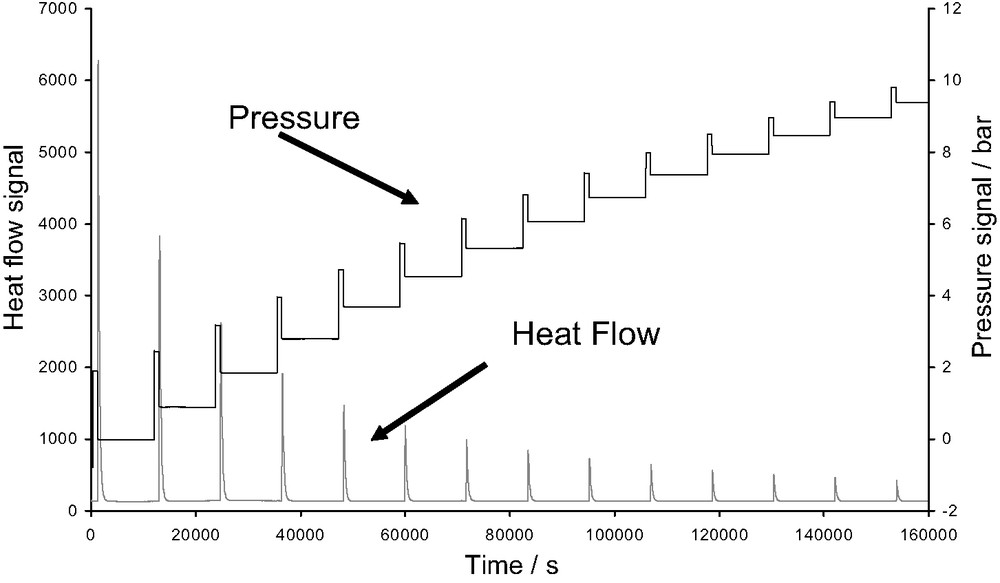
An example of the results that can be obtained using combined adsorption manometry/calorimetry is given in Fig. 4. This figure represents the direct signals of pressure and heat flow as a function of time, recorded during the adsorption of nitrogen onto a well-organised graphite sample [7].
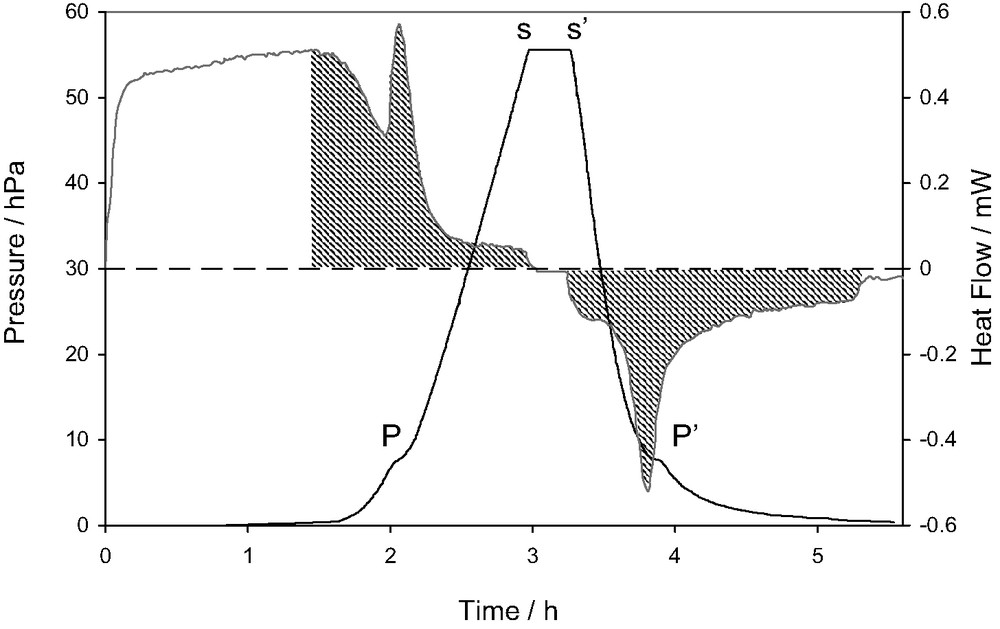
Plot of the signals of heat flow and pressure obtained during the adsorption of nitrogen on graphite at 77.4 K. (adapted from [7]).
This diagram highlights several points relative to the measurement of differential enthalpies of adsorption using the continuous procedure of gas introduction. It can be seen that the initial introduction of gas, up to 1.5 h, leads to only a slight increase in the pressure signal. This corresponds to a relatively strong signal in the heat flow curve that is the result of monolayer adsorption on a highly organised homogeneous surface. The point ‘P’ corresponds to a small step in the pressure signal and a large peak in the heat flow signal. This phase transition corresponds to the completion of the monolayer in epitaxy with the highly organised substrate [7]. At point ‘s’ however, the flow of gas is stopped in order to check equilibrium. It can be seen that the pressure signal does not change and the heat flow signal decreases to the baseline within the response time of the calorimeter. These two points allow the conclusion of a quasi-equilibrium state. At point ‘s’, the vacuum line is opened to desorb the nitrogen and check the reversibility of the system. Note that this is one of the requirements for the above-mentioned calculations. It can be seen that at ‘P’, an effect similar to that produced on adsorption occurs. This event and the fact that the two hatched areas are equivalent show the reversibility of this system.
2.2 Microcalorimetry at ambient temperatures
Many applications using adsorption are carried out at room temperature and above. In such cases it can be of interest to carry out microcalorimetric experiments in the region 25–150 °C. Indeed, with one complete adsorption microcalorimetric experiment (isotherm and enthalpy curve) it is possible to predict isotherms at other temperatures using the Clausius–Clapeyron equation rearranged from its more common form:
| (6) |
A schematic diagram of an apparatus used for microcalorimetric experiments in the temperature region from 25 to 150 °C is given in Fig. 5. This Tian–Calvet type microcalorimeter is constituted by two thermopiles mounted in electrical opposition. Each thermopile is comprised of around 500 chromel–alumel thermocouples.
Schematic diagram of an adsorption microcalorimeter able to work in the temperature range 25–150 °C and to pressures up to 50 bar.
The adsorption isotherms are obtained using a manometric device built to withstand pressures up to 100 bars. The pressure gauge measures pressures up to 50 bars. A point by point introduction of gas is most adapted to this system. However, in cases where high resolution is required at low pressure, a quasi-equilibrium gas dosing procedure can be used. The gas is introduced via a double pneumovalve system into the reference volume. Once the pressure is stabilised in this volume, a pneumovalve is opened to allow the gas to reach the sample. Each introduction of adsorbate to the sample is accompanied by an exothermic thermal effect, until equilibrium is attained (see Fig. 6 below). This peak in the curve of energy with time has to be integrated to provide an integral (or pseudo-differential) molar enthalpy of adsorption for each dose.
Pressure and heat flow signals obtained during an adsorption microcalorimetric experiment at 30 °C using a point by point procedure of gas introduction.
The calorimetric cell (including the relevant amounts of adsorbent and gas) is considered as an open system. In this procedure, as well as in the quasi-equilibrium procedure of gas introduction (following section) it is important to consider that the gas is introduced reversibly. However, to calculate the differential enthalpy of adsorption via the point by point procedure, one must introduce quantities dn small enough for a given pressure increase dp.
Under these conditions it is possible to determine the differential enthalpy of adsorption , via the following expression:
| (7) |
Here, dQrev is the heat reversibly exchanged with the surroundings at temperature T, as measured by the calorimeter. dna is the amount adsorbed after introduction of the gas dose, dp is the increase in pressure and Vc is the dead space volume of the sample cell within the calorimeter itself (thermopile). The term Vc dp can be obtained via blank experiments.
A recording of the experiment is given in Fig. 6.
3 Theoretical microcalorimetric curves
The differential enthalpy curve obtained from adsorption microcalorimetric experiments is a global effect that includes both adsorbate–adsorbent as well as adsorbate–adsorbate interactions. Various adsorbate filling mechanisms and phase transitions can be highlighted, as well as any structural changes of the adsorbent.
In general though, the calorimetric curve highlights three different types of behaviour as schematised in Fig. 7. In each system, an increase in the amount of gas adsorbed on a sample leads to an increase of the interactions between the adsorbate molecules. Concerning the adsorbate–adsorbent contributions, the interaction of an adsorbate molecule with an energetically homogeneous surface will give rise to a constant signal.
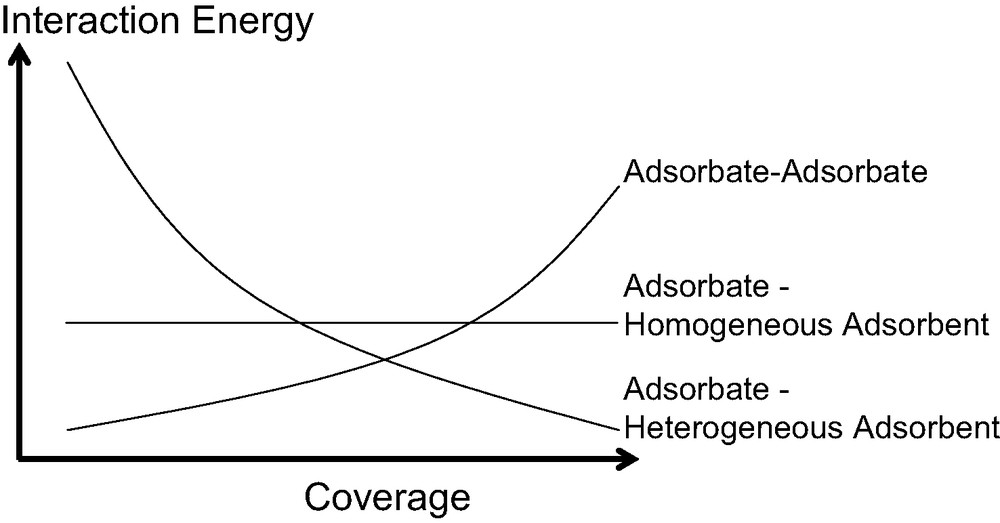
Hypothetical breakdown of calorimetric curves due to various interactions in play during the adsorption of simple gases at low temperature.
Finally, in most cases, the adsorbent is energetically heterogeneous due to a pore size distribution and/or a varying surface chemistry (defects, cations…). Initially, one would expect relatively strong interactions between the adsorbing molecules and the surface. The strength of these interactions will then decrease as these specific sites are occupied. Thus, for energetically heterogeneous adsorbents, a gradual decrease in the calorimetric signal is observed. However, each differential enthalpy curve varies and results from the contributions of each interaction.
Both Kiselev [8] and Sing and Ramakrishna [9] have put forward classifications of differential enthalpy curves. Fig. 8 shows hypothetical differential enthalpy of adsorption curves that would correspond to the IUPAC [10] classification of adsorption isotherms.
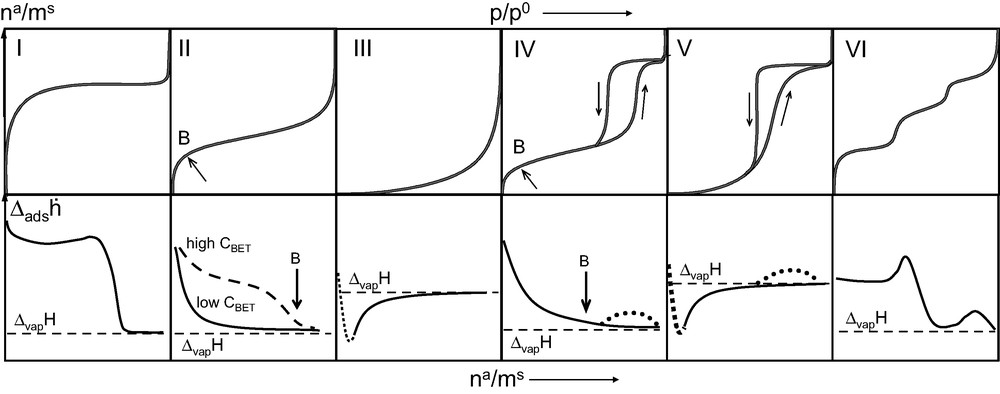
Six IUPAC classified isotherms [10] (upper row) and corresponding hypothetical differential enthalpy of adsorption curves (lower row).
For non-porous and macroporous (dp > 50 nm) solids which give rise to Type II isotherms, the differential enthalpy curve invariably decreases rapidly to the enthalpy of vaporisation (ΔvapH) of the adsorbate gas. In several cases where there exist many specific sites on these materials, this decrease in the curve is less pronounced. These differences would seem to correspond to different C values derived from the BET equation.
Mesoporous materials (2 < dp < 50 nm) which normally lead to Type IV isotherms also give rise to differential enthalpy curves which decrease to the enthalpy of vaporisation (ΔvapH) of the gas under investigation. For solids with a very narrow pore size distribution (MCM-41 type materials, for example) a slight increase in calorimetric signal of around 0.5–1 kJ mol–1 is observed during the capillary condensation step [11].
Systems that give rise to Type III or Type IV isotherms are indicative of very weak adsorbate–adsorbent interactions. For these systems, the differential enthalpy of adsorption is initially below that of the enthalpy of vaporisation of the adsorbate. In such cases, it would seem that entropy effects drive the adsorption process.
Type VI isotherms are typical for very homogeneous two-dimensional solids such as graphite. Each step corresponds to the edification of a different adsorbate layer. The differential enthalpy curve is relatively constant for the initial monolayer coverage. The completion of this monolayer results in a distinct peak in the differential enthalpy curve which corresponds to the formation of an epitaxial layer of adsorbate (see above, Fig. 4). It is noteworthy that this 2-dimensional disorder–order transition was first observed by microcalorimetry [12] before being characterised by neutron diffraction methods [13].
Finally, the filling of micropores (dp < 2 nm) is characterised by Type I isotherms. This is the case for zeolites for example. The initial uptake is characterised by a very small increase in pressure and is the result of enhanced interactions. Such cases are ideal for microcalorimetric studies as the technique is at its most sensitive. The differential enthalpy of adsorption curves are typically elevated throughout the pore filling process.
4 Adsorption microcalorimetry results obtained at 77 K
The zeolite family of materials are ideal model systems for understanding adsorption behaviour. It is the knowledge gained by such studies, using thermodynamic methods (manometry, calorimetry…), combined with structural methods (neutron diffraction, X-ray scattering…), which permits, by analogy, the interpretation of the phenomena that occur in more disordered systems. Simulation studies are essential to complete this fundamental understanding.
However, the regularity of the channel systems in zeolite type systems can lead to distinct adsorption phenomena due to the confinement in such homogeneous systems. Nevertheless, a fine example of the adsorption in an energetically homogeneous solid is given in Fig. 9.
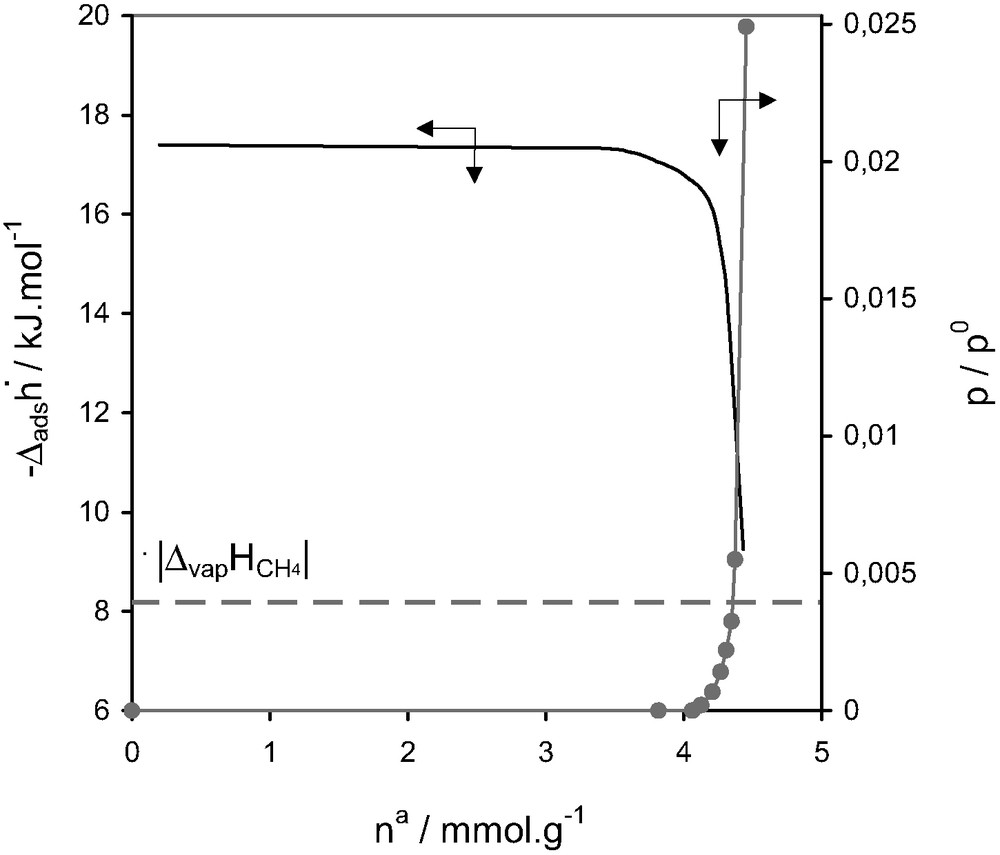
Enthalpies of adsorption and relative pressure as a function of quantity adsorbed at 77.4 K for methane on silicalite-I [15].
Silicalite-1 is characterised by a two sets of 10-ring channels [14]. The first set has an elliptical section (0.52 × 0.57 nm2) which intersects perpendicularly with a second sinusoidal channel system of quasi circular section (0.54 × 0.56 nm2). The intersections are approximately 0.8 nm in diameter. The behaviour shown during the adsorption of methane on silicalite at 77.4 K (Fig. 9) can be considered almost as model. The quasi-horizontal calorimetric signal, corresponding to the entire micropore filling region, would seem to be the result of adsorbent–adsorbate interactions only. One would expect a certain contribution due to adsorbate–adsorbate interactions, however this would seem to be minimal due to the reduced possibility of such interactions taking place in such a confined pore system.
4.1 Following steps in micropore filling
For some zeolite type systems, the different stages of micropore filling can be followed by adsorption calorimetry, for example for large-pore zeolites a two-step filling process can be observed.
The 13X zeolites consist of regularly spaced spherical cages of 1.25 nm in diameter. These cages are linked to each other by four circular windows of about 0.74 nm in diameter. The negatively charged silico-aluminate framework requires compensation cations. For zeolite 13X, these exchangeable cations are sodium. Whilst the Si/Al ratio can be modified in such structures, it is difficult to directly prepare a pure silica analogue as is the case for silicalite. As such, to prepare very high silica samples, a dealumination process is required. Whilst the structure becomes electrically neutral after dealumination, this process can induce secondary porosity.
A study of the adsorption of nitrogen at 77 K on 5 A and NaY zeolites using quasi-equilibrium, isothermal, adsorption microcalorimetry experiments at 77 K [16] detected a step in the differential enthalpies of adsorption, towards the end of micropore filling (Fig. 10). At the time, this was interpreted as a consequence of specific adsorbate–adsorbate interactions. A second explanation is simply that the cages are filled in two steps: near the walls, before complete filling.
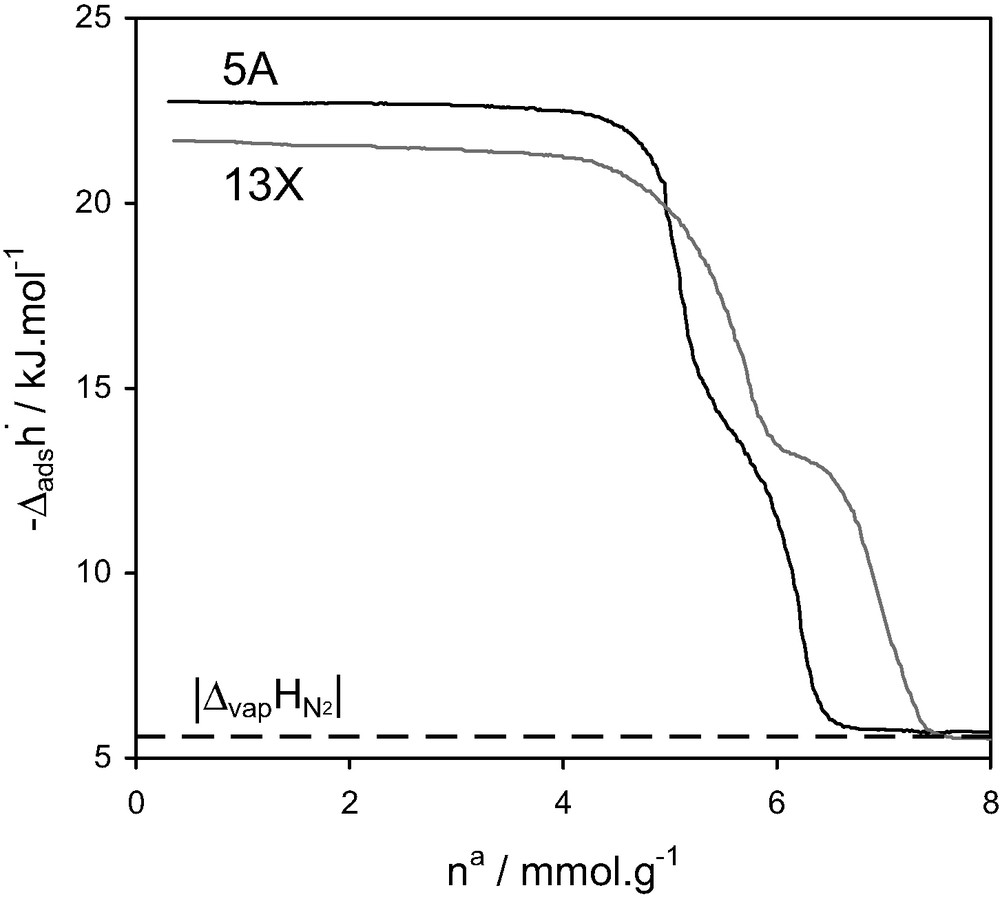
Differential enthalpies of adsorption and relative pressure as a function of quantity adsorbed at 77.4 K for nitrogen on 5 A and NaY zeolites [16].
For adsorption on AlPO4-11, an unusual pore filling mechanism can be observed using adsorption calorimetry. AlPO4-11 has a rectilinear pore system similar to that of AlPO4-5. However the cross-section of the pores is elliptical (0.39 × 0.63 nm2). The adsorption of a number of probe molecules occurs in two distinct steps as is indicated in Fig. 11 [17,18]. From the form of the differential enthalpy curve, each step would seem to correspond to a relatively homogeneous filling process. Complementary neutron diffraction experiments show that the coefficient of diffusion for the first step is around 1/10th of that in the second step [17,18]. This is contrary to the expected behaviour where the coefficient of diffusion decreases with increasing adsorbate loading.
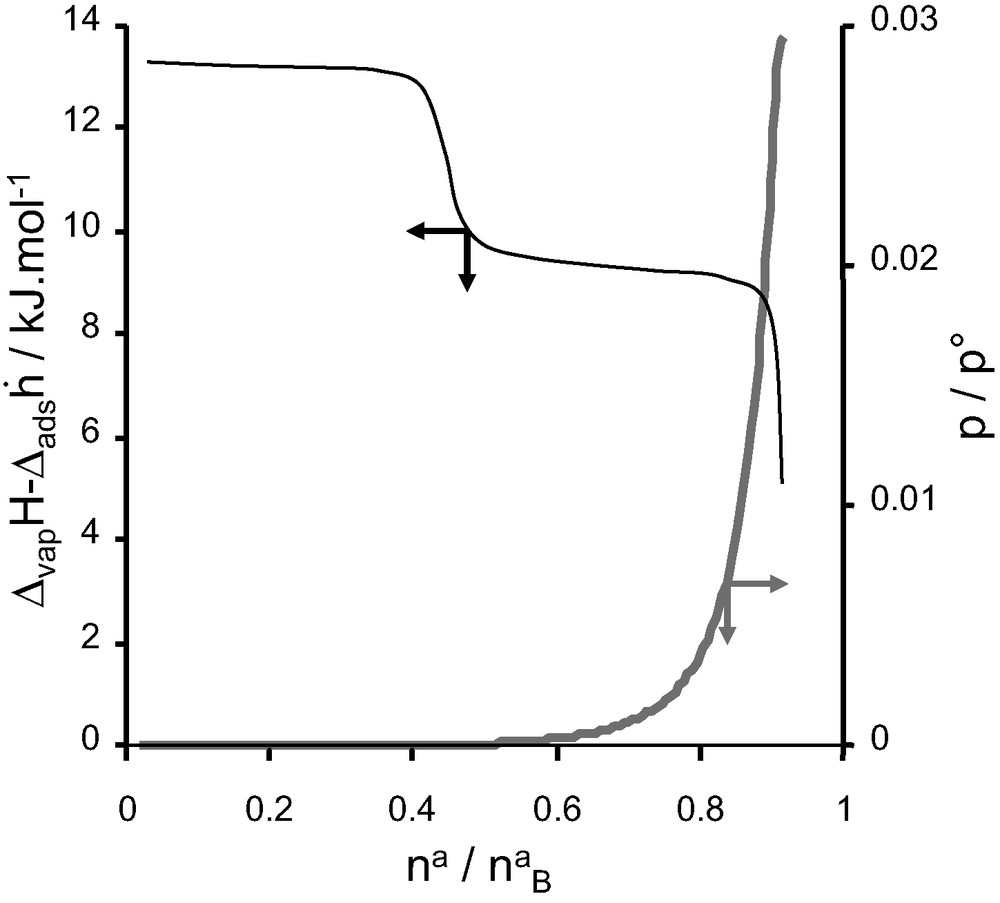
Differential enthalpy (black) and isotherm (grey) for the adsorption of carbon monoxide on AlPO4-11 at 77 K.
In this example, however, the adsorbate is initially situated in the most curved part of the elliptical pore. The curvature acts as a very strong adsorption site, but about 50% of the porosity remains unfilled. In the second adsorption step, the initial adsorbate molecules have to be dislodged to allow the complete filling of the micropores.
4.2 Characterisation of specific adsorption sites
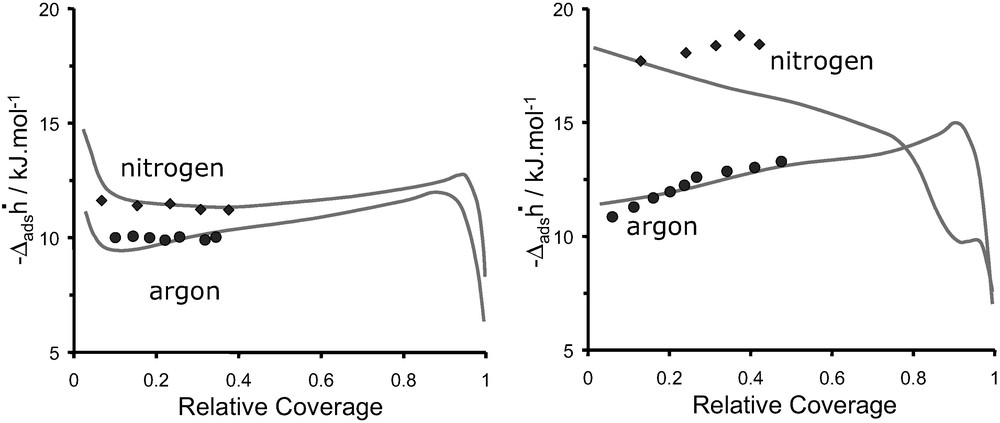
The chemistry of the nanopores in zeolite systems can be probed directly by microcalorimetry. In such cases, the comparison in behaviour observed for non-polar probes such as argon with polar probes such as nitrogen is of interest. Fig. 12 shows an example for the adsorption in two faujasite type zeolites at 77 K. DAY is the dealuminated form of NaX which initially contains a large number of sodium extra framework cations. The dealumination process [19] induces a textural heterogeneity (faults, defects) leaving the structure purely silicic and ideally energetically homogeneous. NaX however, can be considered structurally and texturally more homogeneous than DAY, however, the sodium cations induces chemical heterogeneities or “specific adsorption sites”.
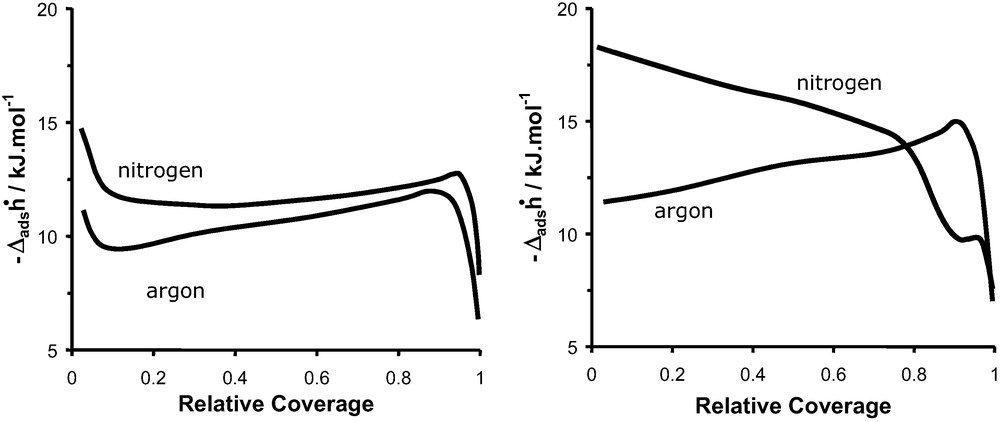
Differential enthalpies of adsorption as a function of coverage at 77 K of Ar and N2 on (left) DAY, and (right) NaX.
Fig. 12 shows the differential enthalpies of adsorption as a function of relative coverage obtained during the adsorption at 77 K of argon and nitrogen on DAY and NaX zeolite samples. The relative coverage is calculated as the ratio of amount adsorbed to the amount required to fill the micropores (calculated from the t-plot).
The adsorption of argon and nitrogen on DAY (Fig. 12a) gives rise to similar shaped curves that initially sharply decrease before a gradual increase until the end of micropore filling. This initial sharp decrease would seem to correspond to the adsorption at defect sites formed during the dealumination process. From the enthalpy curve it can be estimated that less than 10% of the adsorption occurs at these defects. Argon is considered not to interact with chemical heterogeneities as it has been shown for the adsorption on non-porous silicas [20–23] as well as on MCM-41 type samples [24]. Thus, the argon probes the textural defects formed during dealumination. The quadrupole moment of nitrogen further interacts with specific surface chemical sites such as residual silanol’s.
Above a relative coverage of 0.1, the gradual increase in enthalpy curves for both argon and nitrogen corresponds to the combined “constant” interaction of the gas with a relatively homogeneous surface of the zeolite (other than the defects) and the increasing lateral interactions between adsorbate species. One would expect that both argon and nitrogen fill energetically equivalent sites distributed in the supercage. The sharp decrease in differential enthalpies occurs at the end of micropore filling where the values tend towards those of liquefaction.
The differential enthalpy curves of argon and nitrogen at 77 K on NaX differ from those on DAY. The curve obtained for argon (Fig. 12b) shows a constant increase that can be interpreted as the sum of interactions between adsorbate–homogeneous surface and adsorbate–adsorbate molecules. Nevertheless, no initial decrease in the differential enthalpies is observed in the case of NaX which suggests the absence of textural defects. The adsorption of nitrogen on NaX at 77 K (Fig. 12b) shows a constant decrease to a relative coverage of around 0.9 where a second short step is observed up to the end of the micropore filling process. This decrease in differential enthalpy would suggest that the nitrogen probes NaX as an energetically heterogeneous surface. Considering this and the much higher values of differential enthalpies than those observed for argon, it is clear that the quadrupole moment of nitrogen probes the energetic heterogeneity due to the presence of sodium cations. The nitrogen initially adsorbs close to the sodium sites [25] before occupying less energetic sites within the supercages. The step in the differential enthalpy curve has previously been observed [16] and can be considered as the second step of the micropore filling process. The first step can be considered as the adsorption in the region around the cations and framework oxygen whereas the second step corresponds to the completion of the pore filling process in the space remaining at the centre of the faujasite cages. Such an explanation is corroborated by NMR studies [26].
A second method to follow the surface chemistry of zeolites where compensation cations are often present is to compare the adsorption enthalpies at zero coverage. An example is shown in Fig. 13. The adsorption of various simple gases was studied on a series of hydrogen-exchanged ZSM-5 zeolites with different Si/Al ratios. The enthalpies at zero coverage are plotted as a function of the Si/Al ratio in Fig. 13. It can be seen that for non-specific gases, such as methane, argon and krypton, there is little change in adsorption energy. For nitrogen (quadrupole) and carbon monoxide (dipole) with a permanent electric moment, a distinct variation in interaction energy is observed. Indeed, an increase in Si/Al ratio results in a decrease in the content of the compensation cation (here, H+). The cations within the structure can be considered as specific adsorption sites.
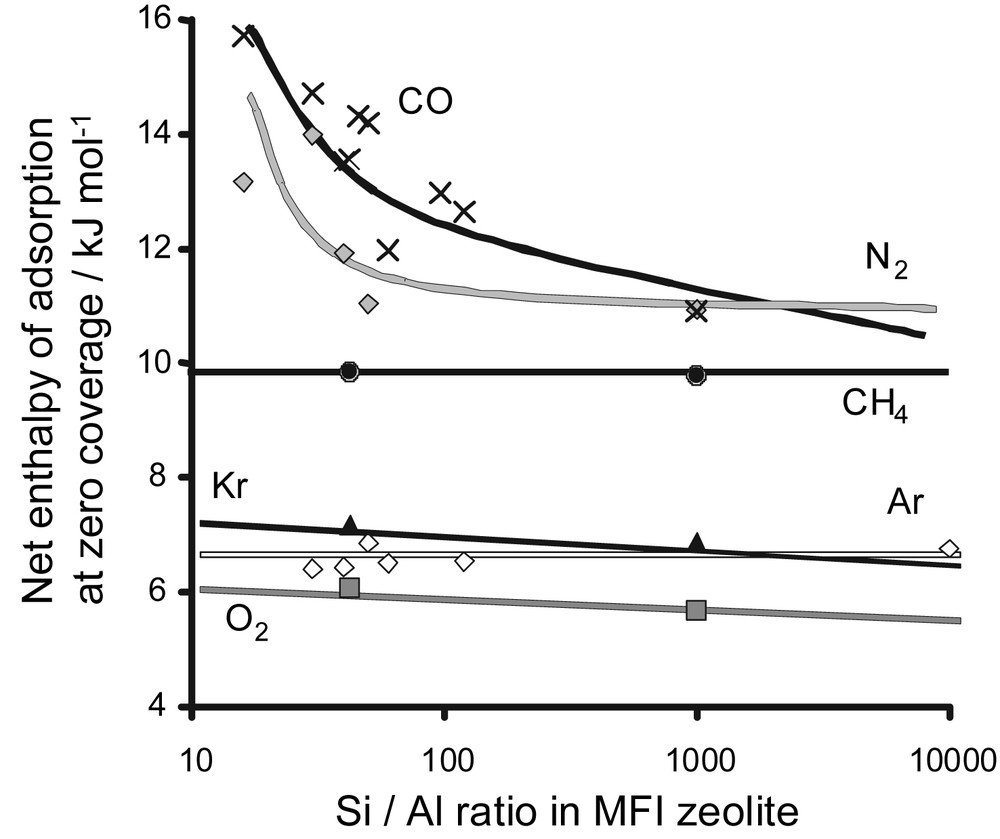
Adsorption energies for different probe molecules as a function of the Si/Al ratio for various HZSM-5 zeolites.
4.3 Detection of adsorbate phase changes
The adsorbed gas can sometimes be highly influenced by the homogeneity of the surface with which it is in contact. For instance, in the case of nitrogen adsorption on graphite (Fig. 4) the nitrogen forms an epitaxial film on completion of the surface monolayer. Even more surprising phenomena can occur during adsorption on some zeolites and aluminophosphates, for example silicalite and AlPO4-5.
Fig. 14 highlights the rather interesting adsorption behaviour that can be observed for the adsorption of nitrogen on silicalite at 77 K. The adsorption isotherm exhibits two substeps, α and β. The initial pore filling, however, results in a differential curve which is not completely horizontal. An initial decrease would seem to indicate an enhanced interaction, possibly with defect sites. This curve then increases again which seems to be characteristic of increasing adsorbate–adsorbate interactions.
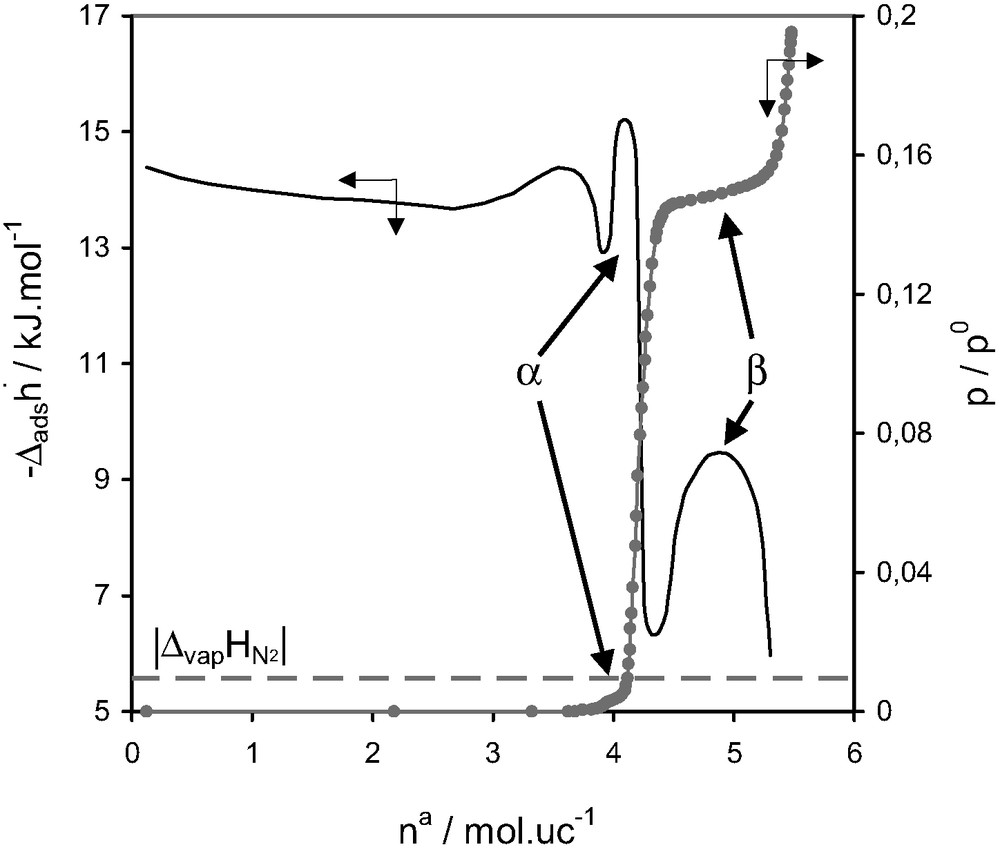
Differential enthalpies of adsorption and relative pressure as a function of quantity adsorbed at 77.4 K for nitrogen on silicalite [27].
The substeps in the isotherm correspond to marked differences in the differential enthalpy curves. Although this second substep, β, was observed in the isotherm prior to any microcalorimetic measurements [28,29], the first substep, α, was initially mentioned in the calorimetric curve [27]. An additional study by neutron diffraction was carried out on this system [27]. The first substep, α, was concluded to be due to an ordering of the adsorbate from a fluid phase to a network fluid. The second substep, β, would seem to correspond to an adsorbate phase transition similar to that previously observed for argon [15,29], characterised by a network fluid to a ‘solid-like’ adsorbate phase.
Much research has been done into the synthesis of zeolite-like materials with framework species other than silica and alumina. The first family of materials that resulted from this research were the aluminophosphate molecular sieves. Thus AlPO4-5 [14,30] has a unidirectional pore system consisting of parallel circular channels of 0.73 nm in diameter. AlPO4-5 has a framework which, like silicalite-I, has a pore wall which is theoretically globally electrically neutral, although the pore openings are slightly larger than those of the MFI-type zeolites. These characteristics make AlPO4-5 an excellent structure for fundamental adsorption studies.
For AlPO4-5, the adsorption isotherms of argon and nitrogen traced up to a relative pressure of 0.2 are indistinguishable (Fig. 15). Methane adsorbs significantly less, suggesting a different pore filling mechanism.
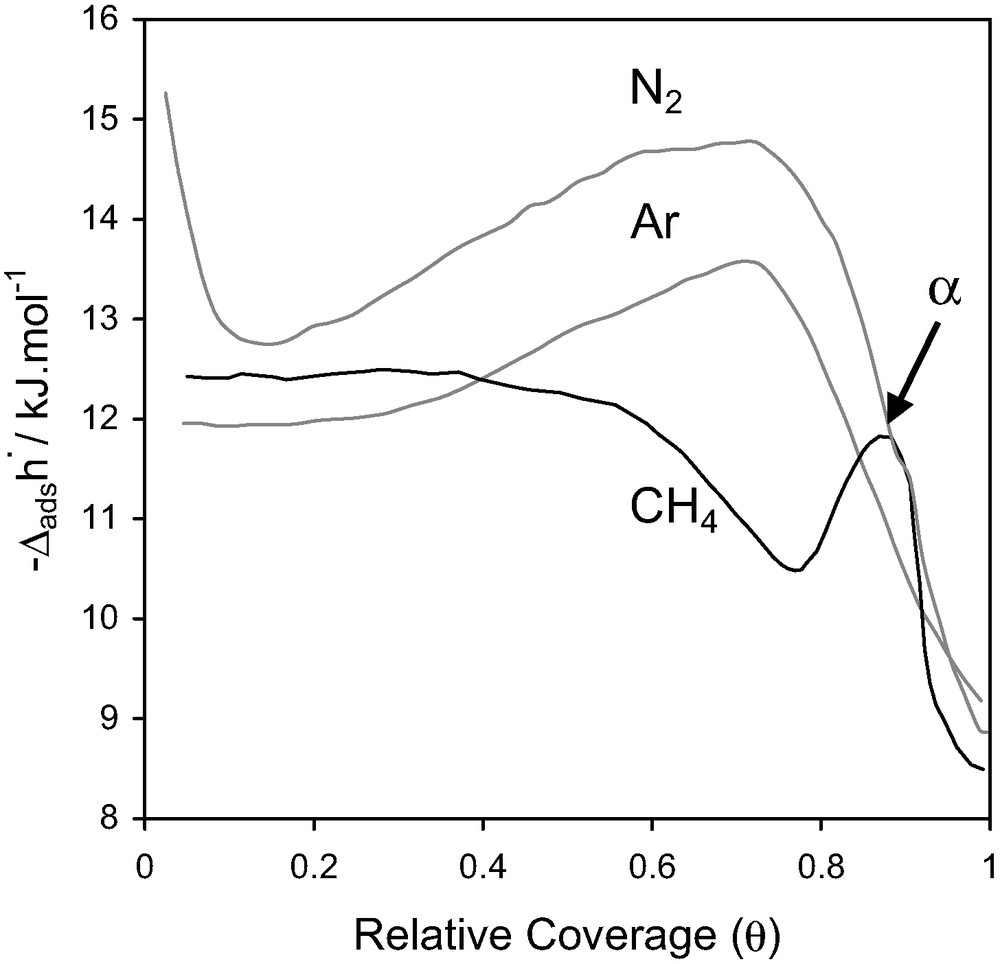
Differential enthalpies at 77.4 K for nitrogen, argon and methane adsorbed on AlPO4-5 [31].
For the adsorption of methane, an exothermic peak (noted α in Fig. 15) is observed in the differential enthalpy curve, which would seem to correspond to an energetic term ≈ RT. This could indicate both a variation of mobility and a variation of the adsorbed methane phase. An additional neutron diffraction study [32] indicated that the behaviour of the methane adsorbed phase is unusual. The methane appears to undergo a transition between two solid-like phases. The first ‘solid-like’ phase corresponds to the adsorption of four molecules per unit cell, whilst the second phase corresponds to an increase in the amount adsorbed to six molecules per unit cell.
This could be a result of a favourable dimensional compatibility between the methane molecule and AlPO4-5 micropore, permitting, from a spatial point-of-view, the appearance of two relatively dense phases. This hypothesis is supported by simulation studies [33].
5 Adsorption microcalorimetry at 302 K
Whilst adsorption at low temperature is mainly used for the characterisation of adsorbent materials, as has been highlighted above, adsorption at ambient temperatures is of interest due to the possibility to relate to applications. Indeed, adsorption is used in processes involving storage and separation of gases. These processes involved both kinetic phenomena, which can be related to the pore texture, and thermodynamic phenomena, which are related to the chemistry of the pores. Whilst a number of processes make use of kinetic phenomena, such processes can be made quicker if thermodynamic phenomena are privileged.
When comparing the adsorption at 77 K with that at ambient temperature the phenomenological problem of type of representation of adsorption must be addressed. Adsorption is defined in terms of ‘enrichment of material or increase in the density of a fluid in the vicinity of an interface’ [4,34]. One can consider excess or absolute [35,36] quantities. Generally the concept of a Gibbs Dividing Surface or ‘GDS’ is considered where an arbitrary dividing surface is chosen in the volume in which adsorption can take place. This implies that the quantity adsorbed is the amount of molecules retained by the surface at a concentration higher than that of the bulk gas. Such a representation of adsorption leads to excess quantities adsorbed. One would prefer to consider absolute quantities which would correspond to the total quantity of molecules close to the surface. These values however, are difficult to measure directly and one generally makes use of excess quantities. The relationship between these two quantities can be given by na = nσ + c·va, where na is the absolute amount adsorbed, nσ the excess amount adsorbed, c the concentration of adsorbate in the gas phase and va the volume of the adsorbed phase. In the case of zeolites it is possible to consider the total pore volume for va [37,38]. This total pore volume was obtained from the t-plots of the isotherms obtained at 77 K. The difference in ‘absolute’ and ‘excess’ amounts adsorbed is generally within magnitude of less than 1% for the adsorption at 77 K on microporous solids and in the present case, this difference is about 0.2%. For the adsorption at 302 K, differences in the range of 10–15% occur in the amounts adsorbed at 30 bars. These differences equally affect the differential enthalpies of adsorption.
5.1 Comparison of results obtained at 302 K and 77 K
From several points of view it can be of interest to compare adsorption systems at different temperatures. Indeed, the isosteric method [39,40] is based on the measurement of isosteres which can then be converted to give enthalpies of adsorption as a function of adsorbate loading. More generally, one can compare a limited number of adsorption isotherms obtained within a small interval of temperature [4] to obtain isosteric enthalpies of adsorption, via the Clausius–Clapeyron equation. In these cases, one considers that the adsorption is reversible, i.e. that no chemisorption mechanism is involved. It is for this reason that isosteric enthalpies are obtained with isotherms measured generally within a 30 K range.
Many adsorption interaction studies have been carried out over wide ranges of temperature using methods such as the isosteric method [39,40], gas chromatography [41,42] and others. However, none of these studies has made use of direct calorimetric measurements to test the validity of the thermodynamic interpretation of results.
Fig. 16 shows a comparison of the enthalpy curves obtained for argon and nitrogen on DAY and NaX, respectively. The points are the values obtained at 302 K whereas the lines represent the values obtained at 77 K (cf. Fig. 12). These pseudo-differential enthalpies of adsorption are obtained at 302 K assuming absolute amounts adsorbed.
Differential enthalpies of adsorption, at 302 K (symbols) and 77 K (continuous line) as a function of Ar and N2 coverage: (left) DAY, and (right) NaX.
The measurements at 302 K of argon and nitrogen adsorption on DAY (Fig. 16a) each give rise, within experimental error, to constant differential enthalpy values. This suggests a compensation between decreasing adsorbate–mildly heterogeneous adsorbent interactions and increasing adsorbate–adsorbate interactions (Fig. 7). The initial sharp decrease in enthalpy observed in the experiment at 77 K is not observed at 302 K due to the lack of points at low coverage. The adsorption of argon and nitrogen (Fig. 16b) on NaX gives rise to increasing enthalpies with coverage. Argon highlights interactions with a “homogeneous” surface along and increasing adsorbate–adsorbate interactions. The increase in enthalpies observed with nitrogen is less pronounced suggesting a more heterogeneous surface.
From the adsorption of argon and nitrogen on DAY (Fig. 16a) it can be seen that the values obtained at 302 K assuming absolute quantities coincide well with those obtained at 77 K. Considering the adsorption of argon on NaX (Fig. 16b), a relatively good agreement is again observed between differential enthalpy values obtained at 302 K assuming absolute quantities with those obtained at 77 K. The adsorption of nitrogen on NaX (Fig. 16b) is less straightforward. Whilst the differential enthalpy of adsorption at low coverage seems to show a fair agreement between each temperature, with increasing amounts adsorbed however, the enthalpies differ.
The systems in this study were chosen to simplify the adsorption phenomena involved. As such it is possible to assume that the DAY behaves essentially as a non-specific surface and that argon acts as a non-specific probe molecule. The sodium cations in NaX act as specific adsorption sites and the quadrupole moment of nitrogen makes it a specific probe. Following Kiselev’s [43] ideas one can see that non-specific adsorption phenomena should occur for the Ar/DAY, N2/DAY and Ar/NaX systems. Of the various systems in the present study N2/NaX is the only one that should give rise to ‘specific adsorption’ phenomena.
It is possible to speculate on the different behaviour of nitrogen in the X-faujasite at each temperature. Whilst this probe should be more localised at 77 K, it may be more mobile at 302 K and statistically interact with more adsorption sites. Computer modelling will provide a deeper insight here.
5.2 Adsorption microcalorimetry at 302 K: role of compensation cations
At room temperature, gas adsorption is used for storage and separation. In both processes, the role of the compensation cation can be crucial. In the past few years, some experimental studies [44–48] have been dealt with the influence of either the nature or distribution and density of these extra-framework cations on the adsorption properties of various zeolite systems. It was clearly established that these cations play a key role in the adsorption phenomena in such materials. For instance, the lithium and calcium cation exchanged faujasites are adsorbents [49–51] in the separation of air by pressure/vacuum swing adsorption procedures whereas the barium exchanged form is involved in the selective separation of aromatic molecules [52]. Such processes are based on specific interactions of the adsorbates with the field gradient generated by the cations.
It can thus be of interest to systematically study the adsorption on various cation exchanged samples. The compensation cation, as a specific adsorption site, plays its strongest role at the beginning of the adsorption process. In such cases it is of interest to zoom into this part of the adsorption isotherm, which can be done using a constant and continuous introduction of gas and a continuous following of both pressure and microcalorimetric signals. Such a microcalorimetry set-up is available [53] which uses such a quasi-equilibrium dosing method.
It can be seen that for each set of cations, the interaction with nitrogen increases with increasing cation radius. This can not only be observed in Table 1 but it is also pointed out in the isotherms by a greater curvature in isotherm shape accompanied by a higher uptake at a given pressure. This increase in interaction can be explained by the variations in charge density of the cations [54].
Differential enthalpies of adsorption extrapolated to zero coverage for the various cation exchanged X-faujasite/N2 systems at 300 K
| Monovalent species | (kJ mol–1) | Divalent species | (kJ mol–1) |
| LiX | 25.0 | MnX | 30.0 |
| NaX | 19.0 | CaX | 27.0 |
| KX | 14.0 | SrX | 26.0 |
| BaX | 21.0 |
With the quasi-equilibrium method of gas introduction, it is possible to obtain significant data in the very low pressure region of the isotherm. With this data, it is possible to extract the initial linear region, or Henry’s region in which it is possible to obtain Henry’s constants. These Henry’s constants are given in Table 2 for the series of divalent cations.
Henry’s constants for the various divalent containing faujasites/N2 systems obtained both experimentally at 300 K
| Type of zeolite | Henry constant kH/mmol g–1 |
| MnX | 4.793 |
| CaX | 2.185 |
| SrX | 1.726 |
| BaX | 0.199 |
Furthermore, it is possible to plot the variation of enthalpy of adsorption extrapolated to zero coverage as a function of the log of the Henry’s constant for each faujasite system (Fig. 18). A straight line relationship can be observed which can be related to the following Van’t Hoff equation [4]:
| (8) |
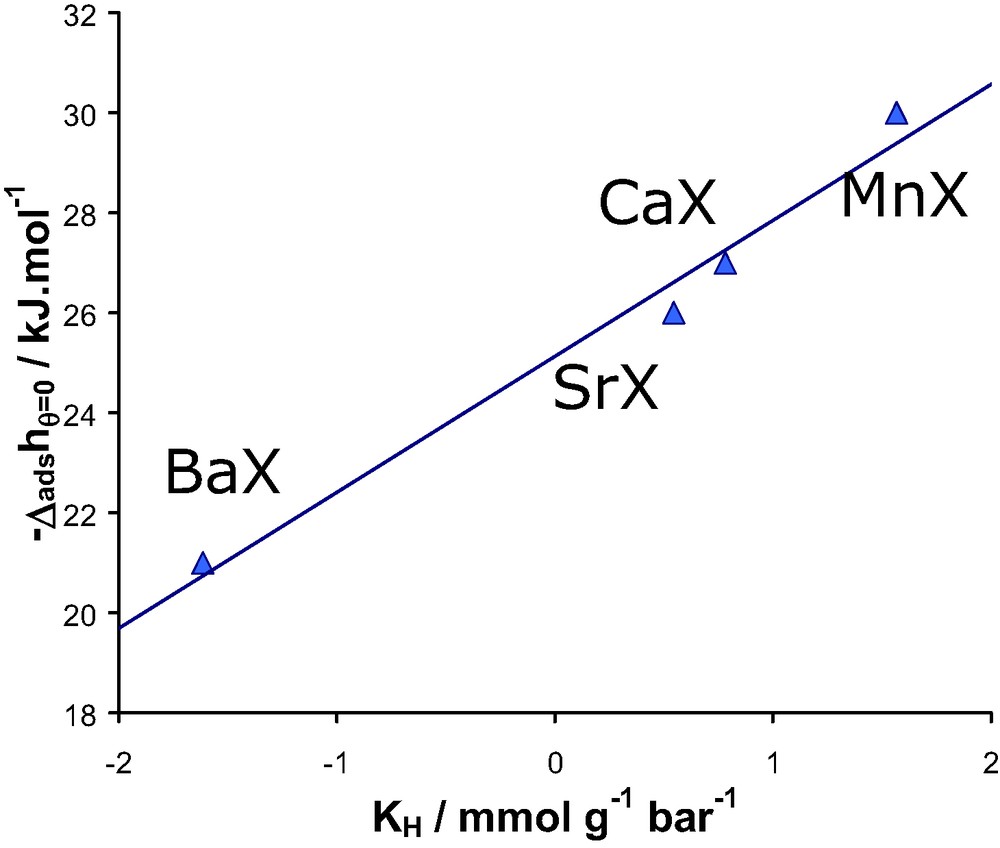
Linear relationship between the experimental differential enthalpy of adsorption at low coverage and the logarithm of Henry’s constant or the various divalent containing faujasites/N2 systems at 300 K.
These results suggest a similar value of K0 for each developed divalent cation-exchanged faujasite system. It is significant as it suggests that the number of adsorption sites is the same and furthermore that the entropy of adsorption is similar.
5.3 Simulation of adsorption microcalorimetry at 302 K to understand the role of compensation cations
A greater understanding of the phenomena observed during adsorption can be obtained from computer simulations involving techniques such as Grand Canonical Monte Carlo. One of the challenges faced by such methods is the possibility to predict the simulation parameters a priori. Here we shall see how it is possible to predict the simulation parameters of a series of cations exchanged in the faujasite structure.
In an initial step, the optimisation of the (ɛO, σO) and (ɛNa+, σNa+) Lennard–Jones (LJ) parameters and the atomic charges of the zeolite framework were obtained from the best agreement between simulation and experiment for the adsorption of both nitrogen and argon on NaX. The initial (ɛO, σO) and (ɛNa+, σNa+) LJ parameters set were taken from the Ref. [55] and the partial charges on silicon and oxygen of the faujasite framework system were fixed at the usually considered values [56] i.e. +2.4 and –1.2 e, respectively. The charges on aluminium and on sodium cations were allowed to change in order to take into account the partial charge transfer from the framework, with the constraint of a global charge of zero for the faujasite system. The chemical composition (with Mn+ = Li+, Na+, K+, Ca2+, Mn2+, Sr2+ and Ba2+) was considered in order to reproduce the Si/Al ratio equals to 1 of the investigated samples. For NaX zeolite, the distribution defined by Vitale et al. [57] was selected corresponding to 32 Na+ in sites I’ located in the sodalite cage in front of the six-ring window connected to the hexagonal prism, 32 Na+ in sites II and 32 Na+ in sites III, six-ring and four-ring windows of the supercages, respectively. The distributions of the extra-framework cations for LiX [58] and KX [59] provided by recent reinvestigation of these crystal structures include the occupation of sites I′, II, III and III′ for Li+ and sites I, I′, II, III and III′ for K+. For the divalent cations, we started from a diffraction refinement of the dehydrated CaX faujasite [60] where the 48 Ca2+ extra-framework cations are distributed as follows: 16 Ca2+ cations in sites I located in the centre of hexagonal prisms which connect the sodalite cages and 32 Ca2+ in sites II. This distribution of the extra-framework cations was also used to model in a first approximation BaX [61], SrX and MnX faujasite systems.
Fig. 19 reports the experimental and simulated isotherms and differential enthalpies of adsorption for the two systems. We can observe a nice qualitative agreement in the whole range of pressure up to 45 bars. The resulting potential parameters are the following: (ɛO = 0.0197 eV, σO = 2.708 Å) and (ɛNa+ = 0.00434 eV, σNa+ = 1.746 Å), and the partial charges carried by the aluminium and sodium are +1.7 and 0.7 eV, respectively.
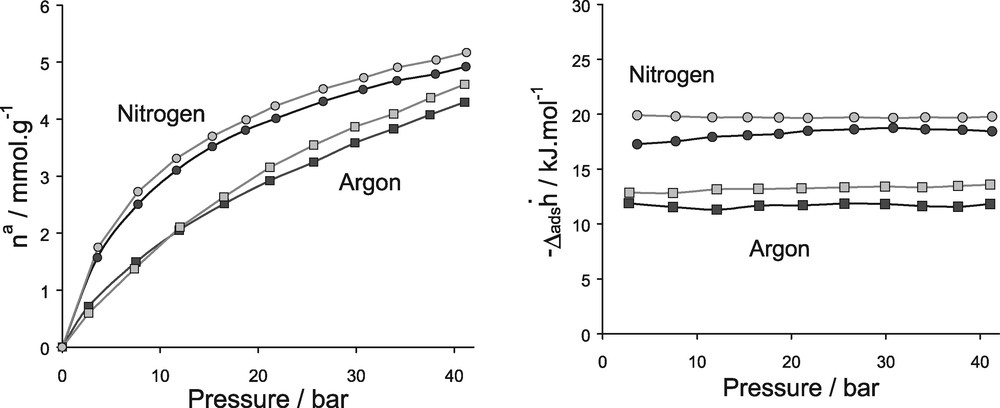
Isotherms (left) and differential enthalpies (right) of adsorption for NaX/N2 and NaX/Ar at 300 K up to 45 bar. (grey) simulation, (black) experiment.
Once this first step is reached, the LJ parameters for the other extra-framework cations were then deduced from those for Na+ using the following relationships:
| (9) |
| (10) |
Ionic radius [62] and polarisability [63] for each investigated monovalent and divalent cation
| Type of cation | Radius Rc/Å | Polarisability α/Å3 |
| Li+ | 0.73 | 1.20 |
| Na+ | 1.16 | 1.80 |
| K+ | 1.52 | 3.83 |
| Mn2+ | 0.89 | 2.64 |
| Ca2+ | 1.14 | 3.16 |
| Sr2+ | 1.32 | 4.24 |
| Ba2+ | 1.49 | 6.40 |
From Eqs. {9} and {10}, and the data reported in Table 3 the LJ parameters for each cation were obtained and are summarised in Table 4.
Lennard Jones parameters for each investigated monovalent and divalent cation
| Type of cations | σ/Å | ɛ/eV |
| Na+ | 1.746 | 0.00434 |
| Li+ | 1.098 | 0.03121 |
| K+ | 2.288 | 0.00388 |
| Mn2+ | 1.339 | 0.04591 |
| Ca2+ | 1.715 | 0.01486 |
| Sr2+ | 1.987 | 0.01108 |
| Ba2+ | 2.243 | 0.01220 |
To test the validity of the interatomic potentials over the entire range of pressure, the isotherm and differential enthalpies of adsorption were simulated for a typical system i.e. CaX/N2 and compared with those measured experimentally. These results are reported in Fig. 20 where a very good agreement between experiment and simulation for both the isotherm and the differential enthalpy which is obtained testifies a good transferability of the LJ parameters even at high pressure.
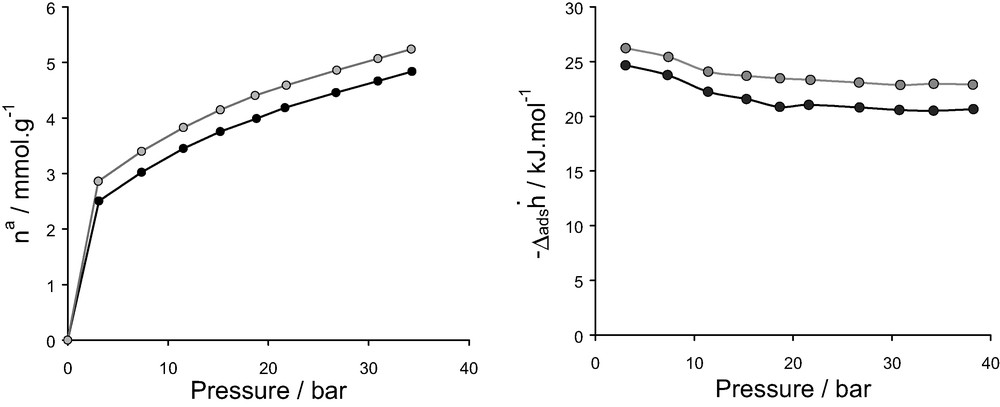
Isotherms (left) and differential enthalpies (right) for nitrogen on CaX at 300 K in the range of pressure 0–40 bar: (grey) simulation, (black) experiment.
To test all of the derived parameters, the simulated nitrogen isotherms up to a pressure of 1 bar are shown in Fig. 21. These isotherms can be directly compared with those in Fig. 17. Table 5 shows a comparison of both the differential enthalpies at zero coverage and the Henrys constants. The simulations indicate that the affinity of adsorption in this low domain of pressure increases in the order MnX > CaX > SrX > BaX for the divalent cations, thus following the increase of the differential enthalpy of adsorption at low coverage. A similar trend in affinity with respect to cation radius is also seen for the monovalent cations (i.e. LiX > NaX > KX).
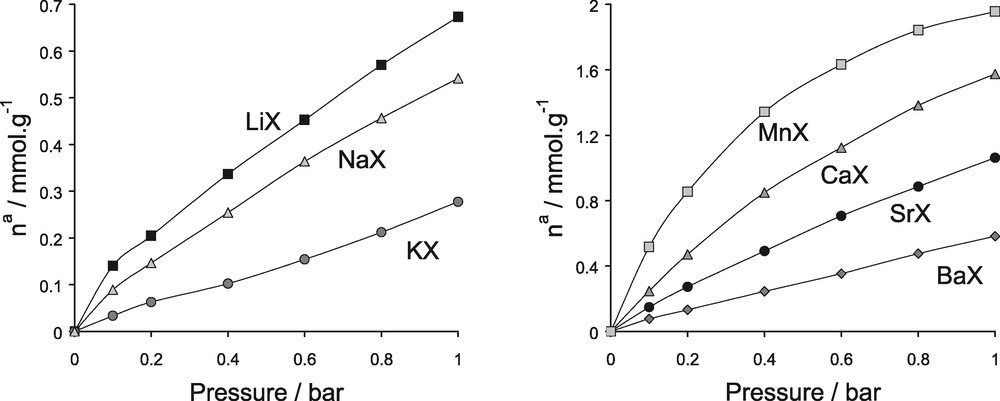
Simulated nitrogen adsorption isotherms various cation exchanged faujasites at 300 K in the range of pressure 0–1 bar (to be compared with the experimental isotherms in Fig. 17).
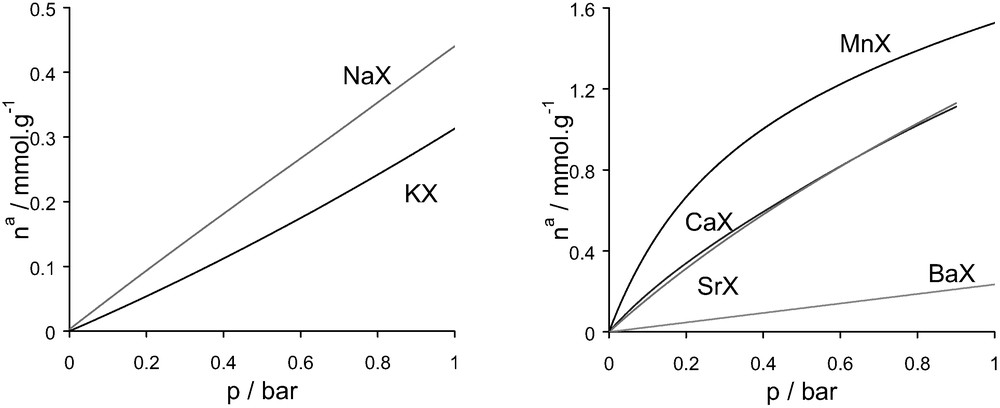
Isotherms of adsorption for the various cation containing faujasites/N2 systems at 300 K in the range of pressure [0–1] bar: left, monovalent species; right divalent cations.
Comparison of the differential enthalpies at zero coverage and Henry’s constants obtained from simulation. These values can be compared with those in Tables 1, 2
| Cation | (kJ mol–1) | kH/mmol g–1 |
| Li | 23.6 | |
| Na | 19.2 | |
| K | 14.1 | |
| MnX | 30.1 | 4.490 |
| CaX | 26.5 | 2.250 |
| SrX | 26.0 | 1.365 |
| BaX | 20.8 | 0.450 |
The overall trends observed in the experiments are reproduced in the simulated low-pressure isotherms for both sets of cations. Some discrepancy can be seen for the strontium-exchanged zeolite. This difference can be related to poor ion exchange or modification during the ion exchange with strontium [64] which would lead to discrepancies with respect to the model.
5.4 Understanding argon and nitrogen interactions with zeolite cations
As mentioned above, it is possible to relate the adsorption behaviour at low pressure to the interaction with the compensation cation of the zeolite which acts as a specific site for adsorption.
Fig. 22 shows the evolution of the differential enthalpies of adsorption at zero coverage as a function of the cation radius for the adsorption of argon and nitrogen at 302 K, respectively. In each case, a decrease in enthalpy is observed with an increase in cation size as would be expected. For monovalent cations, a similar trend is observed for both argon and nitrogen with a decrease of in the series LiX > NaX > KX. By contrast, we observe two different behaviours for the divalent cations, with a maximum of for CaX in the case of adsorption of argon and a decrease in the series MnX > CaX > SrX > BaX for the adsorption of nitrogen, although a shoulder is observed in the case of strontium.
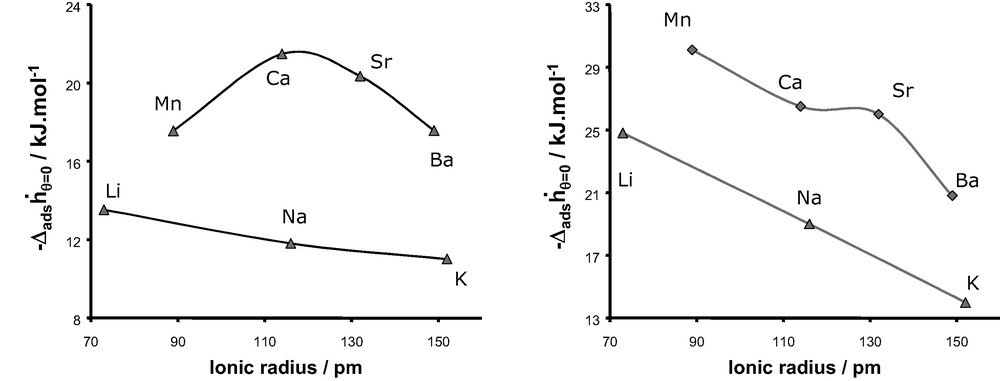
Differential enthalpy at zero coverage obtained experimentally for argon (left) and nitrogen (right) as a function of the compensation cation of faujasite.
In order to explain these various experimental trends, we firstly introduced the concept of chemical hardness [65–67]. This atomic parameter defined by Parr and Pearson [65], can be related to the ability of a given atom to polarise another entity. The harder an atom, the more deformation of the electron cloud of the neighbouring atoms it induces. Thus, the introduction of such parameter is quite convenient because it is an easy way to evaluate the polarisation effect induced by the extra-framework cations on the interacting adsorbate molecules (Figs. 23,24).
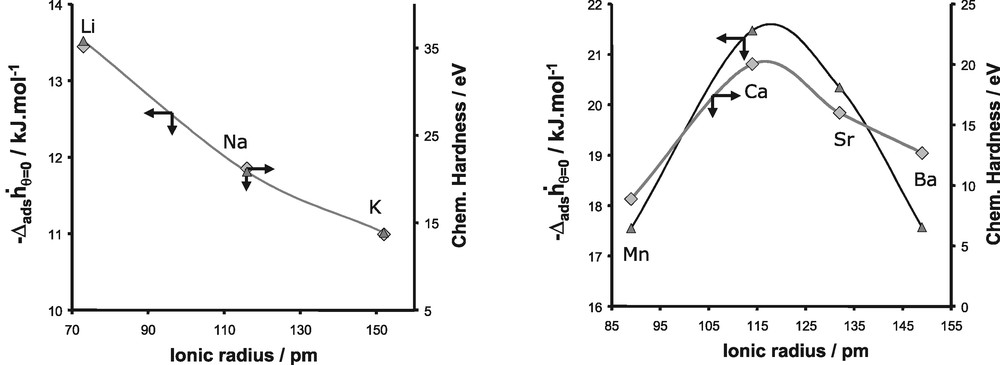
Evolution of the differential enthalpy of adsorption at zero coverage for argon and the chemical hardness as a function of the ionic radius for monovalent cations (left) and divalent cations (right).
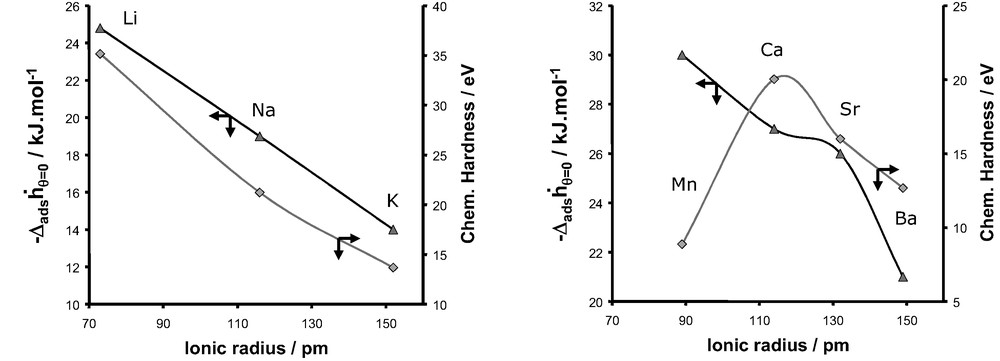
Evolution of the differential enthalpy of adsorption at zero coverage for nitrogen and the chemical hardness as a function of the ionic radius for monovalent cations (left) and divalent cations (right).
The values of the chemical hardness for both monovalent and divalent cations are given in Fig. 23 and are compared to the evolution of the differential enthalpy at zero coverage for the adsorption of argon. As we can observe, this atomic parameter increases from Li+ to K+ and exhibits a maximum for Ca2+ in the series of divalent cations. This evolution as a function of the nature of the cations is similar to the experimental trend of the differential enthalpy at low coverage observed for the adsorption of argon on both monovalent and divalent substituted X-faujasites. This similarity can be interpreted as a predominant contribution of the polarisation effect induced by the extra-framework cations, on the adsorption process of argon.
Fig. 24 compares the enthalpies of adsorption at zero coverage for the adsorption of nitrogen and the evolution of the chemical hardness as a function of the ionic radius of the cation. Whilst for the series of monovalent cations, a similar trend is observed, this is clearly not the case for the series of divalent cations. Thus the consideration of only the polarisation effect can not account for the evolution of observed experimentally for the adsorption of nitrogen in the various X-faujasites.
In the case of nitrogen the polarisation effect is accompanied by the interaction of the intrinsic quadrupole moment of the nitrogen with the adsorbent surface. Thus it is important to include this intrinsic property of nitrogen.
In addition to argon, the polar nitrogen, characterised by a permanent quadrupole moment (Θ = 4.7.10–40 C m–2) [68], can interact with the extra-framework cations via electrostatic contribution. This contribution can be reduced to:
| (11) |
This electrostatic contribution is reported in Fig. 25 for both monovalent and divalent cations.
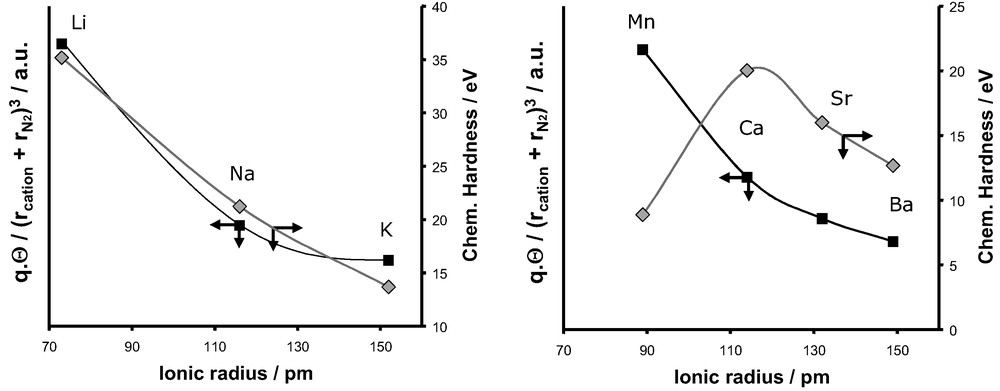
Evolution of the electrostatic energy and the chemical hardness and as a function of the ionic radius for monovalent cations (left) and divalent cations (right).
For the monovalent cations, a similar evolution with cation radius is observed for both the polarisation and electrostatic effects (Fig. 25). The experimental decrease of in the series LiX > NaX > KX can thus equally be interpreted on taking into account either or these both polarisation and electrostatic terms.
If we now consider the case of divalent cations, the addition of both electrostatic and polarisation effects is required to explain the evolution of the differential enthalpy of adsorption measured experimentally. This qualitative description given by our simple model is in agreement with recent simulation performed on Ca2+-chabazite [69]. This later study combining Monte Carlo simulations and sophisticated force fields showed that the analysis of the components of isosteric enthalpy of adsorption at low coverage gives almost equal polarisation and electrostatic contributions.
6 Conclusions
This review has outlined the possibilities of gas adsorption microcalorimetry in a number of areas:
- • Gas adsorption microcalorimetry in the region of 77 K is adapted for the characterisation of adsorbents. It can also be used, in conjunction with model adsorbents such as zeolites, for the study of the mechanisms and the phenomena that occur during adsorption. In such cases, additional complementary studies using structural methods (such as neutron diffraction) and computer simulation provide interesting and important insights to understand adsorption behaviour.
- • Gas adsorption microcalorimetry at ambient temperatures can be directly related to adsorption behaviour that occurs during applications such as storage and separation. Again, it is possible to use microcalorimetry to understand the phenomena in play and the comparison with others tools such as computer simulation is very rewarding.
Whilst computer simulation can lead to important insights into gas adsorption phenomena, the main challenge is to obtain transferable interatomic potentials that can easily be derived from standard values. One such possibility, for the case of the extra-framework compensation cations has been given here.
Finally, it has been shown how simple models can be used to understand the interactions of argon with the zeolites extra-framework cation in terms of polarisation effect. Nitrogen interactions with the compensation cations can be understood in terms of polarisation in addition to an electrostatic term that takes into account the permanent quadrupole moment of the nitrogen molecules.