

1 Introduction
Today metal-oxide semiconductors are the most promising materials for photoelectrochemical conversion of solar energy by the photoelectrolysis of water since the problem of the stability of photoelectrodes are basically solved only for such materials [1–4]. The efficiency of the processes that take place in photoelectrochemical cells is determined by the crystalline structure, bulk and surface properties of semiconductor photoelectrode, its corrosion resistance in aqueous electrolytes and ability to drive the water-splitting reaction, as well as by the structure and properties of the semiconductor–electrolyte interface. Such an interface is a rather complicated system, and despite numerous studies, it is not yet fully understood. Investigations of such two-phase interface properties and physical-chemical processes taking place at the interface play an important role both for fundamental analysis of these processes and in our understanding of the rather low efficiency for hydrogen production and to determine ways to improve the efficiency of photoelectrochemical conversion of solar energy up to the theoretically possible maximal values. Therefore, from this viewpoint, investigations of properties and structure of the two-phase interface by the method of the electrochemical impedance spectroscopy are very promising and informative [5–7].
Note that this method measures of the frequency dependences of the real and imaginary components of the complex impedance of the electrochemical cell. The analysis of these characteristics provides information about the structure of the electrical double layer at the semiconductor–electrolyte interface and the charge transfer processes in the semiconductor and electrolyte, as well as allowing to calculate parameters determining the limiting steps of the electrode processes.
The aim of this paper is the investigations of the metal oxide semiconductor–electrolyte interface structure using the technique of the impedance spectroscopy. We used as photoelectrodes, fabricated by us, polycrystalline samples of Fe1.99Sn0.01O3, Fe1.99Nb0.01O3, Fe1.8Nb0.2O3, and FeNbO4.
2 Experimental
Rhombohedral iron oxide (hematite, α-Fe2O3) was chosen as the starting material for manufacturing these polycrystalline photoelectrodes. Iron oxide (Fe2O3) is an insulator with specific electroconductivity of ~ 10−12 Ω−1 cm−1 at room temperature. The semiconductor phases are prepared by the doping of Fe2O3 with transition metal ions (Sn4+ or Nb5+). It is known that the levels of these ions are located above the level of iron ions [8]. Therefore, their introduction into the Fe2O3 lattice results in the change in part of Fe3+ ions to bivalent state. The existence in equivalent points of the lattice of the same element ions with different valences (Fe2+ and Fe3+) leads to the hopping mechanism of the conductivity. This is associated with electron exchange via thermal excitation between these ions.
For solid-phase reaction the corresponding amounts of starting oxides (Fe2O3, Nb2O5, SnO2) were mixed in high purity ethanol. After preliminary sintering in the air at 900 °C for 7 h the mixed powders were pressed into compact pellets. These pellets were then again sintered in air at temperatures of 1250–1300 °C. The time of synthesis was ~ 10 and 15 h for doping with Sn and Nb, respectively. The homogeneity of the sintered phases was measured by X-ray phase analysis. The results of these measurements showed that synthesized samples with concentrations of tin or niobium of 0.5 atomic percent are homogeneous and completely keep the iron oxide (hematite) structure, i.e. full dissolution of the doping element and the formation of a substitution solid solution takes place. The doped samples Fe1.99Sn0.01O3 and Fe1.99Nb0.01O3 were n-type and had specific electroconductivity of ~ 10−2 Ω−1 cm−1. The investigations of the temperature dependencies of the electroconductivity in the range of 77–500 K established that donor centers with an ionization energy of ~ 0.3–0.4 eV are formed by doping. The connecting of local pairs Fe+2–M+n with electrostatic forces played the role of donor centers in these compositions.
The solid solutions Fe1.8Nb0.2O3 and FeNbO4 were also synthesized by solid-phase reactions. For the synthesis of the solid solutions, consistent with the above approach, the same attempt to combine the best characteristics of each material is made: the good spectral characteristics of photoelectrodes Fe2O3 and the rather negative flat-band potential of Nb2O5 photoelectrodes. The initial ratios of components were taken to provide compositions of Fe1.8Nb0.2O3 (Fe2O3 + 10 at. % Nb) and FeNbO4 (Fe2O3 + 50 at. % Nb). After preliminary sintering in the air at 1000 °C for 5 h and thorough mixing in agate mortar, the compact pellets were then again sintered in air at temperatures of 1250 °C continuously during 24 h. We obtained a two-phase material at 10 at. % Nb. In the X-ray pattern all lines relating to α-Fe2O3 are present along with two additional lines relating to the FeNbO4 phase. The composition with 50 at. % Nb is phase homogeneous with the FeNbO4 structure. Additional lines connected with other phases are not observed in the X-ray pattern. The synthesized solid solutions Fe1.8Nb0.2O3 and FeNbO4 had specific electroconductivity of ~ 10−3 Ω−1 cm−1.
Photoelectrodes were prepared from the synthesized ceramics. Pellets were cut from the wafers with a thickness of ~ 1 mm and an area of ~ 0.25 cm2. Ohmic contacts were made by vacuum deposition of copper. An electric lead was soldered to the copper and covered with an epoxy adhesive.
The spectral characteristics of photoelectrodes were obtained by the measurement of the photoresponse from the ceramic photoelectrode placed in a homogeneous photoelectrochemical cell. The photoelectrode was illuminated with light from a high-pressure 1-kW xenon-lamp passing through a monochromator. The photoresponse was recorded on the recording instrument KSP-4. The investigation of the current–voltage characteristics of the photoelectrodes was carried out in the same photoelectrochemical cell.
Measurements of the frequency dependencies of the real and imaginary parts of the complex impedance of the electrochemical cell with the synthesized electrodes were carried out using a Solartron 1287 EI potentiostat and the 1260 FRA frequency response analyzer in conventional cell with a platinum counter-electrode and a saturated calomel reference electrode (SCE) in the dark. Investigations were carried out in 5 N NaOH aqueous electrolyte at different electrode potentials with a.c. amplitude of 7 mV. The frequency was varied between 0.1 and 3 × 10⁵ Hz.
The investigation of the photoelectrolysis current was carried out using from a 200-W mercury-lamp. The compartments of the photoelectrochemical cell were separated by the MF-4SK ion-exchanging membranes and filled with aqueous 5 N NaOH (anode) and 5 N H2SO4 (cathode) electrolyte, respectively. Platinum was used as counter-electrode.
3 Results and discussion
We used polycrystalline samples of Fe1.99Sn0.01O3, Fe1.99Nb0.01O3, Fe1.8Nb0.2O3, and FeNbO4 as semiconductor photoanodes. The photoelectrochemical characteristics of the photoelectrodes were investigated. The region of spectral photosensitivity for the electrodes made of solid solutions coincides with the region of spectral photosensitivity for doped photoelectrodes and covers the wavelengths spectrum from 270 to 670 nm. The peak sensitivity of photoelectrode FeNbO4 corresponds to ~ 390 nm (for doped photoelectrodes the photocurrent peak is between ~ 430 and 490 nm). Investigations of the inter-band phototransitions in the semiconductor near the fundamental absorption edge established that the main contribution to the photocurrent of doped photoelectrodes is given by two optical transitions with energies ~ 1.83 and 2.45 eV. Most probably, the first transition corresponds to the excitation of charge carriers between d → d states of iron ions, and second transition corresponds to the excitation between 2 p states of oxygen and 3 d states of iron. A hole is formed in the iron d states in the first case and in the oxygen valence band in the second case. The photocurrent for the FeNbO4 electrodes is also characterized by two indirect optical transitions. The threshold photon energies corresponding to these transitions are ~ 2 and 2.66 eV.
The anodic photocurrent onset potential (ϕ) of the photoelectrodes was determined from measurements of the current-voltage characteristics of photoelectrodes (Table 1). A noticeable shift of the flat-band potential to the negative direction took place for the FeNbO4 photoelectrodes; the photocurrent onset was observed at a more negative external bias.
Photocurrent and parameters of the high-frequency equivalent electrical circuit
| Electrodes composition | ϕ, V | Iph, mA cm–2 homogeneous cell, Ubias = 0.6 V | Iph, mA cm–2 heterogeneous cell | R0, Ω | C1 × 10−8, F | R1, Ω |
| Fe1.99Sn0.01O3 | –0.33 | 0.18 | 0.24 | 45 | 4.57 | 310 |
| Fe1.99Nb0.01O3 | –0.25 | 0.21 | 0.28 | 100 | 4.61 | 11060 |
| Fe1.8Nb0.2O3 | –0.35 | 0.35 | 0.41 | 80 | 7.04 | 4140 |
| FeNbO4 | –0.55 | 0.56 | 0.6 | 230 | 3.12 | 7280 |
As mentioned above, the measurements of frequency dependencies of the real (Z′) and imaginary (Z″) parts of the complex impedance of the electrochemical cell with the synthesized electrodes were carried out to investigate of the structure of the semiconductor–electrolyte interface. Some results of our measurements are presented in Fig. 1 in the form of the Nyquist plots.
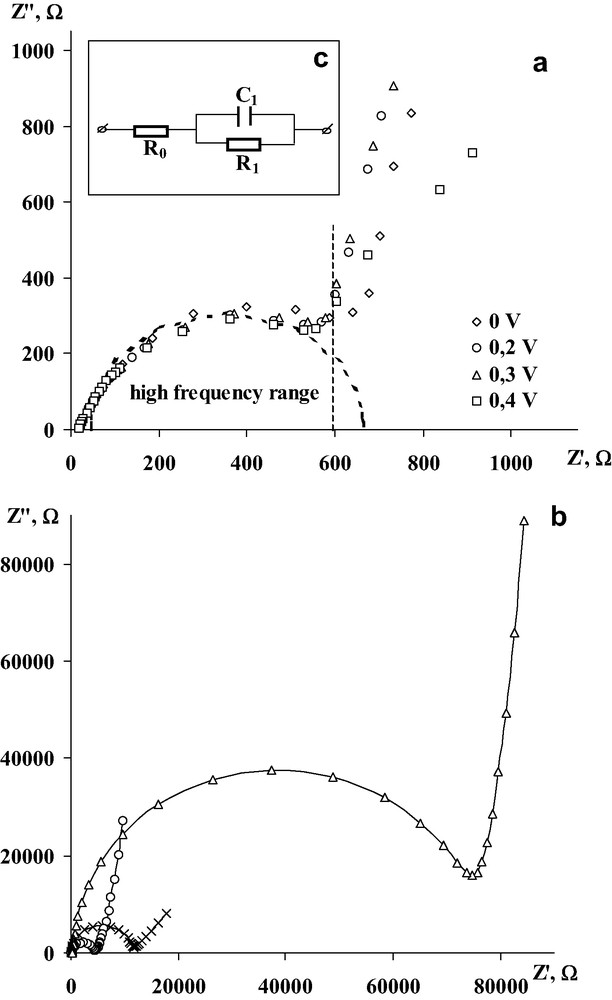
The Nyquist plots for the electrode Fe1.99Sn0.01O3 at different electrode potentials (a), Fe1.99Nb0.01O3 (×), Fe1.8Nb0.2O3 (○) and FeNbO4 (△) at the electrode potential 0 V vs. SCE (b); the equivalent circuit used for the modeling of the electrochemical cell in high frequency range (c).
For the analysis of the frequency dependence of the impedance, the simulation method of the electrochemical cells was used where the response of the cell is modeled by an equivalent circuit, which has a response to the external signal identical to the response of the electrochemical cell. Two possible approaches can be found in the literature. According to the first, an equivalent circuit comprising a capacitance, which simulates the semiconductor–electrolyte interfaces, and a resistance connected in parallel. The potential dependences of these elements are then calculated. The second approach involves a more complicated equivalent circuit for the electrochemical cell; however, the elements of this circuit are frequency independent. Both approaches have their advantages and disadvantages. In the first case, for example, difficulties in finding an adequate theoretical explanation for the frequency dependences were observed. In the second case, the difficulties lie in finding an equivalent circuit whose impedance is the closest to the one measured experimentally [9–13].
We follow the first methodology in our investigations. According to the generally accepted model, three ranges are selected in the frame of a double electrical layer formed on the semiconductor–electrolyte interface: the space-charge layer of the semiconductor; the diffuse ionic layer of the electrolyte (the Gouy layer); and the intermediate Helmholtz layer corresponding to one or two atomic layers. Therefore, the differential capacity of the semiconductor–electrolyte interface represents three capacities connected in series: the capacity of the space-charge layer of the semiconductor, the capacity of the Gouy layer and capacity of the Helmholtz layer. Practically, the main part of an interface potential occurs as an overall voltage drop in the space-charge layer of the semiconductor and as a result, the main contribution to their capacity comes from the capacity of the space-charge layer in the semiconductor. Therefore, for the elementary case, the equivalent electrical circuit of the electrochemical cell (Fig. 1c) consists of a resistance R0, characterizing the series-connected resistances of the electrolyte and the semiconductor's bulk, the capacitor, C1, appropriates capacity of the semiconductor's space-charge layer, and the resistance, R1, describing a stage of discharge–transport of charge carriers through the interface. The real and imaginary components of the complex impedance for such a circuit are calculated according to the formulas:
| (1) |
The majority of experimental impedance characteristics deviate from Eq. (1) at low frequencies. Such impedance characteristics testify that the signals in the external circuit do not only reflect properties of investigated semiconductor electrode. The simple circuit (Fig. 1c) is inadequate and should be supplemented with elements taking into account other factors, which influence the photoelectrolysis process. For example, often an RC circuit is added to the equivalent electrical circuit, take into account the effect of surface levels and the Helmholtz layer, as well as non-uniformity of doping, generation-recombination processes, etc.
To define the equivalent electrical circuit needed for the modeling of the behavior of the electrochemical cell in the low frequency range, the vectorial subtraction of the impedance of the circuit presented in Fig. 1c from the whole impedance is carried out. For electrodes made of solid solutions Fe1.8Nb0.2O3 and FeNbO4, the dependencies on frequency of the real component of the impedance remaining after vectorial subtraction (Z1′) are proportional to d/ω1/2. This dependence is typical for the Warburg impedance, which is connected with a slow diffusion processes. The values of the Warburg constant, d, was calculated from the slope of the straight line Z1′ = f(1/ω1/2). The frequency dependency of the imaginary component (Z2″) remaining after a second vectorial subtraction has a capacitive character. The value of the capacitance C0 was calculated from the slope of the straight lines Z2″ = f(1/ω). Thus, the electrochemical cell with the electrodes Fe1.8Nb0.2O3 or FeNbO4 is modeled by the equivalent electrical circuit represented in Fig. 2a at electrode potentials between 0 and 0.2 V vs. SCE. The physical meaning of the parameters R0, R1, C1 are mentioned above. The RwCw circuit corresponds to the Warburg diffusion impedance, and the capacity C0 is most probably connected with the presence of the Helmholtz layer. In this case, the main limiting steps of the electrode processes, which determine the electrode polarization and current, are the diffusion impedance and the large capacity connected with the presence of the Helmholtz layer.
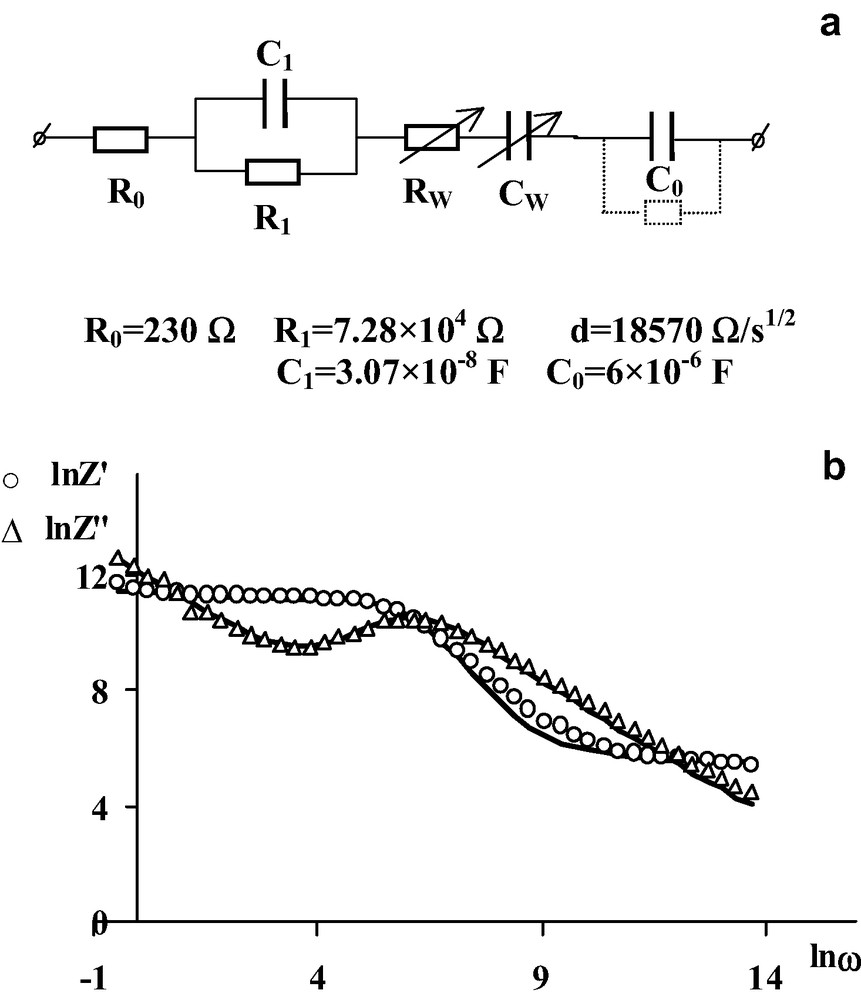
(a) The equivalent circuit used for the modeling of the electrochemical cell with the electrode FeNbO4 at the electrode potential 0.2 V vs. SCE. (b) Frequency dependencies for the real and imaginary components of the complex impedance of the electrochemical cell with the electrode FeNbO4 at an electrode potential of 0.2 V vs. SCE. Points are experimental data. Solid lines are fits to the theoretical curves calculated for the equivalent circuit shown in (a).
Similar analysis of the real and imaginary components of impedance has allowed the development of the equivalent electrical circuit, presented in Fig. 3a for electrodes made of doped Fe2O3. The appearance in the low frequency range of the frequency dependent resistance for the semiconductor's bulk, R = a/ω, is stipulated by the dispersion of conductivity, which is typical for oxides like Fe2O3 with the hopping mechanism for the electroconductivity. The equivalent electrical circuits proposed for the electrochemical cell with doped Fe1.99Sn0.01O3 and Fe1.99Nb0.01O3 electrodes indicate that the resistance of the semiconductor's bulk, the capacity connected with the Helmholtz layer, and slow diffusion supply of carriers to the electrode surface play a determining role for the electrode processes at the semiconductor–electrolyte interface. Results of the calculations of real and imaginary parts of the complex impedance for the proposed equivalent electrical circuit using obtained parameters of its components show the good fit of the calculations with the experimental data (Fig. 2b and Fig. 3b). Calculations of real and imaginary components were carried out according to the standard expressions given in [12].

(a) The equivalent circuit used for the modeling of the electrochemical cell with the electrode Fe1.99Nb0.01O3 at the electrode potential 0.2 V vs. SCE. (b) Frequency dependencies for the real and imaginary components of the complex impedance of the electrochemical cell with the electrode Fe1.99Nb0.01O3 at an electrode potential of 0.2 V vs. SCE. Points are experimental data. Solid lines are fits to the theoretical curves calculated for the equivalent circuit shown in (a).
Changes in the frequency dependencies of the impedance takes place with an increase in the electrode potential. The Nyquist plot consists of two semicircles, pointing to a model of the electrochemical cell with an equivalent circuit consisting of two series-connected RC circuits (Fig. 4). One of them, R1C1, characterizes the semiconductor's space-charge layer and contributes to the impedance in the high frequency range. The other circuit, R2C2, is most likely connected with the surface states, and the contribution of such circuit is exhibited in the low frequency range. Therefore, at electrode potentials more positive than 0.4 V vs. SCE, the process of the charging of surface levels in the low frequency range play determining role for the electrode processes at the semiconductor–electrolyte interface. It is confirmed by investigations of the dependence on applied external bias, which have shown that applied voltage is distributed between the semiconductor's space-charge layer and electrolyte and the change in the voltage drop in the semiconductor's space-charge layer is comparable with the voltage drop on the Helmholtz layer. The latter testifies to the presence of a high density of surface levels, the charge of which changes in the region of potentials investigated.

The Nyquist plots for the electrodes Fe1.99Nb0.01O3 (×), Fe1.8Nb0.2O3 (○) and FeNbO4 (△) at the electrode potential 0.6 V vs. SCE and the equivalent circuit used for the modeling of the electrochemical cell at large electrode potentials.
The results of the photocurrents measurements (Iph) are given in the Table 1. Photoelectrolysis takes place most efficiently with an external bias of 0.6 V in an aqueous solution of 5 N NaOH. The same was observed in a photoelectrochemical cell, when the anode and cathode compartments were filled with aqueous 5 N NaOH and 5 N H2SO4 electrolyte, respectively (difference pH = 13). The displacement of the flat-band potential to negative energies and the elimination also of limiting step, connecting the frequency dependence of the semiconductor's bulk resistance (the influence of this limitation is appreciable in the low frequency range ω → 0) lead to the expected increase in the photocurrent by a factor of two for photoelectrodes made of solid solutions Fe1.8Nb0.2O3 and FeNbO4. The rate of hydrogen evolution is ~ 15.3 and 22.4 μmole h–1 cm–2 for Fe1.8Nb0.2O3 and FeNbO4 photoelectrodes, respectively, at a difference pH = 13 between anode and cathode compartments of photoelectrochemical cell and under illumination by the 200-W mercury lamp.
4 Conclusion
Ceramic semiconductor photoelectrodes made up of n-type Fe2O3 doped with 0.5 at.% Sn or Nb and solid solutions Fe1.8Nb0.2O3 and FeNbO4 were synthesized. The electrophysical and photoelectrochemical characteristics of these photoelectrodes were investigated.
The structure of two-phase interface was studied using impedance spectroscopy. On the basis of the analysis of the frequency dispersion of the real and imaginary parts of the complex impedance, the equivalent circuit for the description of the structure of the double electrical layer on the semiconductor–electrolyte interface are proposed, its corresponding parameters were calculated and the limiting steps of the electrode process were determined.
For the Fe1.99Sn0.01O3 and Fe1.99Nb0.01O3 photoelectrodes, the dispersion of conductivity, slow diffusion of charge carriers to the electrode surface and large capacitance of the Helmholz layer are the main limiting factors for the electrode processes. For the Fe1.8Nb0.2O3, and FeNbO4 photoelectrodes, two limiting stages were established: the Warburg diffusion impedance and re-charged Helmholz layer.
The displacement of the flat-band potential to negative energies and removal of the limiting step linked to the dispersion of the semiconductor's bulk conductivity led to the increase in the photocurrent by a factor of two for photoelectrodes made of solid solutions FeNbO4, in comparison with photoelectrodes made up of doped Fe2O3.
Acknowledgements
These investigations were carried out in the framework of the ISTC A-322 grant and ANSEF grant N 04-PS-cheminorg-728-25.