

1 Introduction
Epoxy thermosets are key components for many polymer composites, coatings, paints, lacquers as well as for structural adhesives used in metal adhesive joints. Mainly, multifunctional amines are utilized as curing agent for the bi- or multifunctional epoxy resin. The kinetics of the hierarchy of possible reactions is not fully discovered but it is well-known from many previous studies (e.g., [1–4]) that the network formation in bulk is dominated in stoichiometric mixtures by the chemical reactions of epoxy groups (= oxirane rings) with primary and secondary amines (Eq. (1)).

The curing temperature ranges from room temperature (for aliphatic amines) to ca. 120–150 °C (aromatic amines) and up to some 180 °C (for some aromatic amines, dicyandiamide). The evolving hydroxyl groups may catalyse the amine reactions. Some authors assume a reaction of oxirane rings with the generated hydroxyl groups (Eq. (2)).

However, the reaction rate is much smaller than for the reactions (1). Other experimental studies even exclude reaction (2) for mixtures containing the stoichiometric quantity or an excess of amine hydrogen. As a fourth type of reaction, the ionic homopolymerisation of epoxy groups is discussed. It requires a Lewis base as a catalyst and the presence of hydroxyl groups that are capable to form a hydrogen bond with the oxirane ring. This reaction proceeds quite slowly even at elevated temperatures. Due to steric hindrance and low chemical activity, the tertiary amine and the hydroxyl groups produced in reactions (1) are expected to be not effective for the homopolymerisation.
A substrate or a filler is combined with the epoxy system in its liquid stage of curing. Here, the liquid epoxy mixture has to wet the solid partner, which shall be a metal in our case. Wetting is caused by elementary adhesion forces which act on quite a short range: a few nanometres for Van der Waals forces and just a few angstroms for any kind of chemical bonding. Much work has been spent on the measurement and on the quantitative description of these aspects of fundamental adhesion, but this task remains to be one of the most challenging of contemporary research. In thermosets, the description is complicated by the ongoing chemical reactions that change the organic adhesion partners continuously during the formation of the polymer network. For amine-based epoxies, the current state of knowledge on chemical adhesion mechanisms (e.g., [5–17]) can be briefly summarised as follows. Electron and IR spectra of adsorbed model molecules reveal that oxirane rings interact very weakly with many native metal surfaces. Similarly, the hydroxyl groups at the network chains show only poor reactivity with metal surfaces (Al, Fe, steel, Zn, Cu). For primary and secondary amine groups, the measurements indicate protonation of these soft Lewis bases from acidic OH-groups on the oxide surface. On the other hand, the lone electron pair at the N atom in all types of amine groups can act as an electron donor for metal atoms being in various states of oxidation. So far, it is not sure, however, which of these chemical interactions actually provide a strong and reliable adhesive bond between the epoxy network and the metal surface.
The role that the metal side plays in adhesion is even less understood. So-called ‘active surface sites’ are discussed as partners for interactions with the adhesive sites at the polymer chains but the very nature of these sites is hardly identified even for ideal surfaces of pure metals. An advanced description will have to regard the electronic structure of the surface region in detail, facing the complications that are introduced on most metals by the (hydr)oxide layers which are often amorphous. Moreover, such native metal surfaces are covered by a very thin carbonaceous layer that forms immediately and inevitably when the metal contacts atmosphere for the first time. The species are mostly hydrocarbons but in part they undergo specific chemical reactions with the metal oxide underneath. Any adhesive has to displace this contamination layer for strong bonding and hence difficult mechanisms of competitive adsorption, dissolution of the contaminants and related thermodynamics are involved in the formation of the adhesive contact.
In this paper, we will leave it at that and consider the consequences that the phase boundary per se and the adhesion mechanisms can have for the curing and for the resulting polymer network properties in epoxy-metal interphases. In the literature (see, e.g., [18–27]), these interphases are discussed to play a key role for the technical performance of a compound material. It will be shown that their physical and chemical properties can deviate considerably from the bulk.
2 Experimental
The study of polymer-metal interphases poses a number of difficult problems to the experimentalist. Most experimental techniques are unable to detect interphase processes or properties in a real material compound because the techniques either collect an integral signal from both the interphase and the bulk regions of the sample or they are sensitive only to the sample surface region. Specialized experiments like second harmonics spectroscopy or surface enhanced Raman spectroscopy need specific situations at the polymer-metal interface and quantitative spectra interpretation is still limited. Things become even more complicated for metal-polymer-metal sandwiches where the interphases are completely hidden by the metals. As a result, there are merely three alternatives for experimental access to such interphases:
- • investigation of fracture surfaces;
- • measurements at cross-sections;
- • studies on thin polymer films with varying thickness.
Each route has its own advantages and shortcomings. This paper refers to thin epoxy films on metal substrates and, in part, adhesive joints of the kind glass-epoxy-metal are studied. Starting with thick films, the spectra are dominated by the bulk-like fraction of the polymer. In thin films, we may expect the interphases to provide the main contribution to the measured signals. Two limiting aspects have to be observed for the thin film route, however. Firstly, the metal interface and the interface to the surrounding atmosphere will give rise to different interphases which will ‘overlap’ in very thin films. Secondly, some components could evaporate out of the film during preparation. Moreover, it should be kept in mind that the geometric confinement modifies per se the processes and structures in very thin polymer films.
Samples are studied by Fourier transform infrared reflection spectroscopy and by Brillouin spectroscopy (BS). In addition, our newly developed Brillouin microscopy (BM) provides the profile of the high-frequency elastic modulus across thick epoxy layers with a resolution of better than 10 μm.
2.1 Measuring techniques
In the epoxy bulk, chemistry is investigated by FTIR attenuated total reflection spectroscopy (ATR) as illustrated in Fig. 1a. The incident infrared light is totally reflected at the plane interface between the internal reflection element (IRE) and the sample.
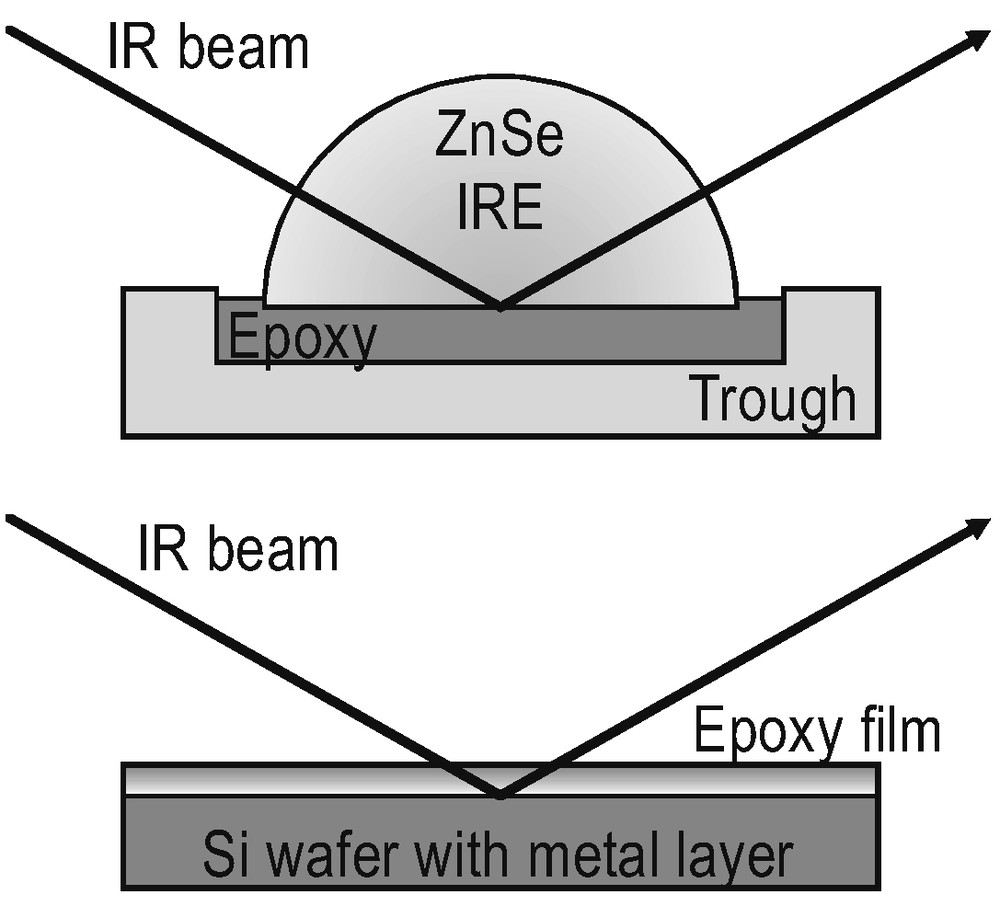
Optical situations for bulk (ATR, top) and thin film samples (ERAS, bottom).
A modest refractive index of the IRE (nZnSe = 2.43) and an incident angle of 60° (well above the critical angle of total reflection) are chosen for the s-polarised light in order to get a penetration depth of some microns. Hence, the spectra provide the bulk properties of the epoxy. Thin polymer films on metal substrates are evaluated by FTIR external reflection absorption spectroscopy (ERAS, Fig. 1b) with p-polarised light at 70° angle of incidence. Fig. 2a,b provides two spectra for illustration. In the case of ERAS, the light penetrates the polymer film and is reflected from the metal interface. The light undergoes partial reflection and refraction at the air interface (not shown in Fig. 1b). The multiple reflections and refractions produce an interference pattern that modulates the spectrum (see [28–30] for details). As a result, neither ATR spectra with ERA spectra nor ERA spectra from epoxy films of different thickness can be compared directly.
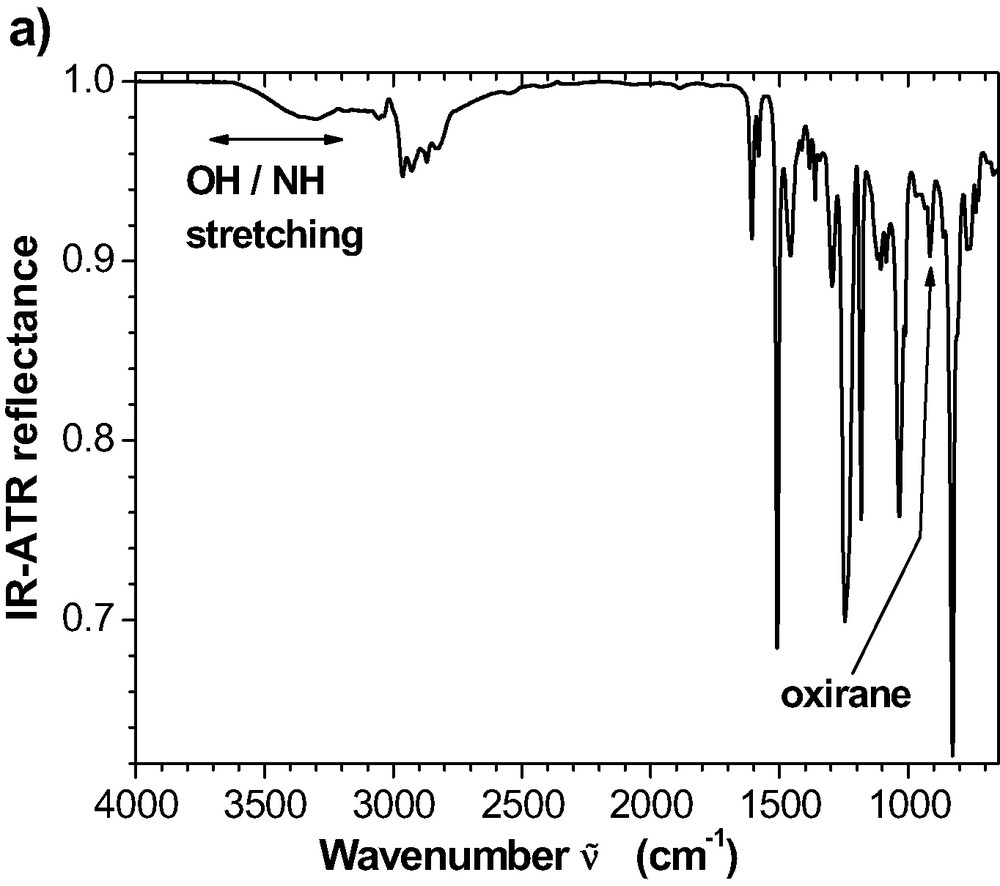
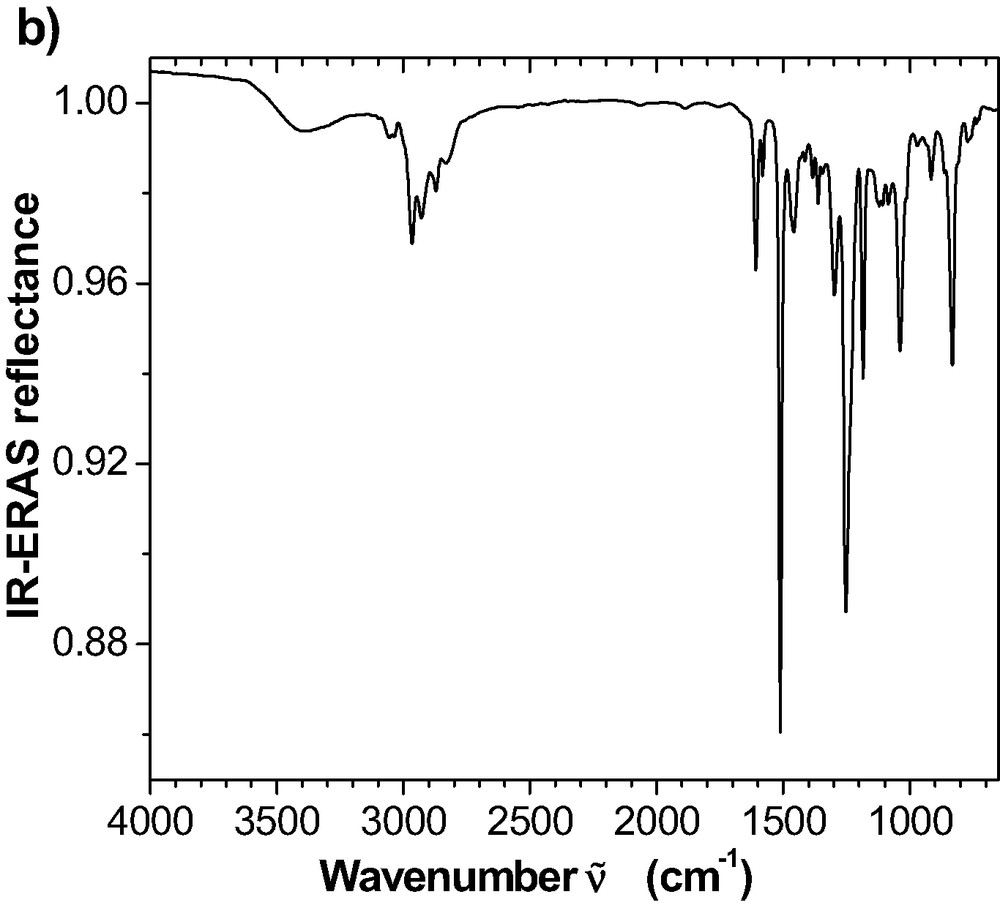
(a) ATR reflectance spectrum for the room temperature cured epoxy. Reflectance is calculated as the quotient of the ATR spectra from the interfaces IRE-epoxy and IRE-air, respectively. (b) External reflectance spectrum for 100-nm epoxy cured at room temperature for 72 h on an Al mirror. Reflectance is obtained as the quotient of the ERA spectra from the epoxy film on the Al and from the uncoated Al.
This problem of incomparability is solved in the following way (for the physics see, e.g., [28–31]). For the epoxy bulk, the optical function
Below 500 nm, is estimated by variable angle spectroscopic ellipsometry (VASE, angles of incidence: 65°, 70°, 75°). For thicker films, part of the polymer layer is removed from the substrate. The resulting step between coated and free substrate areas is evaporated with a thin, still reflecting Al-layer (ca. 50 nm). The step height is evaluated by white light interferometry (WLI). Such -data derived by VASE and WLI are not always very precise due to inhomogeneities in ultra-thin films and to some non-uniformity of thick epoxy layers. Therefore, IR spectroscopy and spectra calculation [30] were combined as a non-destructive technique to confirm the results of VASE and WLI. The method is based on a profound comparison of several band intensities (preferably phenylene ring stretching vibrations) in measured spectra and in calculated ‘bulk-like’ spectra with varying .
Brillouin spectroscopy (BS) is an optical method and can be used to study the propagation of hypersonic modes (GHz-range) in amorphous viscoelastic liquids and in polymer glasses. It is not necessary to generate these modes by external influences because the thermal fluctuations themselves result in density fluctuations that can be described as propagating hypersonic modes. In addition to the longitudinal mode, acoustic shear modes also propagate in a liquid provided that the shear viscosity becomes a frequency-clamped transport quantity for the high frequencies involved in BS (a static shear modulus does not exist, of course). In the isotropic bulk, the mechanical behaviour is described by two elastic stiffness coefficients, the longitudinal stiffness and the shear stiffness .
In the Brillouin experiment, some photons of the incident laser beam are scattered by the hypersonic modes in the transparent sample. The spectrum of the scattered light is analysed for a chosen scattering angle . The hypersonic modes are interpreted as acoustic phonons that interact with the photons of the laser light illuminating the sample (cf. [32]). Fig. 3 illustrates a scattering geometry that is useful to study transparent films on a reflecting substrate [33].
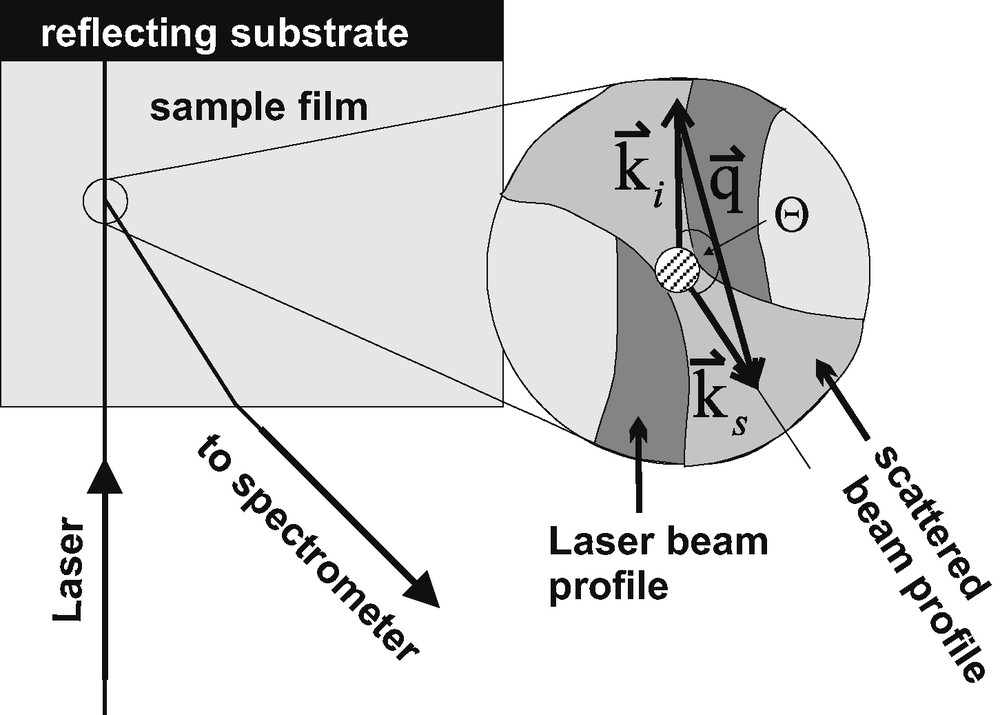
Typical scattering geometry for a transparent film on a reflecting substrate. , : wave vectors of the incident laser and the scattered light, respectively. : wave vector of the phonons involved in scattering. : scattering angle. Schematically, the insert depicts the zoomed cross-section of the region where the scattered light is collected by the spectrometer optics (light grey area) from the focussed incident laser beam (grey area). As indicated in the insert, the spectrometer optics possesses a sharp focus for Brillouin microscopy. Then, only a small part of scattered light (illustrated as a small hatched circle in the insert) is focussed to the spectrometer entrance.
As indicated in the insert of Fig. 3, momentum is conserved for the photons (, wave vectors for incident and scattered photons) interacting with longitudinally (L) and transverse (T) polarised phonons (wave vectors as selected by the angle ):
| (3) |
Energy conservation also holds for the scattering process
| (4) |
Fig. 4 depicts the schematic drawing for a Brillouin spectrum of an isotropic sample.
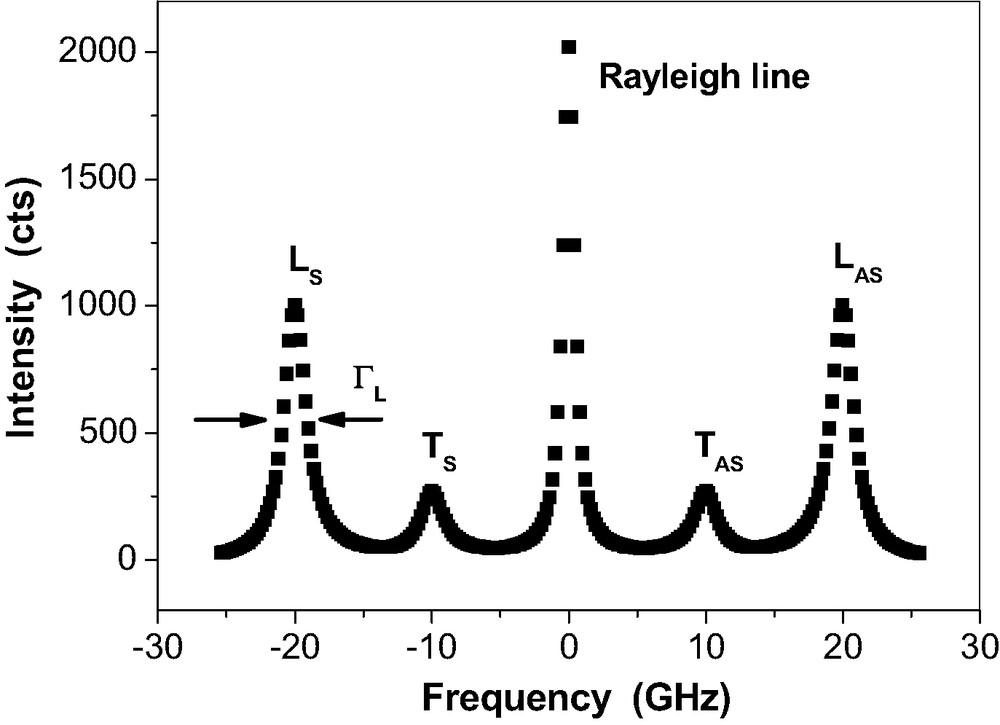
Schematic Brillouin spectrum of a bulk amorphous solid after deconvolution of the spectrometer profile. The Rayleigh line represents the elastically scattered light. LS, LAS: Stokes and Antistokes Brillouin lines of photons that are inelastically scattered at the longitudinally polarised acoustic phonon, TS, TAS: Stokes and Antistokes Brillouin lines of photons that are inelastically scattered at the transverse polarised acoustic phonon. The line widths result from the temporal attenuation of the L, T-phonon modes ( not shown).
The frequencies are found at the maximum of the Brillouin lines LS,AS and TS,AS. are the frequencies of the acoustic phonons that cause the light scattering according to eq. (4). The phase velocities of the acoustic phonon modes are calculated according to Eq. (5) from the phonon frequencies measured for the chosen
| (5) |
The elastic stiffness moduli are obtained by
| (6) |
So far it is assumed that all acoustic modes propagate in the plane wave limit and that . In thin films (thickness ) with or without substrate, the concept of plane waves fails and the phonons propagate as guided waves. Usually this yields a complicated acoustic mode spectrum. It can be interpreted quantitatively only in simple cases, e.g., for a homogeneous film with exactly known boundary conditions. In other cases, a qualitative interpretation can be given at least. Thus, the glass transition of a film can be deduced from the temperature dependence of the mode diagram.
2.2 Materials and sample preparation
The epoxy system consists of the diglycidyl ether of bisphenol A (DGEBA, DOW Plastics D.E.R. 332) with two oxirane rings and diethylene triamine (DETA, DOW Plastics D.E.H.) with five reactive hydrogen atoms in two primary and one secondary amine groups:

The mass ratio is chosen as DGEBA: DETA = 100: 14. This corresponds to a mixing ratio of 1 mol DGEBA on 0.462 mol DETA and hence to 1.155 mol amine hydrogen on 1 mol oxirane rings. The components are stirred in a closed glass vessel in the molten state at 55 °C for 5 min and cooled down to room temperature within about 1 min. Then, the mixture is transferred into a glove box for film preparation in CO2-reduced, dry air (dew point: –70 °C, residual CO2 content: ≤ 200–300 ppm). Bulk samples as well as epoxy films with dEP ≥ 3 μm are prepared by direct casting. Thin films with dEP ≤ 2 μm are obtained by spin coating from the appropriately diluted solution in methyl ethyl ketone (MEK). This solvent is chosen because it inhibits the curing reactions during the film preparation. In general, ketones are known to form imines by condensation with primary and secondary amines:

As illustrated by the infrared spectra in Fig. 5, MEK reacts slowly with DETA. For an arbitrary mixing ratio chosen in this test, chemical equilibrium is reached within about 30 min.
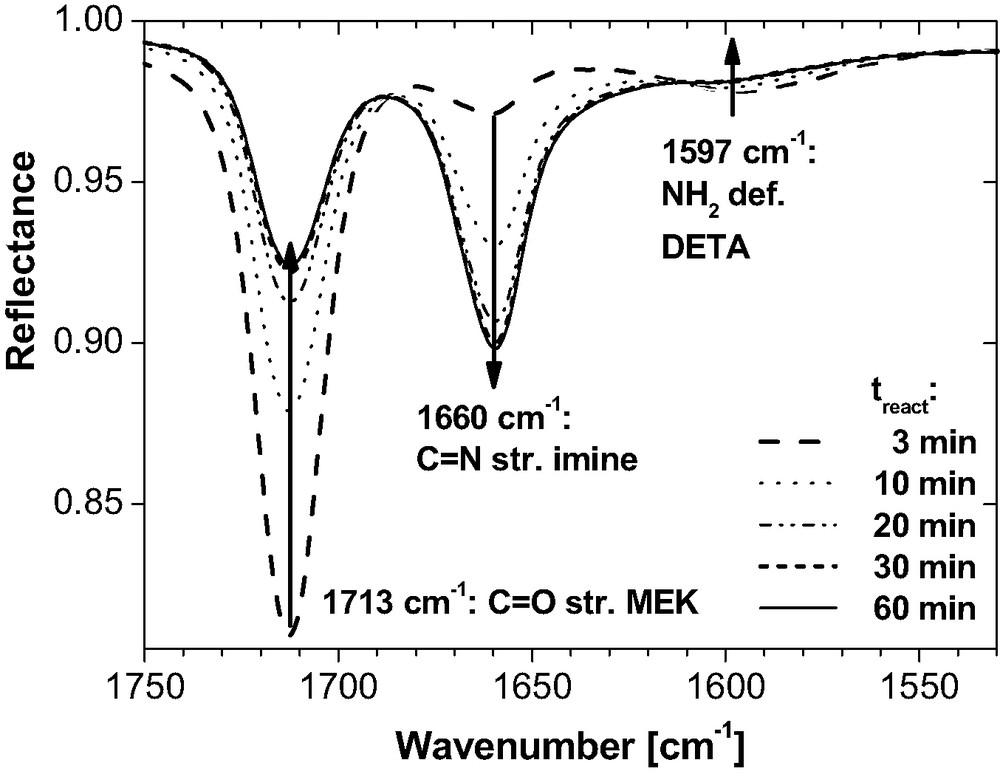
IR-ATR spectra for an arbitrary mixture of DETA (2 g) and MEK (3.8 ml) at room temperature as a function of reaction time treact after mixing. The decreasing bands at 1713 cm−1 and 1597 cm−1 as well as the growing band at 1660 cm−1 clearly depict the condensation of amine and ketone into imine.
The imine content can be increased by a growing MEK concentration or by removing water (as the co-product). Imine decomposes by removing MEK (e.g. in vacuum) or by addition of water. Reaction (8) is fully reversible. This is essential for the sample preparation from the diluted reactive epoxy system. MEK evaporates quickly from the spin coated layers. About 10 min after preparation, the IR bands of MEK disappeared from the thin film spectra (dEP ≤ 200 nm) and imine is not found in these films (Fig. 9 for example). Hence, the majority of imine molecules decomposed very quickly due to the evaporation of MEK and to the amine-epoxy polyaddition. The thicker layers lose the solvent almost completely within 72 h (Fig. 8) and very little imine is present in the IR spectra. Therefore we conclude that MEK does not possess a significant influence on the amine conversion in the epoxy films at room temperature (see Sections 3.1 and 3.2 for further evidence).
110-nm epoxy film on Al (ERAS, 70°, p-polarisation).
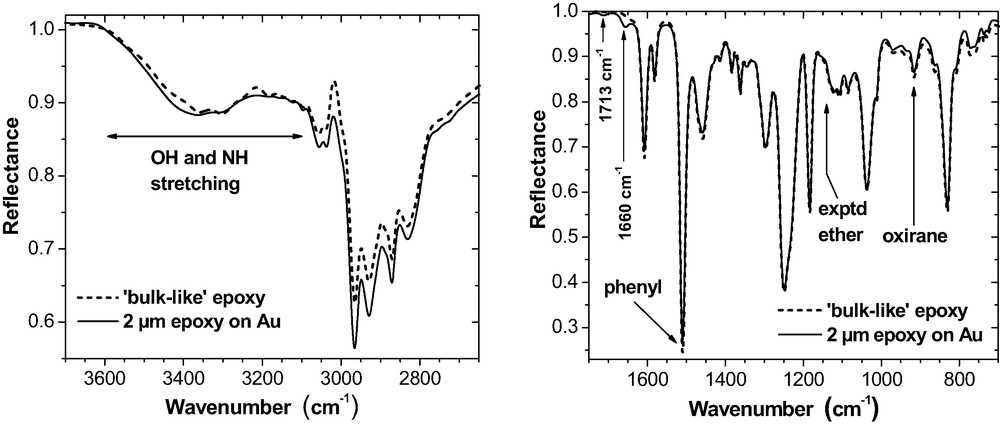
2-μm epoxy film on Au (ERAS, 70°, p-polarisation). The curves marked as ‘bulk-like’ always represent the epoxy consumption in case that the reactions would proceed in the thin films in the same way as in the bulk. Bands at 1713 cm−1 and 1660 cm−1 indicate traces of residual MEK and of imine.
The metal substrates are obtained by evaporation of ca. 100 nm of pure Al, Cu or Au onto Si (100) wafers. As shown by extensive surface analysis (XPS, Scanning Auger Microscopy, TOF-SIMS, AFM) [34,35], these native metal surfaces are extremely smooth (rms roughness < 1 nm) and the overall chemical state is reproducible within reasonable limits.
As a first curing step, the film specimens are stored in CO2-reduced, dry air at room temperature (RT, ca. 23 °C) for 72 h. Only in case that curing was monitored by IR and by BS spectroscopy, a short contact with ambient atmosphere was necessary for sample transfer into the spectrometer. After 72 h, the gross reaction rate is very low but the oxirane consumption is well below 100%. These ‘RT-cured’ samples are ready for investigation. An additional ‘post-curing’ step at 120 °C in argon for 1 h provides complete oxirane consumption in the bulk. Post-cured epoxy films are also characterised.
All steps of the preparation regime must obey an exact timing and well-defined conditions concerning temperatures and ambient atmosphere.
3 Results and discussion
The curing process at room temperature as well as the chemical and mechanical state are studied in RT-cured and post-cured epoxy layers on Au, Al and Cu and compared with the corresponding bulk. The gross chemical reaction and the resulting chemical states are characterised by the FTIR spectroscopic techniques described above. The mechanical stiffness at hypersonic frequencies is measured by Brillouin spectroscopy and microscopy.
3.1 Curing at room temperature
The chemical kinetics of room temperature curing is followed in situ by IR-ATR spectroscopy for the bulk and by IR-ERAS for epoxy films on the Al substrate (Fig. 2 as an example for the spectra). Neither the amine bands nor the hydroxyl bands are suited for a quantitative analysis because they overlap strongly with each other (NH and OH stretching region) or with other bands (e.g., NH2 deformation at ca. 1597 cm−1) in the mid IR range. As a quantitative measure, the spectroscopic degree of epoxy consumption can be calculated from the normalised band intensity I915, norm (peak height) of the oxirane stretching vibration at 915 cm−1:
| (9) |
The phenylene ring stretching vibration at 1510 cm−1 serves as internal standard. In eq. (9), the band intensities also depend on the respective extinction coefficients. Therefore, is not a priori identical with the chemical consumption. Fig. 6 depicts and the corresponding spectroscopic reaction rate for a couple of layers on Al. Additionally, the reference curves (marked as ‘bulk-like’) are presented for each epoxy thickness. These reference curves are obtained from the ‘bulk-like’ ERA spectra that are calculated for the given from the optical function of the epoxy bulk and other parameters of the thin film sample as described in Section 2.1.
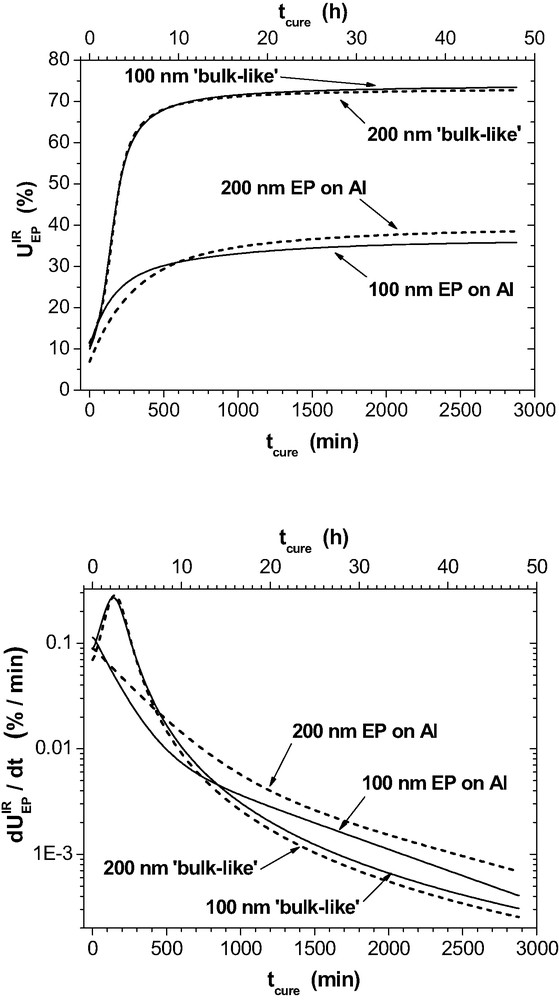
Spectroscopic epoxy consumption and corresponding rate as determined by IR-ERAS for 100 nm (___) and 200 nm epoxy (---) on Al (for the first 48 h of RT-curing). The reference curves (marked as ‘bulk-like’) represent and in case that the reactions would proceed in the thin films as in the bulk.
The ‘bulk-like’ curves are very similar in both plots. The small differences are due to the influence of on the IR-ERA spectra (interference of the IR light) which is very weak in the range of 100–200 nm. In the initial stage of curing, the slight s-shape in and the corresponding maximum in the rate for the ‘bulk-like’ curves confirm a weak auto-acceleration of the chemical reactions. Such an effect has been reported in the literature. It is attributed to the auto-catalytic influence of the hydroxyl and tertiary amine groups in the forming epoxy polymer – cf. eqs. (1, 2). reaches 73% as the final value for RT-curing in the ‘bulk-like’ curves.
The real thin layers are different. The auto-catalytic effect is not observed in the initial reaction stage and hence the initial gross reaction rates are slower than in the bulk. After 48 h, the remaining reaction rates are small but significantly higher than in the bulk. The most striking difference appears for the final values of in the real samples. It reaches only 38% and 36% in the 200-nm and the 100-nm layers, respectively, instead of the 73% that should be obtained in the case that the chemical reactions would have proceeded as in the bulk. A lack of amine groups owing to the formation of imine with MEK is not the reason for the low oxirane conversion because no imine band is found in the IR spectra of such thin films (Fig. 9). Hence, the chemical kinetics of oxirane conversion requires more time with decreasing epoxy thickness.
Curing-induced changes of the mechanical properties are depicted by the phonon frequencies as measured by BS. These samples were in contact with air inside the thermostat of the spectrometer at 298 K. Some of our results indicate that the measuring atmosphere (contents of water and CO2) influences the curing to some extent. Therefore, the BS results on curing should be related only in a qualitative manner with the IR spectroscopic data given above. Fig. 7 provides the curves for the bulk and for 200 nm epoxy on Al as an example. In the bulk, the phonons propagate as plane waves but in thin films they form guided waves with complexly shaped wave fronts. Therefore, only the development of with may be compared.
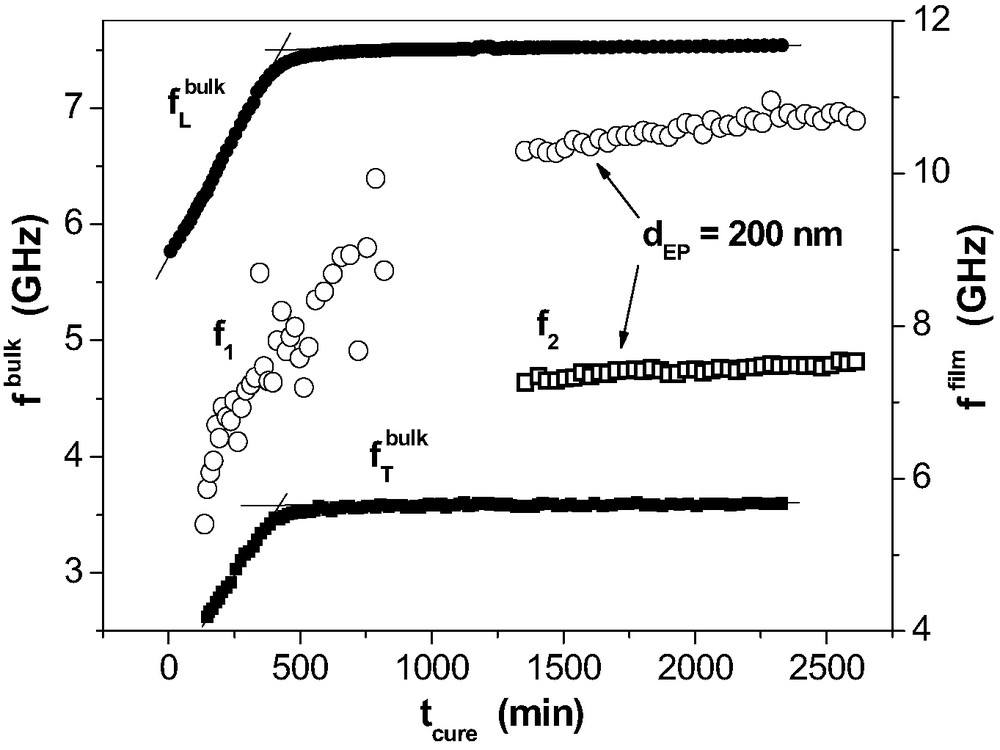
Phonon frequencies as a function of curing time tcure for the bulk (longitudinal (●) and transverse (■) phonon) and in a 200-nm epoxy layer on Al. For the thin film, the frequencies for the two strongest phonons (f1: ◯, f2: □) of the guided waves are depicted.
All functions grow as it is expected for the ongoing network formation in the bulk and in the film as well. For the longitudinal bulk phonon, goes up steeply within the first 6 h. As for the spectroscopic epoxy consumption in Fig. 6, the curve possesses a weak s-shape at this stage. It levels after ca. 9 h. In the layer, only one broad guided wave phonon at f1 is observed in the initial stage of curing. That phonon possesses an average longitudinal polarisation. f1 rises strongly for at least 12 h. Then, it does not level but continues to increase weakly until the end of the measurement (48 h). Hence, progress of chemical reactions is much slower than in the bulk and it does not cease within two days. The transverse bulk phonon at belongs to the shear wave. Therefore, the increase of monitors the solidification in the bulk which almost levels after about 9 h. In the thin film, it takes about 22 h before three more phonons are observed in addition to in the Brillouin spectrum. The strongest one at is shown in Fig. 7. The average polarisation of the -phonon resembles very much a transverse wave. Therefore, its appearance indicates that there is a liquid-solid transition in the thin epoxy films but it is much delayed in comparison to the bulk.
In conclusion, room temperature curing is hampered in thin epoxy films. The BS provides first hints on network structures with a polymer dynamics that is different from the bulk.
3.2 Properties of the RT-cured films
As discussed in Section 3.1, the curing reactions have virtually stopped in the epoxy samples after 72 h. For the bulk network, it is well established that this stop results from the vitrification which is caused by the curing itself. Gravimetric measurements show that small bulk samples (< 10 mg) lose just about 1% of their mass during RT-curing due to evaporation of DETA [36]. Even with this loss of hardener, an excess of 1.072 mol amine hydrogen on 1 mol oxirane rings remains. One could suspect for the thin films, however, that more DETA might evaporate due to the higher surface-volume-ratio and less amine hydrogen would be available than in the bulk samples. As a precaution, the epoxy mixture is pre-cured at room temperature for 1 h prior to the preparation of the films considered now. During that pre-curing step, about 18% of the oxirane groups are consumed. Assuming a reactivity ratio of 2.5:1 for primary and secondary amine hydrogen, it is estimated by a simple Monte-Carlo simulation that ca. 60% of the DETA molecules formed oligomers at this stage of reaction. The tests with other reactivity ratios show that the percentage of oligomerised DETA does not change dramatically – a ratio of 1:1 results in about 80%. Experiments prove that oligomers do not evaporate at moderate temperatures. Additional arguments against the evaporation hypothesis will be given below for our samples.
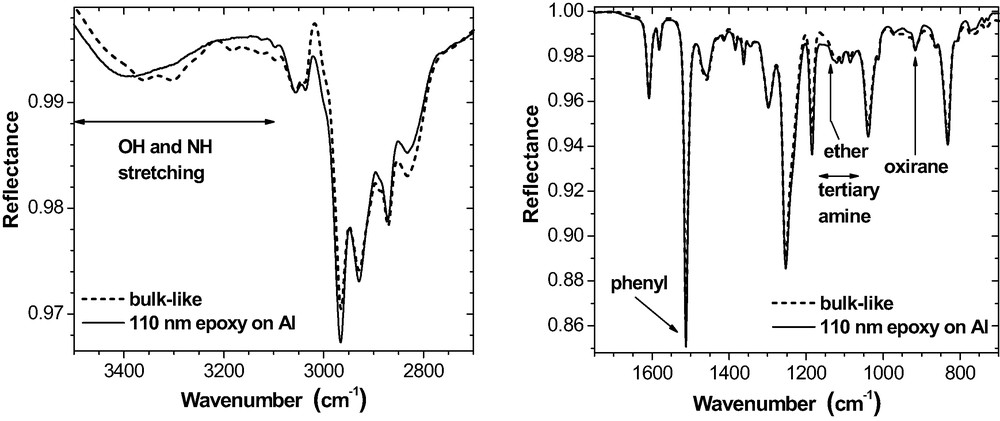
We start with an analysis of the IR-ERA spectra in order to compare the chemical state of the films (20 nm ≤ dEP ≤ 2 μm) on the three metal substrates. As mentioned in Sect. 2.1, reference to the bulk is made by using ‘bulk-like’ ERA spectra that are calculated for the given experimental conditions with the measured optical function of the RT-cured epoxy bulk. Apart from a small excess of residual oxirane, the chemical state of thick epoxy layers on all metals corresponds very well to the bulk – see Fig. 8 for example. In particular, no specific ether band is observed (asymmetric stretching at ca. 1140 cm−1) where the intensity should be higher if the metal surfaces would have stimulated the reaction of oxirane with hydroxyl groups (cf. eq. (2)).
Thin films like 110 nm epoxy on Al (Fig. 9), contain some more residual oxirane groups than the bulk. Hence, the curing reached a lower level. Again, no ether band is observed at 1140 cm−1. This indicates that the oxirane-hydroxyl reaction does not take place during RT-curing. Instead, in the region between 1150 and 1060 cm−1 where lattice vibrations of the tertiary amines are involved, the spectral intensity is somewhat lower for the 110-nm sample than for the corresponding ‘bulk-like’ spectrum. In accordance with the reduced oxirane consumption in the real thin film, this is explained by a lower content of tertiary amine groups that have weak bands in this frequency range.
Fig. 10 summarises the data for the IR-spectroscopic degree of oxirane consumption in the epoxy films on the three metals after 72 h cure at room temperature.
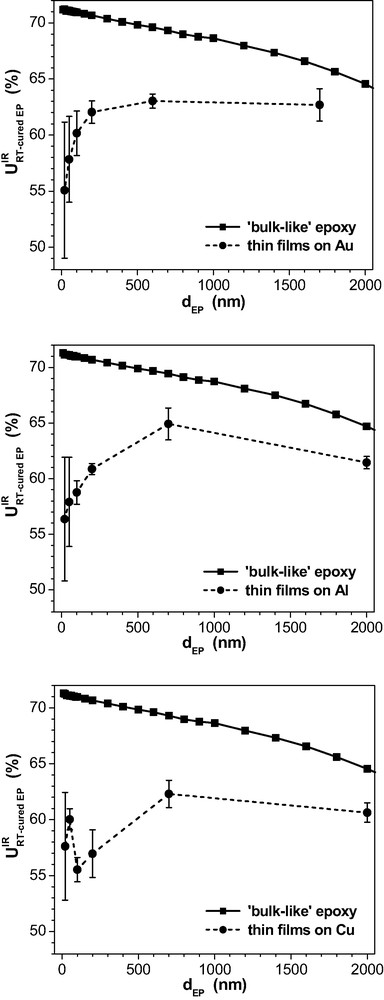
as a function of epoxy thickness on Al, Cu, Au after RT-curing.
Although the residual oxirane content in the bulk is constant after the RT-curing from the chemical point of view, the three ‘bulk-like’ curves for the spectroscopic final consumption depend on in Fig. 10. This illustrates how the interference pattern modifies the IR-ERA spectra of thin films.
In the real layers on the three metal substrates, the -data fall more and more behind the expected bulk value with decreasing . This behaviour proves once more that a MEK-amine condensation (cf. reaction in eq. (8)) does not explain the reduced oxirane consumption in thin spin coating films. The content of residual imine tends to grow with and hence should go down for the thicker layers but it approaches the oxirane consumption in the solvent-free bulk. In the second place, the curves for seem to support the DETA evaporation hypothesis: The thinner the film the stronger the effects caused by evaporation of DETA. Hence, the oxirane consumption would go down with as well. Things are not that simple, however. In the thin films made from pre-cured epoxy, the level of oxirane consumption after RT-curing is higher (e.g., = 59% and = 61% on Al, see Fig. 10) than in the thin films prepared from the freshly mixed epoxy (36% and 38%, respectively, cf. Sect. 3.1, Fig. 6). Hence, some material may have evaporated during the measurement of reaction kinetics in films made of freshly prepared epoxy. Moreover, we have strong evidence that water vapour and CO2 in environmental air have an essential impact on the evaporation mechanism of DETA and therefore on the final degree of cure. But for the epoxy films made of pre-cured material, the following experiment proved that evaporation is negligible in dry atmosphere. Such a film ( ≈ 100 μm) was prepared by the Doctor's blade technique in argon atmosphere on a Cu substrate. Another Cu substrate was placed 1.5 mm above this sample forming a sealed compartment. The temperature was kept constant at 25 °C for the curing sample while the upper Cu substrate was cooled by a Peltier element. After about 2 h of curing, the upper Cu substrate is transferred into the IR spectrometer without contact to ambient air and an ERA spectrum is taken. Within the limits of spectroscopic sensitivity, no adsorption products were detected on the Cu mirror. Since DETA undergoes chemisorption on copper (see below) this result proves that amine does not evaporate significantly out of films made of pre-cured material under the given conditions.
Additionally, it can be seen in Fig. 10 from the data for the thinnest films that the depend on the kind of metal surface. reaches only ca. 55% on Au and Al while it is about 58% at the Cu substrate. With increasing thickness, rises stronger on Au than on Al. On Cu, the situation differs in another aspect: is no longer a monotonous function but has a minimum in the 100-nm layers. Near to the copper oxide, the oxirane consumption rises again. Such a minimum cannot be explained by DETA evaporation but it can result from a catalytic effect of the copper substrate on network formation.
Summing up, the observed -data are influenced by the metal substrates that impede the curing reactions. It is surprising that this reduced oxirane consumption does not confine to the vicinity of the substrate but it extends some micrometers into the epoxy. That can hardly be explained by DETA adhesion to the metal surfaces because the surface area would not accommodate so many molecules, even for a closely packed monolayer. On the other hand, each phase boundary modifies the thermodynamic potential and this could provoke special processes of structure formation of an interphase on the local scale. We presume that the components of the epoxy system undergo segregation or even some kind of phase separation while the thin films are in the liquid state. These processes are stimulated by the metal substrates, probably in conjunction with a latent incompatibility of the components in the reacting system. We showed in previous studies [37,38] that the DGEBA-DETA system can develop inhomogeneities in the bulk.
Otherwise, shape and structure of the thin film spectra on Au or on Al are similar to the ‘bulk-like’ spectra (Fig. 9). The three little peaks on the broad OH stretching band in the ‘bulk-like’ spectra represent NH stretching modes. Their intensity is overrated by the spectra simulation. It should be noted, however, that Roche et al. [39] report on Al complexes formed by amine compounds in the epoxy on native Al substrates. On Cu (Fig. 11), massive deviations from the bulk arise in the OH and NH stretching region (3600–3100 cm−1). The bands possess quite a different shape and position. For the phenylene ring stretching doublet (1610 and 1580 cm−1), the intensity increased considerably but the phenylene band at 1510 cm−1 does not change. Additionally, a new band appears at about 1390 cm−1.
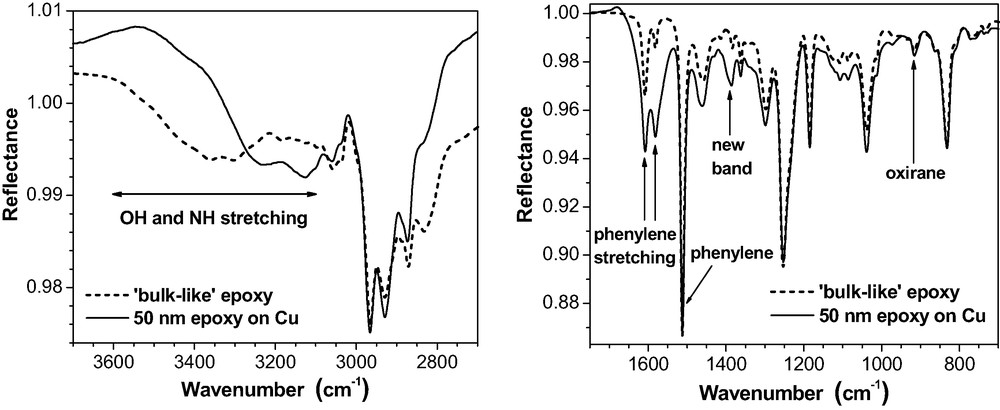
50 nm epoxy film on Cu (ERAS, 80°, p-polarisation) as compared with a ‘bulk-like’ epoxy layer of the same thickness on the same substrate.
Hence, the chemical state in the epoxy must have been considerably modified by the copper surface during the RT-curing. Fig. 12 gives evidence that DETA forms a complex with the Cu substrate.
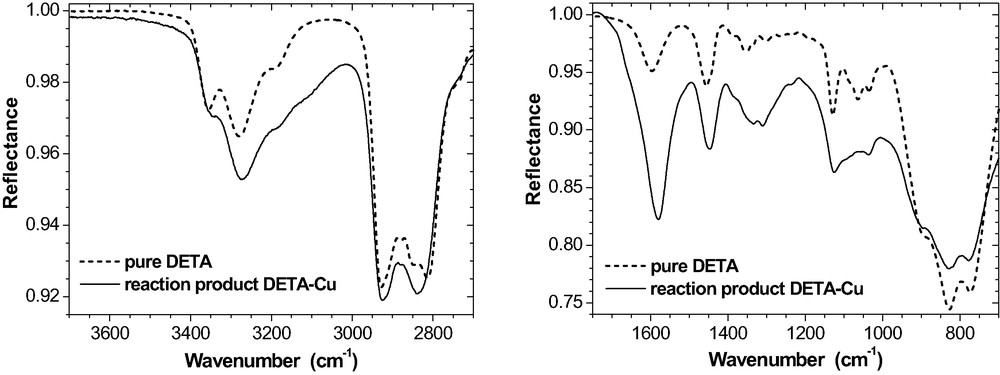
IR spectra of pure DETA and of the reaction product of DETA with the Cu substrate (ATR, 60°, s-polarisation).
As a consequence of this interaction, amine band intensities altered considerably, in particular within the spectral regions of 3000 – 3400 cm−1 (NH stretching vibrations) and 1600 cm−1 (NH2 deformation). As shown in Fig. 11, these specific spectral features are also present in ultra-thin epoxy films on Cu. Recently, Cu2+ ions have been detected by XPS and TOF-SIMS in such films and in real adhesive joints epoxy-copper [35]. Hence, a Cu-DETA complexation takes place in the epoxy interphase on copper. DETA literally dissolves the copper hydroxide on the Cu substrate. This process explains why the OH stretching intensity (3600–3200 cm−1) is significantly reduced (Fig. 11). It is important to note that these effects are observed on copper only. In our case, their intensity is moderate because the uncoated Cu substrates were stored in dry air (cf. also the band shape at 1600 cm−1 in Fig. 19). They increase considerably on Cu substrates that were stored under environmental conditions (i.e. humid air).
IR bands at ca. 1660 cm−1 and 1738 cm−1 in 50-nm epoxy on Al, Cu and Au prior and after post-curing (ERAS, 70°, p-polarisation).
As discussed above, the incomplete chemical conversion of oxirane groups could be related to some heterogeneity in the epoxy films. The lateral variation of mechanical film properties is obtained by a sequence of locally measured Brillouin spectra. Resolution is determined by the diameter of the laser beam (ca. 10 μm). As an example, Fig. 13 depicts a selection of results for the longitudinal phonon in thick films that are beyond the guided wave limit. The propagation of these plane sound waves does not depend on but it is only a function of the elastic properties of the epoxy network. Hence the local frequency values depict the variations of the elastic stiffness and density.
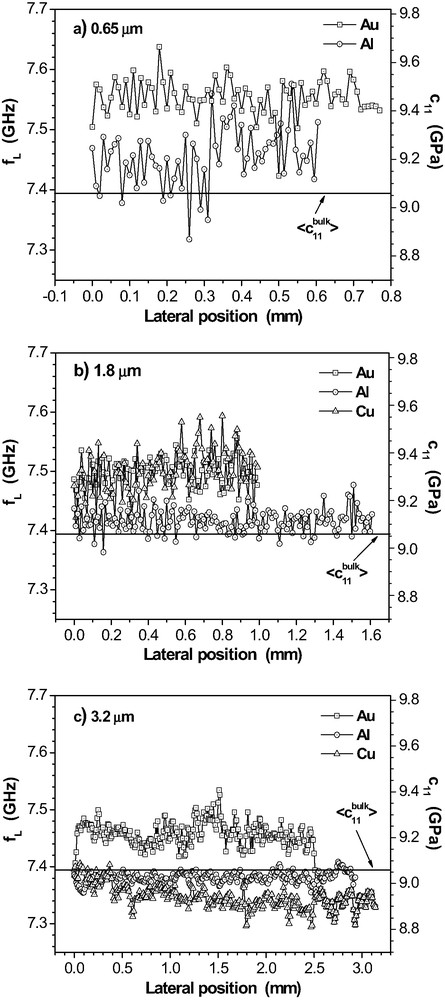
Lateral variation of the longitudinal sound mode frequency and the longitudinal stiffness coefficient in epoxy films on Au, Al and Cu after RT-cure. (a) = 0.65 μm, (b) 1.8 μm, (c) 3.2 μm. is the mean value for bulk samples.
The high-frequency elastic stiffness coefficient on the right ordinate in Fig. 13 is calculated by
| (10) |
With the measured variations of and , the influence of dominates the local variation of in general. Hence, the measured frequency variations are mainly caused by the local elastic properties of the epoxy films that vary on the sub-mm scale. This result supports the view that the epoxy films are inhomogeneous.
Table 1 summarises the average values for each layer along the lateral traces given in Fig. 13.
Lateral average data (GPa) as derived from the frequencies of the longitudinal mode in RT-cured epoxy films on Au, Al and Cu
| 0.65 ± 0.05 μm | 1.8 ± 0.2 μm | 3.2 ± 0.2 μm | |
| on Au | 9.45 ± 0.07 | 9.31 ± 0.06 | 9.15 ± 0.14 |
| on Al | 9.20 ± 0.12 | 9.11 ± 0.05 | 9.02 ± 0.04 |
| on Cu | not measured | 9.31 ± 0.09 | 8.94 ± 0.06 |
For the 3.2 μm-layers, the -data correspond to the mean bulk value = 9.1 ± 0.3 GPa. We note that the relatively big experimental error of is due to the averaging over an ensemble of bulk samples that were prepared at differing room temperatures within a period of more than one year. The error of is significantly smaller because it refers to lateral variations of on a given sample. Therefore, it is significant that tends to increase with decreasing epoxy thickness in the considered -range for each metal. This seems to be surprising in view of the inverse trend found for the oxirane consumption. However, the mechanical properties of polymer films are influenced by the interfaces to the substrate and to the atmosphere. Both effects are not present in the bulk. The epoxy adheres to the rigid metal substrate which causes a stiffening effect on the polymer in a relevant gradient layer. The free surface could have the opposite effect. In these Brillouin measurements, the scattering volume extends over the whole thickness of the films. Hence, the decreasing function indicates that the adhesive interphase causes on average a dominant stiffening even for the 0.65-μm films.
Fig. 14 provides the lateral frequency variations for three guided sound waves observed in a RT-cured 200-nm epoxy film on Al. Hence, cannot be easily determined. All phonons show a simultaneous pattern of frequency variation. The vary locally by ± 150 MHz at maximum () around their mean values. This is in the same range as for the plane waves in the thick films. Therefore, the slight local variations of (as observed by SFM) do not dominate the -variations. The thin epoxy film possesses a significant lateral inhomogeneity in terms of high-frequency elastic properties on the sub-mm scale.
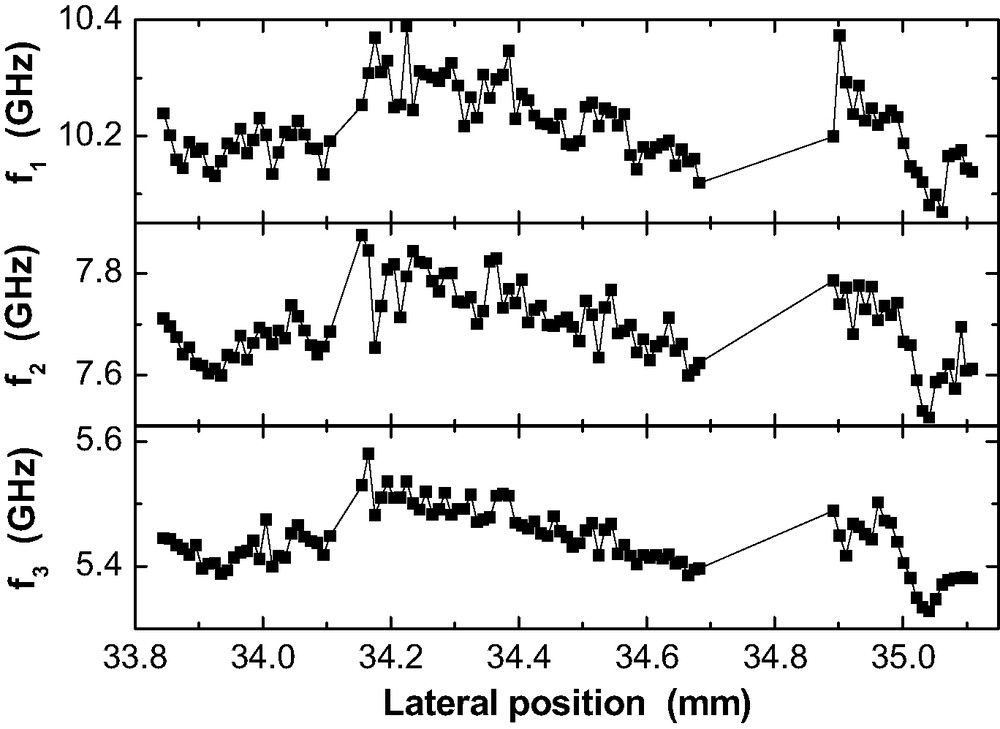
Lateral variation of the guided sound mode frequencies in a 200 nm epoxy film on Al after RT-cure.
The Brillouin frequencies reveal a remarkable dependence of the glass transition temperature on for the RT-cured films. For these measurements, the position of the scattering volume is chosen randomly. The laser beam is defocussed to 50-μm diameter. The specimen is cooled down to low temperature (e.g., 110 K). Then, after stepwise heating, the spectra are recorded isothermally at subsequent temperatures. The are depicted as a function of temperature – see Fig. 15 for an example.
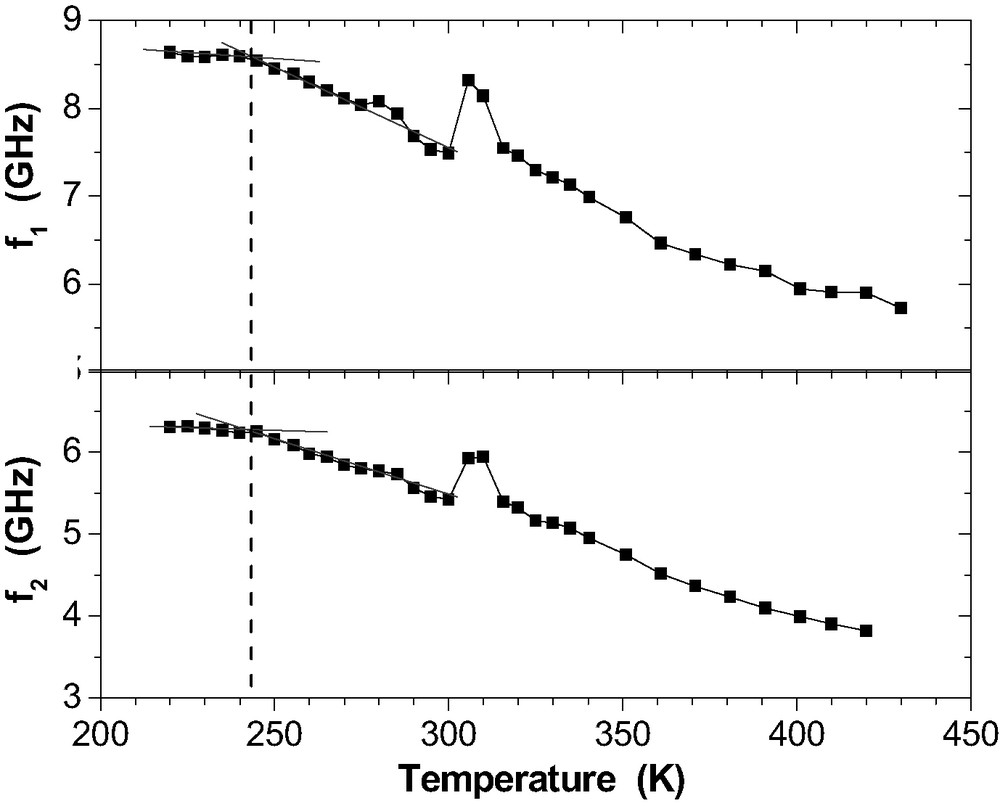
Phonon frequencies and for the guided sound waves as a function of temperature in a 200-nm epoxy film on Al after RT-curing. is marked by the dashed line.
Coming from low temperature, the curves show a simultaneous kink that marks the static glass transition temperature in the polymer film [32]. Above 300 K, all frequencies start growing. That corresponds to a rising mechanical modulus due to the re-activated curing reactions. This curing finished at about 325 K. The temperature range is so small because of the long acquisition time at each isothermal step. The upward curvature in between 360–420 K indicates the termination of the structural glass relaxation process.
Table 2 summarises the static glass transition temperatures on Au, Al and Cu as measured at randomly chosen spots on the samples.
Static glass temperature in RT-cured epoxy films on Al and Cu. For comparison, the bulk is given according to a temperature-modulated DSC measurement
| on Au | on Al | on Cu | in bulk | |
| 235 ± 16 nm | 265 K | 243 K | 274 K | 326 K |
| 1.4 ± 0.2 μm | 292 K | 262 K | 286 K | |
| 5.7 ± 0.2 μma | 301 K | 275 K | 286 K |
a Epoxy not pre-polymerised for reasons of viscosity.
On all metals, the data reveal a pronounced decline of with although the positions for the scattering volume were not allocated to a particular feature in the laterally varying stiffness. Most samples even do not vitrify during RT-curing. These epoxy layers remain in the viscoelastic state at room temperature although the chemical reactions have almost stopped. This result is in contrast to the bulk where the curing rate slows down by many orders of magnitude due to vitrification. Therefore, a new mechanism must prevent the reaction partners from reacting in the epoxy films at some stage of RT-curing. A homogeneous chemical immobilisation of amine or epoxy groups can be excluded because the TG-depression is also present on the inert gold substrates. However, the partial demixing effect discussed above can provide an alternative explanation. Demixing would lead to a heterogeneous structure that separates the reaction partners. They have to diffuse through the phase boundaries before they react. The flux of diffusing molecules is directly related to the area of the phase boundaries. In the bulk, the reactant molecules diffuse from one phase through the whole area of the phase boundary, that can by approximated as a sphere with the surface , into the surrounding phases. In the epoxy bulk, the diffusion is effective during RT-curing until reached 326 K. Now, the heterogeneities deduced from the laterally resolved Brillouin data possess lateral dimensions on the sub-mm scale. We presume that this scale corresponds to the characteristic size D of the supposed phases. As a consequence, the area of the phase boundary is cut by the interfaces air–film and film–substrate if becomes smaller than the phase size D. This is the case for the epoxy films. The remaining diffusive flux is restricted to the curved surface of the remaining spherical layer. The effective rate of chemical reactions is small, therefore, and is lower for the thinner films just after the RT-curing.
Fig. 16 provides the results of μ-BS measurements for the depth profile in 1 mm epoxy layers on Al, Cu and Au after RT-cure. On the upper side of the layer, a thin glass plate completes the adhesive joint thus preventing evaporation of DETA. As above, the bulk density ρEP = 1.17 g cm−3 is used for an estimation of .
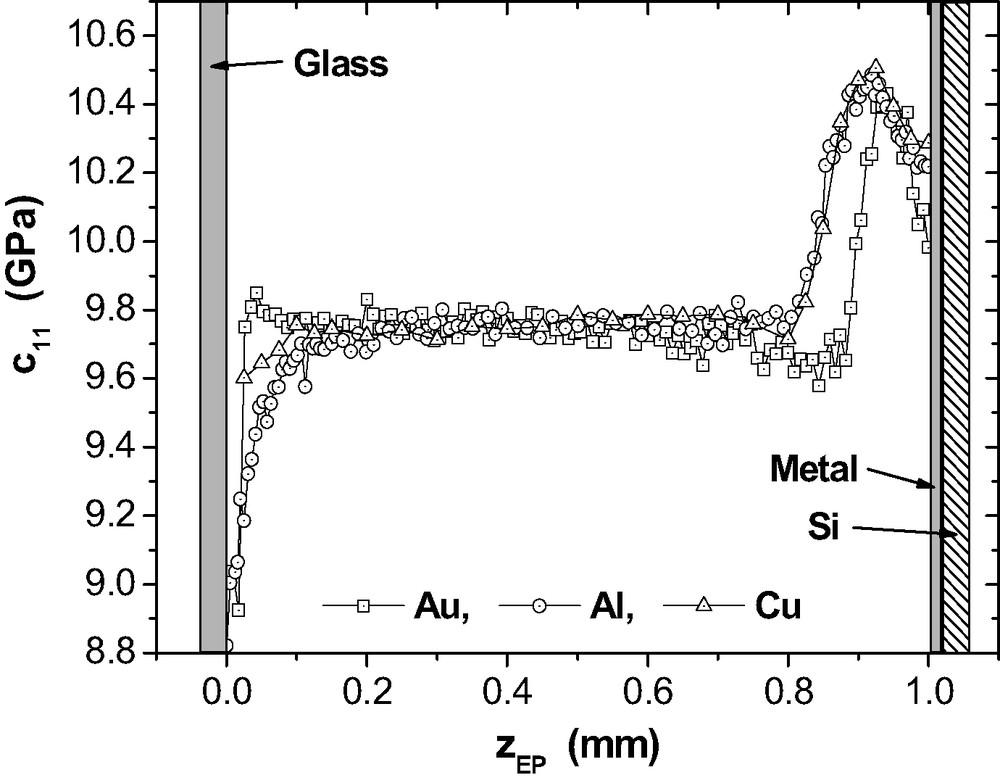
Elastic stiffness coefficient as a function of the normal position of the scattering volume inside a RT-cured epoxy layer between Au, Al or Cu on one side and a glass slide on the other side (at = 0 mm).
Inside the three epoxy layers, the plateau values are almost the same ((Au) = 9.84 GPa, (Al) = 9.75 GPa, (Cu) = 9.66 GPa). The values appear to be slightly higher than the mean bulk value = (9.1 ± 0.3) GPa, but this could simply result from variations of room temperature during preparation. Furthermore, the statistical ensemble might have been not big enough for the determination of a true .
At the metal side, specific maxima in indicate a surprisingly broad interphase with mechanical properties modified due to the presence of the metal substrate. In the interphases on the native oxides of Al and Cu, the maximum in reaches about 107% of the corresponding . At these two metal interfaces we have . The interphase appears to be slightly narrower on Al (ca. 230 μm, measured at the foot of the -peak) than on Cu (ca. 300 μm). On Au, the interphase extends only to some 190 μm into the epoxy and the stiffness maximum (at ≈ 930 μm) is closer to the interface than on Al or Cu (at ca. 880 μm). Another interphase with a drop in is found at the glass side of the samples. Actually, it would be expected to be the same in all specimens but this is not the case. We suppose that appearance and profile of this interphase are also sensitive to the state of the glass surface which was not controlled explicitly in these experiments.
The data points that are closest to the metal surfaces, represent the elastic properties averaged over a -region of 5-μm. Tentatively, they can be compared with the data given in Table 1 for the films with ≈ 3.2 μm. In the 1-mm adhesive joints, the -data at the metals are by ca. 0.8–1.3 GPa higher than in the 3.2-μm films. This is an indication that the thin films might be not representative for the mechanical properties of the interphase in the thick adhesive joints.
It is not straightforward to understand why goes through a maximum far from the metal and why the interphases are so broad. The maximum implies that the polymer structure formed under the influence of at least two competing processes. They can not relate directly to the mechanisms of fundamental adhesion because of the broadness of the interphase. However, an increase of stiffness would be caused by an increased epoxy consumption which would result in a denser network. As the consequence, the observed maximum in corresponds to a maximum network density. This picture fits qualitatively to the view that segregation or even phase separation are triggered by the metal surfaces. It seems that the lateral heterogeneity, observed on the thin epoxy films, now extends considerably into the epoxy in the adhesive joint. A plausible explanation for the maximum itself will be given in the next section.
3.3 Properties of the post-cured films
Post-curing (120 °C, 1 h) increases the oxirane consumption to 100% in bulk, but it remains incomplete in the epoxy layers on the metals. The ERA spectra do not show the formation of any ether species. Hence the reaction between oxirane rings and hydroxyl groups (cf. eq. (2)) did not take place. This conclusion is further supported by the spectroscopic changes in the OH / NH stretching region - see the spectra in Fig. 17 for the 50 nm films.
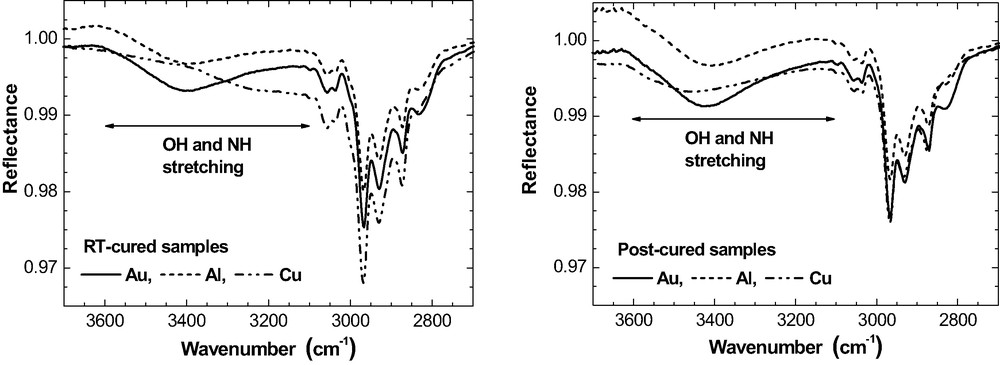
Changes for the hydroxyl / amine bands caused by the post-curing of 50-nm epoxy on Au, Al, Cu. (ERAS, 70°, p-polarisation).
As expected for the oxirane–amine reaction, post-curing results in a rise of intensity for the OH band on each metal. For the epoxy layer on Cu, we note in passing that the post-curing process ‘corrected’ the ‘deformed’ shape of the OH / NH band. Therefore, the particular Cu-induced chemical reactions in the epoxy at room temperature must have been reversed during post-curing.
Fig. 18 summarises the -data for Al, Cu and Au.

Oxirane consumption on Al, Cu, Au as a function of after post-curing in argon atmosphere (ERAS, 70° p-polarisation).
The thick layers approach the full oxirane consumption as it is characteristic for the bulk (note that the accuracy of is not that good around 100% because the IR band intensities go to zero). Even in the thinnest films, the oxirane consumption increases to more than 75%. These high values are another point against the assumption that a considerable amount of DETA could have evaporated out of the epoxy films. For a final answer, post-cured films on Au have been stored in argon at 40 °C for 100 d [40]. The residual oxirane groups reacted fully in the thin epoxy films within about 50 days. Again, no new band developed in the ether region. Keeping in mind that the oxirane ring does not react with the Au surface, we conclude from these findings that the oxirane groups reacted only with amine hydrogen in the epoxy films under the given conditions. As a consequence, the necessary amount of DETA must have been available in the thin layers.
Generally, the residual oxirane contents increase with decreasing epoxy thickness in the post-cured samples (Fig. 18). The absolute values of scatter somewhat from sample to sample. It is obvious that the metals influence the post-curing specifically. In the range of 100–600 nm, most oxirane is consumed on Cu, followed by Al and Au.
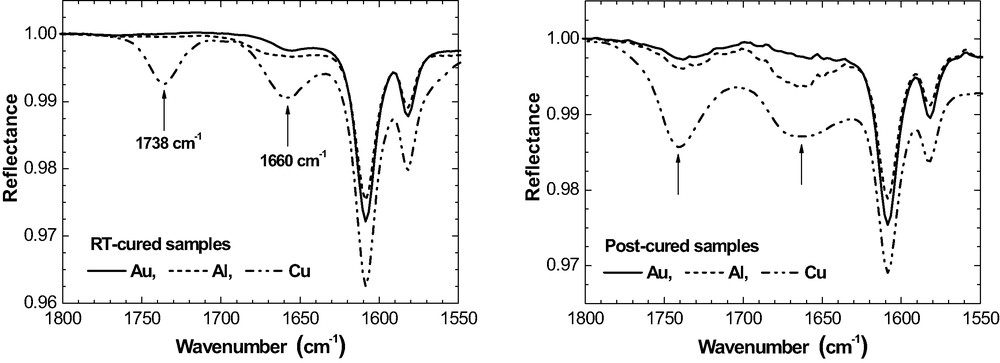
In addition to the specific oxirane consumption, new IR bands are observed at ca. 1660 cm−1 and 1738 cm−1 in the post-cured epoxy layers on all three metals. Fig. 19 compares the situation prior and after post-curing for 50 nm films as an example.
On Al and Au, the band at 1738 cm−1 is very weak in the RT-cured films. It grows slightly as a result of post-curing, mainly for the thinner films. For Cu, the situation is different again. The well separated band at 1738 cm−1 is already present after RT-curing and the intensity increases significantly due to post-curing. Fig. 20 summarises and for the band at 1738 cm−1.
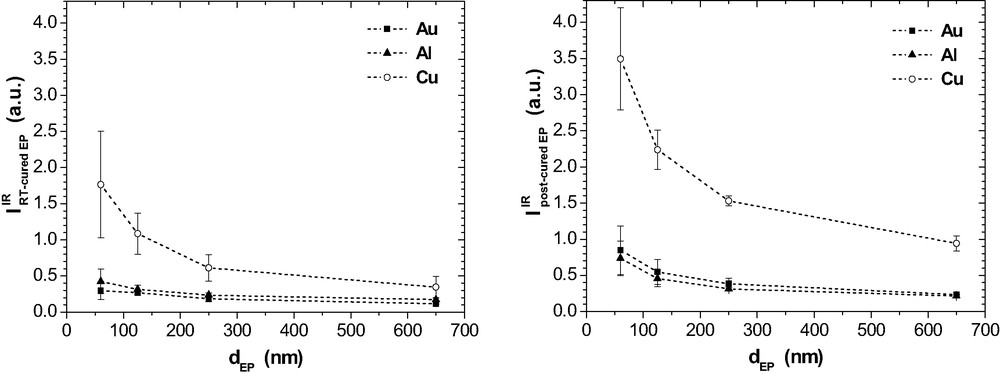
IR intensity at 1738 cm−1 as a function of in epoxy films on Al, Cu and Au prior and after post-curing (ERAS, 70°, p-polarisation).
The band at 1660 cm−1 is well developed in the RT-cured films on Cu while it is hardly observed on Al and Au (Fig. 19). Post-curing results in some rise of band intensity in the epoxy on Al as well as on Au and even more pronounced on Cu. Band intensity is largest for the thinnest films, which do not contain any residual MEK after room temperature curing. All these features show that now the band at 1660 cm−1 does not depict the imine that would result from the condensation reaction of MEK and DETA according to eq. (8). It is concluded from these metal-specific differences that the bands at 1660 cm−1 and 1738 cm−1 indicate two different functional groups or chemical products because the band intensities do not develop simultaneously.
These data confirm the specific influence of the metals on the curing chemistry. Its long range over some hundred nanometres supports again the view that some kind of segregation or phase separation must be present also in the post-cured epoxy films. That results in interphases with specific chemical structures.
Fig. 21 provides the μ-BS results for 1-mm epoxy on Cu after post-curing as an example for the effect of post-curing on the mechanical properties in the adhesive joints.
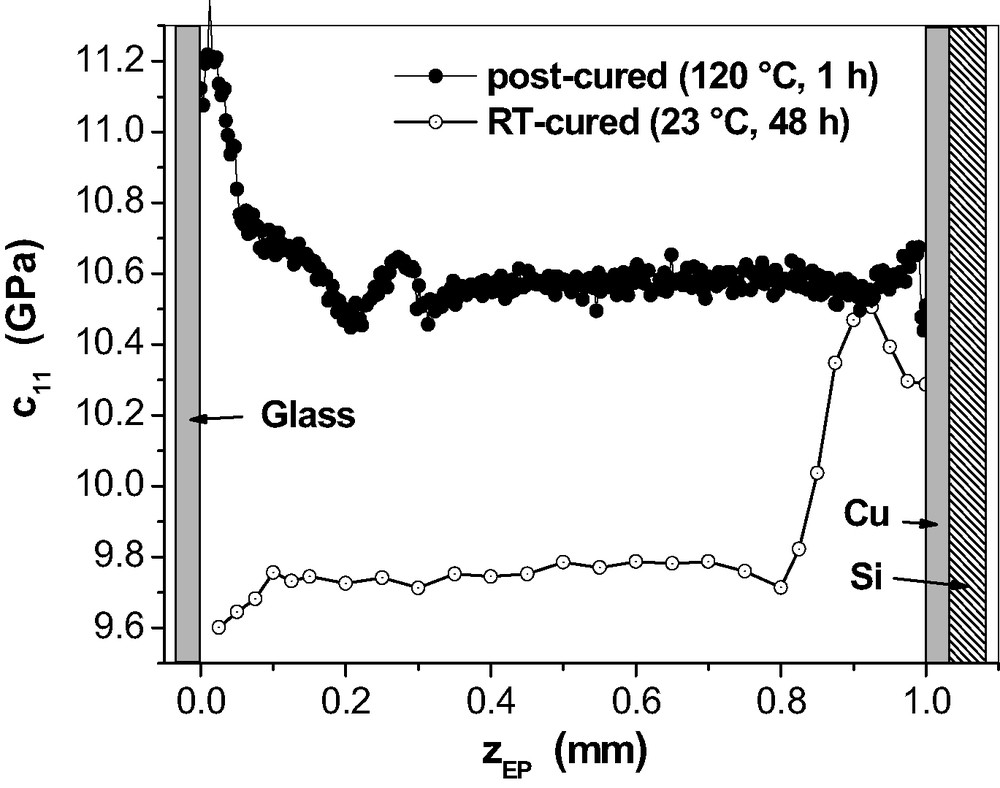
inside 1 mm epoxy between a glass slide and the native surface of a Cu PVD layer on a Si wafer. RT-curing at 23 °C and additional post-curing at 120 °C for 1 h.
Generally, the post-curing produces the expected increase in network stiffness. It is most interesting, however, that the -profile changed completely. The plateau level of inside the epoxy increased to the value for the original maximum at the Cu side. Post-curing replaced this old maximum by a new one. It is very small and it is located almost on the metal interface. At the glass side, the minimum converted into a maximum but we will not consider that further.
Post-curing at 120 °C means at first that the epoxy network reaches the viscoelastic state where the internal stresses relax quickly. Such stresses developed at room temperature as the result of adhesive bonding between epoxy and metal surface on one hand and shrinkage due to polymerisation on the other hand. That introduces lateral shear stress which tends to reduce [32]. At least in part, this stress would explain the decrease of between the maximum and the metal interface. Secondly, the chemical reactions continue at 120 °C and increase the network density but without substantial shrinkage. It is known for the bulk that this post-curing results in full epoxy consumption and in a network structure which is not per se homogeneous. For the adhesive joint, the high plateau value ((Cu) ≈ 10.6 GPa) represents the stiffness for the post-cured bulk. It is equal to the former maximum found in the RT-cured joint. This coincidence suggests that this former maximum should reflect a region with fully cured network. The clear -decrease, found for the RT-cured samples between their -maximum and the metal, almost vanished during the post-curing. This should be caused by the stress relaxation mentioned above. In the post-cured epoxy, the little new maximum near to the metal could indicate that there is a new interphase (< 100 μm broad) with increased effective stiffness due to the internal stresses that arise during cooling from 120 °C to room temperature.
4 Conclusions
The formation of interphases has been studied in thin films (20 nm < < 5 μm) and in thick adhesive joints ( = 1 mm) prepared with an amine-cured epoxy system on smooth native surfaces of aluminium, copper and gold. The chemical state of the thin epoxy films has been monitored by IR spectroscopic techniques. It turns out that the curing reactions at room temperature slow down in a metal-specific manner and almost finish within 72 h. As shown by Brillouin spectroscopy (BS), the solidification is considerably delayed in thin films as compared with the bulk. Films should be prepared from a pre-polymerised mixture because a remarkable part of the DETA would evaporate, otherwise.
Even with the pre-polymerised material, the final epoxy consumption is much lower in the films than in the bulk. The effects extend over several hundred nanometres of film thickness. We consider that region as a ‘chemical interphase’ which is much beyond the interaction range of any mechanism of fundamental adhesion. In the RT-cured films, the static glass transition temperatures (determined by BS) are well below room temperature and they decrease with to the level of 250 K for 200 nm films. Despite these surprisingly low -values, the curing reactions remain incomplete to a significant extent. This behaviour is in contrast to the inhibition mechanism for the curing process in the bulk where vitrification plays the dominant role and leads to a = 326 K. Moreover, laterally resolved BS reveals a mechanical heterogeneity in the sub-mm range. Post-curing induces additional chemical changes that are specific for the metal substrate. In contrast to the bulk, the oxirane consumption is still less than 100%.
From these results we conclude that the epoxy network does not possess a homogeneous morphology in the thin films. Adhesion and thermodynamic processes like segregation of components at the metal interface or at the air interface, trigger the formation of heterogeneities in the liquid stage. As a result, a specific layer, containing such heterogeneities, is formed at the metal interface. We call this layer the ‘morphological interphase’. It extends over the unexpected long range of at least some hundred micrometers. The heterogeneities are not a simple gradient layer perpendicular to the substrate but they form a 3-dimensional structure. Inside the heterogeneities, the chemical reactions are supposed to proceed at different rates during curing due to the differences in composition. This provides the observed 3-dimensional ‘morphological interphases’.
For the thick adhesive joints, information on the local chemical state is not available for experimental reasons. However, the newly developed Brillouin microscopy provided data for the local mechanical properties (stiffness coefficient , measured at GHz frequencies) with a spatial resolution of 10 μm inside the adhesive joints. On the metal side in RT-cured joints, forms broad peaks of more than 100 μm width. Obviously, this dimension does not fit to any range common for adhesion forces. The -maximum is located at ca. 70–120 μm distance from the metal interface. It could correspond to a fully cured region. The -peak implies that the polymer structure forms in this ‘mechanical interphase’ at room temperature under the influence of at least two competing processes like degree of curing and macromolecular packing at one hand and internal stresses due to polymerisation on the other hand. The picture fits qualitatively to the view that segregation or even phase separation are triggered by the metal surfaces. Quantitatively, the adhesive joints turn out to develop other mechanical properties than the thin epoxy films. It seems that the lateral heterogeneity, observed for the thin films, now extends in some way into the epoxy in the adhesive joint. In the post-cured adhesive joints, the -peak has changed position, shape and height. This should reflect the stress relaxation in the viscoelastic state as well as additional chemical conversion and the development of new internal stresses during cooling to room temperature after post curing.
All results show that pronounced interphases of complex morphological and chemical structure develop during the formation of the polymer network. The term ‘interphase’ does not possess a general meaning, however. It has to be defined not only for the given kind of specimen but, more important, also in the context of the considered property like stiffness, network density, distribution of functional groups etc. A complex 3-dimensional morphology must be assumed for the interphase and the interphase properties become field variables. Apart from the adhesion mechanisms, the interphases turn out to be a second key element for an understanding of the performance of polymer composites and adhesive joints. Further research is needed in order to reveal the morphology, including its characteristic scales, and to characterise the physical and chemical properties of the interphase as a dynamic region between solid substrate and polymer.
Acknowledgements
This work was kindly supported by the Deutsche Forschungsgemeinschaft and by the German Federal Department for Education and Research.