

1 Introduction
The optical control of magnetic material properties, i.e. photomagnetism [1], is a key target in current material science. An important future application of such materials is high-density, high-speed data storage [2]. In the present communication, we focus on Fe(II) complexes exhibiting a highly promising photomagnetic effect: ligand-driven light-induced spin-change (LD-LISC) [3]. The LD-LISC approach is based on the interplay between a spin crossover (SCO) metal ion [4,5] and a number of photoactive ligands [6] such as cis–trans photoisomer groups. The optical switching of the ligands induces changes in the electronic environment of the metal ion and a corresponding change in the spin-state energies [3,7]. In this case, a temperature range can exist where the optical switching of the ligand conformation induces the high-spin ↔ low-spin (HS ↔ LS) conversion. To a large degree, the LD-LISC approach decouples the design of a suitable metal ion environment and optimization of the photoswitch ligands, allowing one to target high absorption strength, efficiency and bistability of the switching process whilst maintaining the desired SCO behavior. In this sense, the LD-LISC effect should be distinguished from the LIESST (light-induced excited-state spin trapping [8,9]) effect where the optical switching involves direct excitation of the metal orbitals (relatively weak d–d or d → MLCT transitions), and design modifications made to enhance the optical switching also directly affect the SCO properties. The LD-LISC effect has been previously demonstrated for Fe(II) and Fe(III) SCO complexes bearing a pyridine–CHCH– function [10–13]. Complexes with desirable properties (room-temperature spin switching, highly stable ligand states, and visible-wavelength excitation) have been achieved by the rational design and synthesis of appropriate organic and inorganic components. However, several open issues remain concerning the precise sequence of the photomagnetic switching with respect to the photoisomerization, which motivate time-resolved studies of the SCO process during irradiation.
Whilst the LD-LISC effect has been observed in solution and dilute host–polymer films doped with the photosensitive complexes, recent attempts to drive the photoinduced spin-change in ordered and densely-packed molecular assemblies, i.e. Langmuir–Blodgett films [7,14], have not been successful. The embedding of complexes in matrices with relatively low rigidity is generally required to favor the geometrical changes induced by the –CHCH– isomerisation. This can create difficulties for conventional measurement techniques, such as SQUID magnetometry, where dilute samples with an appropriate optical density for irradiation produce weak signals which are difficult to resolve quantitatively in the presence of a large diamagnetic background, and special measures must be taken to efficiently deliver optical excitation in situ to the bulk of the sample [15]. Whilst information can be gained from pure optical absorption studies, these do not probe the magnetic state of the metal ions directly, and weak target metal-based absorption bands (d–d, d → MLCT) may be difficult to resolve in the presence of strong overlapping π–π∗ bands of the organic ligands.
In the present paper, we apply magneto-optical spectroscopy, in particular magnetic circular dichroism (MCD) [16], for the study of the magnetic ground state of Fe(II) LD-LISC compounds in doped polymer thin films (where cooperativity effects in the SCO are absent). The MCD technique allows sensitive measurement of the Fe(II) spin-state in a dilute, randomly-oriented molecular sample, by selectively probing the magnetically active chromophores in the sample (especially at low temperatures), whilst employing samples with an appropriate optical density for photoswitch irradiation studies. Moreover, the use of MCD can be extended to time-resolved measurements (down to the sub-nanosecond excited-state time scale [17,18]), which is one of our key long-term aims in the study of the LD-LISC process: to monitor the spin-change dynamics in relation to the ultrafast cis–trans photoisomerization process.
The compounds under study here, Fe(stpy)4(NCSe)2 (stpy = 4-styrylpyridine, synthetically prepared with either all-cis or all-trans isomers, Fig. 1(a)), belong to a class of complexes Fe(II)L4X2 for which the LD-LISC effect has been demonstrated [11]. Whilst the all-cis complex maintains a HS (S = 2) ground-state over the whole temperature range studied (≥5 K), the all-trans complex exhibits a HS ↔ LS transition. We present a comparison of the temperature-dependent magnetization behavior in microcrystalline powder samples (from SQUID measurements) with that deduced from MCD measurements of the complexes in dilutely doped polymer (PMMA) thin films over a wide range of temperature (5–220 K) and magnetic field (0–8 T). For the all-cis complex, the existence of a HS state even at low temperatures allows us to reach the paramagnetic saturation regime (thermal energy ≪ Zeeman energy), and we present a set of variable-temperature (VT), variable-field (VH) measurements. We discuss the results of preliminary modeling of these data which indicate that the Fe(II) environment possesses a positive axial zero-field splitting (ZFS) (corresponding to axial compression) with a significant out-of-plane (z-) polarization in the Fe → stpy MLCT transition being probed, both results being consistent with the observed crystal structure.
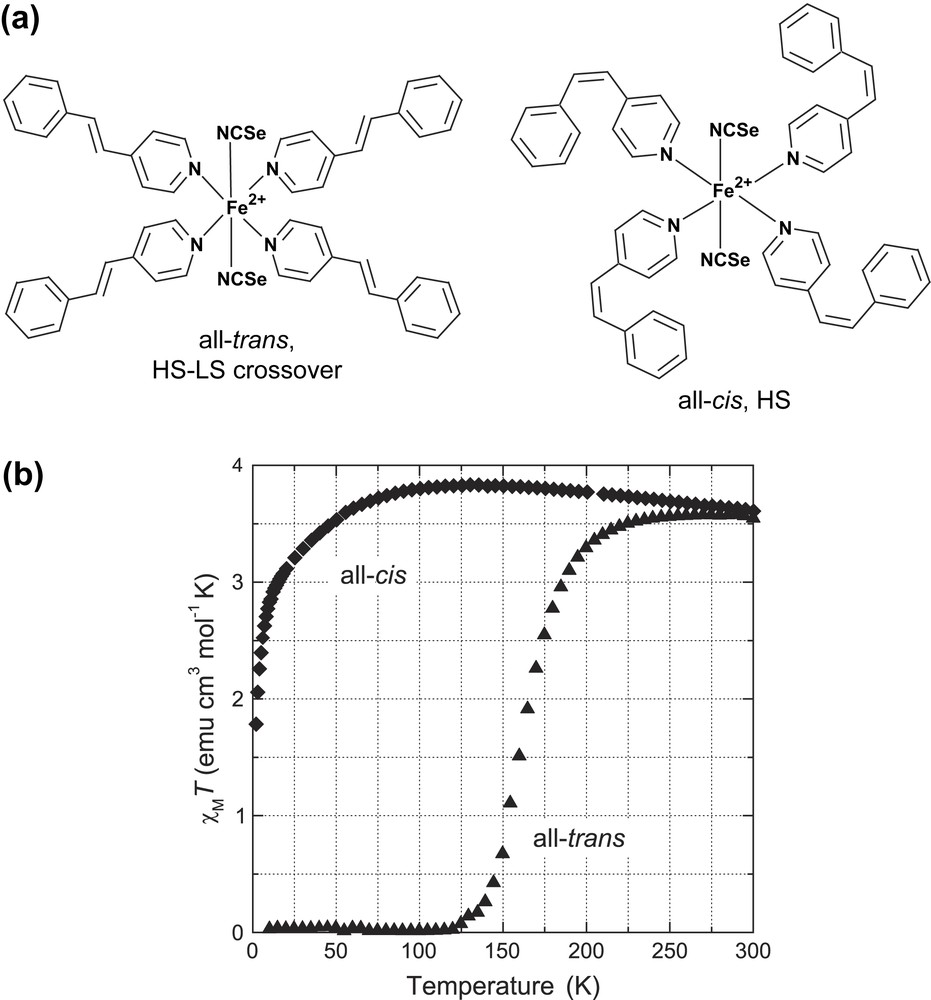
(a) Compounds under study, Fe(stpy)4(NCSe)2, with synthetically prepared all-trans or all-cis stpy isomer conformations. (b) Corresponding SQUID magnetization curves vs temperature.
For the all-trans complex, we show that VT MCD measurements allow one to clearly observe the HS ↔ LS transition for non-interacting complexes in the polymer host environment. The results show that the SCO transition for complexes embedded in the polymer host is shifted to significantly lower temperatures compared to that in microcrystalline powder, with the onset of the SCO occurring at ∼50 K as compared to ∼120 K for the powder sample. We discuss this result in terms of intermolecular effects, such as the reduction in the effective environmental pressure of the polymer host against the SCO structural changes. The environment-dependent SCO transition behavior is a critical issue in terms of the temperature range where the LD-LISC effect may be observed in a particular molecular environment. Another important result is that the paramagnetic MCD signal is still appreciable at higher temperatures (∼200 K), which would be required for time-series irradiation studies in order to maintain efficient photoisomerization quantum efficiencies for the stpy ligands. This demonstrates that the MCD technique could in principle be applied to monitor the LD-LISC effect during photoswitch irradiation.
2 Magnetic properties of microcrystalline powder samples
Fig. 1(b) shows the temperature dependence of the χMT product (χM being the molar magnetic susceptibility) recorded for microcrystalline powder samples of both the all-trans and all-cis complexes (measured at B = 0.5 T). For Fe(cis-stpy)4(NCSe)2, the curve has a maximum of χMT = 3.83 cm3 mol−1 K at T ∼ 125 K, and decays slowly with increasing temperature to χMT = 3.61 cm3 mol−1 K at T = 300 K – this range of values is consistent with the S = 2 HS state. The form and magnitude of the variation of χMT (here ∼0.2 cm3 mol−1 K) in this relatively high-temperature range have been previously observed for Fe(II) complexes, including the closely related complex, Fe(II)(py)4(NCS)2 (py = pyridine) [19], and can be accounted for by inclusion of higher-lying near-degenerate orbital states in a distorted-octahedral environment. At low temperature, the magnitude decays towards zero (with χMT reaching 1.78 cm3 mol−1 K at T = 2 K). This behavior is to be expected for the HS S = 2 state in the presence of positive axial ZFS (due to an ms = 0 ground state) [20]. In principle, another contribution to this trend could arise from the partial formation of the LS species at low temperature. However, we tend to rule out this latter effect, based on the low-temperature MCD measurements on the all-cis complex in doped polymer films (see Section 4.1). As will be shown, the MCD signal (which measures a different projection of the intramolecular spin) shows no decaying tendency down to 5 K.
Turning to the data for Fe(trans-stpy)4(NCSe)2 one observes the S = 0 ↔ S = 2 spin crossover in the temperature range ∼120–220 K. For T = 300 K, the value of χMT = 3.54 cm3 mol−1 K is comparable to that of the all-cis complex, indicating that the SCO process is almost complete. We note that a comparison of the χMT curves for ascending/descending temperature showed no discernible hysteresis in the SCO curve. These magnetic properties are consistent with those previously reported for close analogues of the type Fe(stpy)4(X)2 with X = NCS−, NCBPh3− and NCBH3− [10,11]. In all cases, the all-cis complexes are pure HS species over this temperature range, whereas the corresponding all-trans complexes exhibit an analogous SCO transition to that shown in Fig. 1(b).
The distinct spin-state behavior between the all-cis and all-trans complexes arises from differences in their electronic structure and corresponding thermodynamic parameters (i.e. the enthalpy (ΔH) and entropy (ΔS) differences between their respective HS and LS states). In terms of electronic effects, an important factor noted previously [10] (and supported by DFT calculations [21]) is that each trans-stpy ligand possesses an almost planar geometry, which results in a higher mesomeric π-acceptor character than the cis-ligands, and hence a larger effective ligand field splitting. Considering the effect of the anionic ligands X−, the observed transition temperatures (in microcrystalline powders) vary along the series of Fe(stpy)4(X)2 according to T1/2 = 108 (X = NCS−), 163 (X = NCSe−), 190 (X = NCBPh3−) and 200 K (X = NCBH3−) [10,11]. This tendency can be compared to the one observed by Purcell and König for Fe(II) SCO complexes of the type Fe(phen)2X2 [22], and is related to the increasing ligand field along this series of anionic groups.
As detailed in Section 6.2, we attempted to fit the SCO curve of the all-trans complex in Fig. 1(b) using the Slichter–Drickamer model [4,23] for the HS/LS populations, assuming (χMT)LS = 0 and a temperature-independent value for (χMT)HS. Whilst we could fit the data quite well with this model, additional tests taking into account an uncertainty in the value of (χMT)HS (e.g. with a variation as per the all-cis HS complex) indicate that the fitted parameter values (ΔH, ΔS and the cooperativity parameter Γ) are particularly sensitive to such effects. Hence, we defer a quantitative analysis of the SCO parameters here, pending the results of independent thermodynamic measurements [24]. In any case, across the plausible range of fitted parameters, the values of Γ provide evidence for appreciable cooperativity in the SCO transition due to intermolecular interaction between neighboring complexes [25]. This leads one to expect significant differences in the SCO behavior for the case of isolated complexes (e.g. as dilute dopants in a polymer host film). From the MCD measurements of Fe(trans-stpy)4(NCSe)2 in PMMA films presented later in this paper, we show that the main effect of dilution in a polymer host leads to a significant shift of the SCO to lower temperatures.
3 UV–vis absorption spectra
The room-temperature (RT) UV–vis absorption spectra of Fe(stpy)4(NCSe)2 in both CHCl3 solution and in doped PMMA films are shown in Fig. 2. Whilst the MCD measurements in the next section were performed on frozen doped PMMA films, we concentrate first on the room-temperature solution spectra in Fig. 2(a) (i.e. both complexes in the HS state), where weak absorption features can be quantitatively resolved in the absence of thin-film scattering and interference effects. For comparison, we include the absorption spectra of the isolated stpy ligands (scaled by a factor of 4 to account for the number of stpy ligands in each complex).
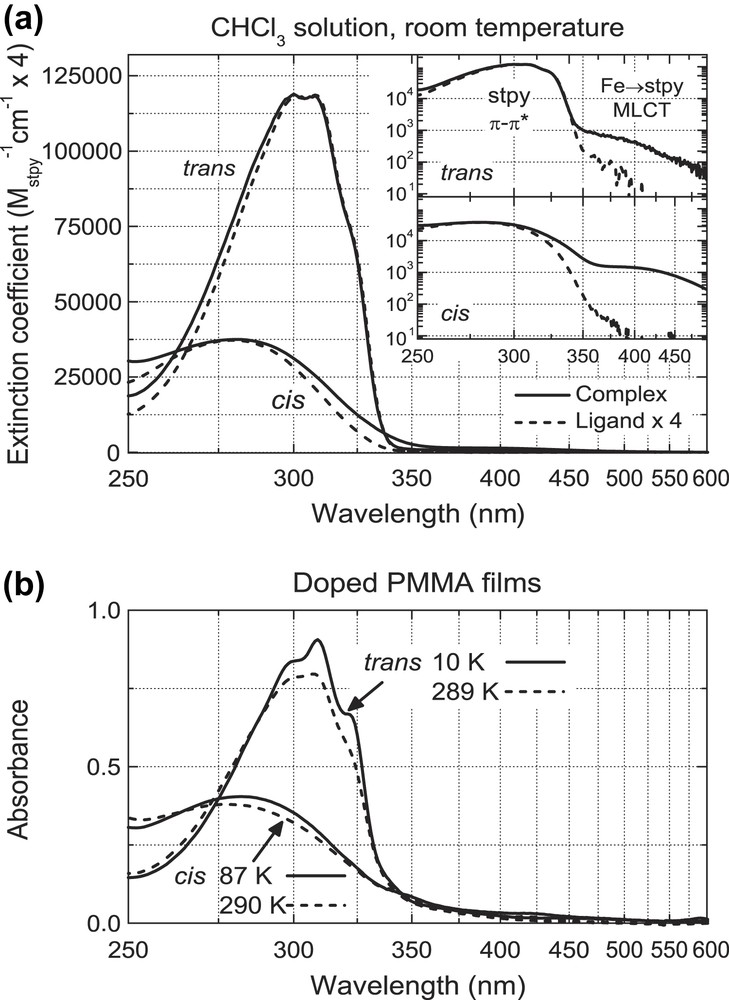
UV–vis absorption spectra of Fe(stpy)4(NCSe)2 (all-trans/all-cis) in (a) CHCl3 solution and (b) doped PMMA thin films. In (a) the absorption spectra of isolated stpy ligand samples are included (scaled by a factor 4 to account for the 4 stpy ligands per complex). Insets in (a) using logarithmic vertical scale for better identification of MLCT bands on low-energy side of stpy π–π∗ band.
Both all-cis and all-trans complexes exhibit absorption bands due to intra-ligand π–π∗ transitions, with peaks at λmax = 280 nm (cis) and λmax≈304 nm (trans). The red-shift of the band for the almost planar trans-stpy isomer relative to the cis-stpy isomer reflects the larger stabilization of the corresponding orbitals. This analysis is fully confirmed by the optimized geometries and electronic structures determined for both isomers by DFT calculations [21]. In comparison to the free stpy ligands, the π–π∗ band for the all-trans complex has only a very slight deviation on the blue side, whilst for the all-cis complex one observes a small but significant broadening of the band, suggesting that the conformation and vibrational character of the cis-ligands is altered somewhat in the complex compared to the uncoordinated ligands.
The insets of Fig. 2(a) present the spectra with a vertical logarithmic scale, where a second absorption band for both all-cis and all-trans Fe(II) complexes appears as a partially resolved shoulder, with an extinction coefficient of ∼1500 M−1 cm−1 (cis) and ∼500 M−1 cm−1 (trans) and a peak position near 400 nm in both cases. In proposing an assignment for this band, we first note that the 5T2g → 5Eg d–d transition for Fe(cis-stpy)4(NCSe)2 was observed as a broad band in the NIR with λmax ∼ 850 nm (∼11,800 cm−1, ɛmax ∼ 7 M−1 cm−1), as is typical for such distorted-octahedral HS Fe(II) complexes [16]. Given that the next higher energy d–d transitions should be spin-forbidden (and hence, should not possess absorption strengths of this magnitude), it is reasonable to assign the observed band to a transition involving Fe(II) → stpy metal-to-ligand charge transfer (MLCT) character.1 Such an assignment was made previously for the complex Fe(stpy)4(NCBPh3)2 [11]. The MCD measurements presented in the next section concentrate on the spectral range where this Fe(II) → stpy MLCT band dominates.
In Fig. 2(b), we show the absorption spectra of the Fe(stpy)4(NCSe)2 complexes as dilute dopants in spin-cast PMMA thin films, both at RT and low temperature (87 K for the all-cis complex and 10 K for the all-trans complex). At RT, the π–π∗ bands are very similar to those in CHCl3 solution. At low temperature, modest changes are observed for the all-cis complex, whilst for the all-trans complex the vibrational structure becomes more well-defined (and suggests a vibrational spacing of ∼1250 cm−1). Whilst absorption features can be seen in the MLCT range for both complexes, due to the presence of absorption artifacts (scattering, thin-film interference and temperature-dependent base-line drifts) we avoid an interpretation of this spectral region. In any case, the strong resemblance of the π–π∗ band between solution and thin films supports the notion that there is no aggregation in the thin films, nor any specific electronic interaction with the PMMA host matrix.
4 MCD characterization of doped polymer thin films
4.1 VT–VH MCD measurements on HS all-cis complex
In Fig. 3 we present a summary of the experimental and model VT and VH MCD data for the all-cis complex. Fig. 3(a) shows a representative UV–vis MCD spectrum for T = 50 K in the range 300–600 nm, produced by taking the difference between the data for B = ±6 T (to suppress field-independent and even-order-field artifacts). The observed feature for λ < 500 nm is consistent with the Fe(II) → stpy MLCT band observed in solution (inset of Fig. 2(a)), with the rising tendency of the signal for decreasing λ being attributed to both the theoretical 1/λ-dependence of MCD signals [16] and contributions from higher energy transitions. There is no clear evidence for a bipolar spectral component (i.e. related to the derivative of the bandshape), suggesting that the signal is dominated by MCD B-/C-terms (due to field-induced orbital state mixing, and paramagnetic ground state, respectively) [16], as addressed below. For the VT and VH MCD data, we integrated the MCD signal measured at the three wavelengths 380, 400 and 420 nm, i.e. in the central region of the MCD band as indicated by the shaded region in Fig. 3(a). This range was chosen so as to minimize possible contributions from higher energy transitions, and to exclude artifacts in the region above 450 nm that emerged for T ≤ 45 K due to field-dependent polarization effects from the fused silica windows of the magnetic cryostat. We performed VT scans (T = 5–220 K) for B = ±8 T and VH scans (B = 0–8 T) for T = 5, 10, 50, 110 and 220 K, as shown in Fig. 3(c) and (d), respectively. As an initial evaluation of the data, in Fig. 3(b) a subset of the results is plotted vs the Zeeman factor βB/2kT (where is the Bohr magneton) where a clear saturation behavior can be observed for each curve. In the case of a simple picture with only Zeeman splitting of the ms-quintet sub-levels [26] (or an isolated ms = ±S Kramers doublet [27,28]), the MCD signal should be a function of B/T alone. However, a comparison of the VH MCD data in Fig. 3(b) for T = 5 K and T = 10 K shows that these two curves do not superpose, i.e. there is significant “nesting” of the curves. This nesting behavior is also exemplified for the case of the VT scan with B = 8 T. This implies that there is significant zero-field splitting (ZFS) and magnetic field-induced mixing between ms states as is commonly observed for Fe(II) HS complexes [27].

Experimental MCD data for Fe(cis-stpy)4(NCSe)2 and preliminary fits. (a) Representative MCD spectrum measured for T = 50 K, B = 6 T, indicating wavelength range for signals in (b–d) (three points at 380, 400, 420 nm). (b) Variable-temperature (VT) and variable-magnetic field (VH) MCD scans vs Zeeman factor. (c) VT and (d) VH MCD scans.
As a preliminary analysis of the data, we employed the generalized MCD model put forward by Neese and Solomon [26] which is applicable for orbitally non-degenerate paramagnetic ground states, using the expression for orthorhombic symmetry. A second phenomenological term, linear in the B-field, is added to the model to account for field-induced mixing with near-degenerate orbital states (see Section 6.4.2 for details). We note that in the absence of independent estimates of the model parameters from other spectroscopic measurements, the present analysis is aimed at providing only an indication for the range of parameters needed to reproduce the available data. In this light, in fitting the data we used an isotropic g-tensor with fixed components g = 2.1, and a small fixed value for the relative rhombic ZFS parameter E/D = 0.05, which were selected after initial fitting runs and allow us to achieve sufficiently well-defined convergence in fitting the remaining parameters: the axial ZFS D and the components of the effective polarization vector (as well as the coefficients of the paramagnetic- and linear B-terms, A and b). The fitted model curves are included in Fig. 3(b–d), and can be seen to reproduce the experimental VT and VH behavior reasonably well (using D = 5.1 cm−1, , A = 33.4, and b = 0.098 T−1).
In order to interpret these fitted values, we refer to details of the single-crystal structure determined for Fe(cis-stpy)4(NCSe)2 (to be published elsewhere), accepting the possible role of crystal packing distortions absent in the doped polymer samples. A moderate positive axial ZFS (+D, estimated here as D = 5.1 cm−1) was generally required to fit the data, regardless of the values assumed for the g-tensor/rhombic ZFS parameters. This is consistent with the axial compression observed in the crystal structure, i.e. with Fe-Nstpy bond lengths in the range 2.21–2.22 Å compared to 2.15 Å for the axial Fe-NX bonds. In the case of such +D systems, ligand field theory predicts a non-degenerate 5B2 orbital ground state, with the ms = 0 sub-level lowest in energy [27]. This result is relevant in interpreting the fitted effective polarization vector for the Fe → stpy MLCT transition being probed (), where a dominant contribution arises from the yz and xz components (i.e. z-polarization). Such a situation is reasonable considering that in the crystal structure the cis-stpy ligands are strongly distorted out of the xy-plane (as was also observed in the case of Fe(cis-stpy)4(NCS)2 [10]). As previously discussed for +D systems (e.g. Fe(II)SiF6·(H2O)6 [28]), for the case of a pure xy-polarized transition the MCD signal involves only the axial term , which vanishes for sufficiently low temperatures, due to the fact that only the lowest lying ms = 0 sub-level is occupied. However, the yz and xz polarization components still contribute at low temperature (due to the non-vanishing terms and , respectively), which accounts for the finite MCD signal at low temperature observed in Fig. 3(c).
The fitted coefficients used here for the paramagnetic term (A = 33.4) and linear B-term (b = 0.098 T−1) imply that at T = 220 K the linear B-term contributes ∼50% of the total signal. This relatively large B-term contribution would be reasonable in the presence of near-degenerate 5E orbital states, as indicated by the high-temperature variation of χMT in the all-cis powder magnetic susceptibility data (Fig. 1(b)). Moreover, referring to the related compound Fe(py)4(NCS)2 [19], a fit of the χMT data yielded an estimate of only 140 cm−1 (∼200 K) for the energy spacing between the 5B2 and 5E states. It should be noted, that if we consider an energy gap of this magnitude, for high temperatures even population of the 5E orbital state may have to be taken into consideration, and a more general treatment of both orbital states incorporating additional ligand field parameters would have to be developed. Whilst this is beyond the scope of the present study, ongoing investigations, including complementary SQUID measurements of the powder magnetization including the saturation regime, should help address this issue.
Before turning to the VT MCD results of the all-trans complex (where we concentrate on the HS ↔ LS SCO process), we raise the issue concerning the precise relation between the observed MCD signal and the corresponding ground-state magnetization χ of a sample of randomly-oriented molecules. This issue strongly affects the practical use of MCD as an optical probe of the magnetic state of a sample. An inspection of Eq. (3) reveals a close similarity between the paramagnetic MCD term and the corresponding expression for the magnetization χ in terms of the thermally-averaged expectation values . A key difference is the presence of the polarization weighting term in the sum over , which appears in the sum in place of the g-tensor components. In this sense, the paramagnetic MCD signal could be viewed as a weighted combination (or rotation) of the sample magnetization in the intramolecular coordinate axes. However, any changes (e.g. photoinduced) in the molecular geometry/electronic structure that significantly change the nature of the transition dipole being probed in the paramagnetic MCD signal (or affect the magnitude of any MCD B-term contribution) could lead to changes in the MCD signal without a corresponding spin-change (i.e. change in the ground-state multiplicity). This could create some ambiguity in interpreting time-series MCD data from irradiation studies, such as for the Fe(II)(stpy)4(X)2 LD-LISC compounds under study here, where one wishes to infer the dynamics of the photoinduced SCO in relation to the cis/trans-stpy photoisomerization sequence. However, in such a case a spectral analysis of the MCD signal can in principle be used to distinguish the MCD signature of several intermediate HS conformations. This is an important advantageous aspect of MCD in comparison to pure magnetization studies: the ability to distinguish different magnetic chromophores in a sample via their distinct spectral dependence. For the Fe(II)(trans-stpy)4(NCSe)2 thermal SCO in the following section however, we anticipate a transition between only a single HS and LS state, such that the HS/LS fractions should be directly related to the differential MCD signal.
4.2 VT analysis of HS ↔ LS all-trans complex
Fig. 4 shows the MCD signal vs temperature (5–220 K) for Fe(trans-stpy)4(NCSe)2 (B = 8 T, data shown as filled circles). This signal was again obtained by integrating the raw signals at 380, 400 and 420 nm, and subtracting a low-temperature field-dependent base-line. The transition of the MCD signal with an onset at T ∼ 50 K is clearly visible, with saturation and a slight roll-off of the signal starting at T ∼ 150 K. We also include the powder magnetization data from Fig. 1(b) for a comparison of the SCO transition in the two environments (hollow circles), which shows that the SCO transition is shifted to significantly lower temperatures for the doped polymer samples.
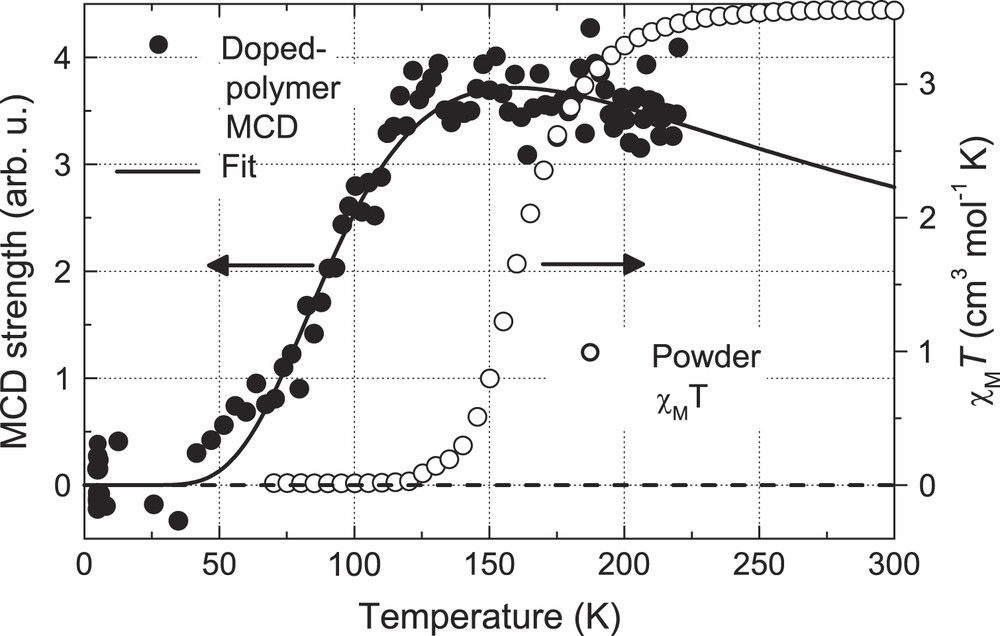
MCD signal vs temperature for all-trans complex in PMMA film (filled circles, B = 8T) and model fit (model and fit parameters described in text). Corresponding SCO curve for microcrystalline powder sample (hollow circles, χT from Fig. 1(b)).
We have analyzed the doped polymer MCD curve using a model of the form , where is the MCD signal for the HS state, and is the HS fraction which can be obtained from a Boltzmann population model in terms of ΔS = ΔSHS − ΔSLS and ΔH = ΔHHS − ΔHLS = ΔST1/2 as per Eq. (1) [4]:
| (1) |
The fitted curve using this model is included in Fig. 4 and shows fair agreement with the data using the fitted parameters ΔS = 24 ± 7 J K−1 mol−1 and ΔH = 3.3 ± 0.3 kJ mol−1, corresponding to T1/2 = 135 ± 28 K (the fitted parameters for the HS MCD envelope were B = 0.21 and C = 941 K). From the relatively large number of reports on the SCO behavior of Fe(II) complexes, the general range of values for ΔS is 35–80 J K−1 mol−1 [4,24], such that our fitted value here appears somewhat too low, and deserves further scrutiny.
The reported SCO entropy change values are most commonly extracted from thermodynamic measurements on crystal/powder samples (e.g. [4,24,29,30]), with a smaller number of reports based on an analysis of the HS–LS populations in solution (using e.g. the Evans NMR technique or UV–vis absorption changes [31,32]) which employ an expression equivalent to Eq. (1). The total entropy change can be written in terms of electronic and vibrational contributions as . Due to Jahn–Teller distortion and other degeneracy breaking mechanisms (e.g. environmental asymmetry), one generally considers an orbitally non-degenerate ground state and hence the only contribution to the electronic entropy change is from the ms-spin multiplicity, i.e. which amounts to 13.4 J K−1 mol−1 for an S = 0 ↔ S = 2 transition [4].
Concentrating on intramolecular effects, the vibrational entropy difference arises from changes in vibrational frequencies between the LS and HS states [33]. The temperature-dependent vibrational density-of-states can be expressed in terms of the vibrational partition functions [33,34], which leads to temperature-dependent functions for and ΔH(T) (both of which are increasing functions of temperature for ). Hence the use of constant values for ΔS and ΔH (as per Eq. (1)) is not strictly correct, and the procedure is generally justified as yielding values at the experimental transition temperature: ΔS(T1/2), ΔH(T1/2). Except for a few reports where the more rigorous treatment is considered (e.g. Refs. [30,35]), most of the literature values are based on fitting with temperature-independent parameters. As ΔS(T) is an increasing function of T, for SCO complexes with a relatively low T1/2 the fitted values of ΔS and ΔH should then be systematically lower. This may account in part for the relatively low value of ΔS = 24 J K−1 mol−1 reported here.
It is also compelling to note, however, that from the scarce number of quantitative reports on Fe(II) SCO transitions in doped polymer samples, a previous study on Fe(2-mephen)3(ClO4)2 also yielded rather low estimates of ΔS = 22.4 and 28.2 J K−1 mol−1 (for host matrices of PVAc and Nafion, respectively, with T1/2 ≈ 140 K in both cases) [36]. These authors remarked that one expects a quite large spread of the SCO thermodynamic parameters over the molecular ensemble due to an inhomogeneous polymer environment. We assume here that the dominant effect of such an inhomogeneity is a resultant distribution of the enthalpy difference ΔH between the HS/LS states. This enthalpy change ΔH = ΔE + pΔV includes not only the electronic energy difference ΔE between HS and LS states, but also the molecular volume change ΔV via the work term pΔV where p is the effective environmental pressure. Hence the distribution of ΔH can arise both from variation in the electronic polymer-complex interactions, as well as local fluctuations in the polymer host rigidity.
We have performed simple numerical simulations of the expected SCO transition behavior for an ensemble with a Gaussian distribution of ΔH about a mean value (based on parameter values suitable for the present case and a fixed value of ΔS) and studied the apparent ΔS and T1/2 values that result from fitting the ensemble-averaged SCO data. As can be understood intuitively, a distribution of ΔH values results in a more gradual average SCO curve, which in turn yields a systematically lower value for the fitted ΔS (although the fitted value of T1/2 is less sensitive to the distribution due to the linear dependence on ΔH). In relation to the present case, assuming a standard deviation in ΔH of ∼20% about a mean of 4.4 kJ mol−1 and a true value of ΔS = 33 J K−1 mol−1 (with a corresponding mean T1/2 = 135 K), a fit of the resultant numerical ensemble-average SCO curve results in an apparent value of ΔS = 24 J K−1 mol−1 (and an apparent T1/2 = 141 K). Hence we conclude that the low fitted value of ΔS from the MCD data in Fig. 4 is quite plausibly due to such effects. This strongly motivates an independent measure of the SCO transition in the same polymer environment, e.g. by monitoring absorption changes vs temperature, as well as studies of such effects in different polymer hosts.
In comparing the estimated SCO transition temperatures in the polymer host sample (T1/2 = 135 K) with that in the microcrystalline powder measurement (T1/2 = 163 K), we note that both the Slichter–Drickamer model [4,23] and domain model [4] do not in fact predict a change in T1/2 due to intermolecular cooperativity effects alone (for the SD model, we refer here to the weak coupling regime where no hysteresis is predicted). As mentioned above, an important influence on the SCO temperature can arise from the dependence of the enthalpy change ΔH on the work term pΔV. Hence one contribution to the reduced value of T1/2 in the polymer thin film in comparison to the microcrystalline environment may be due to the fact that the polymer host is more easily deformed to accommodate the increase in the volume of the complex during the LS → HS transition, i.e. with a lower effective environmental pressure p. Any remaining contributions to a different ΔH value in the polymer vs crystal environment presumably arise from changes in the molecular conformation and electronic medium effects. Nevertheless, given that the rigidity of the polymer medium is known to depend on temperature [37], an open question remains as to whether a temperature variation in p should also be taken into account in the SCO model.
5 Conclusion
We have demonstrated that the MCD technique allows a characterization of the ground-state magnetization (or spin multiplicity) of the Fe(II)(stpy)4(NCSe)2 LD-LISC complexes in dilutely doped polymer thin films. The VT–VH MCD data for the HS all-cis complex can be fitted with model parameters consistent with the expected electronic environment of the Fe(II) core based on the crystal structure (i.e. with a positive axial ZFS), where the electronic transition possesses a non-planar Fe(II) → stpy MLCT character. The VT MCD data for the HS ↔ LS SCO all-trans complex allows one to clearly observe the SCO transition in the polymer environment. Despite the inability to extract precise quantitative SCO parameters with the current data, one can infer the qualitative changes between microcrystalline and polymer host environment, i.e. significantly reduced values of both the SCO onset temperature and T1/2. In order to best observe photoinduced spin-state changes in doped polymer thin films (i.e. where the all-trans complex is predominantly LS), one needs to use a temperature considerably lower than that suggested by powder magnetization SCO measurements (i.e. the SCO onset occurs at ∼120 K in a microcrystalline powder and ∼50 K in the polymer environment). Given that the cis–trans photoisomerization quantum efficiencies fall away at lower temperatures (due to the increasing rigidity of the surrounding polymer medium [37]), one must carefully consider the optimal temperature for observation of the LD-LISC effect. Nevertheless, the results presented here indicate that MCD should be applicable to measure time-resolved changes in magnetization during irradiation of such LD-LISC complexes in polymer thin films.
6 Experimental and analysis
6.1 Synthesis
Syntheses of ligands and complexes were carried out in the absence of light to prevent any photoisomerization of the photoactive –CC– group. Trans-4-styrylpyridine and cis-4-styrylpyridine were prepared as previously described in Ref. [10]. 1H NMR chemical shifts (ppm) and coupling constants (Hz) in CDCl3: For trans-4-styrylpyridine: dd, 8.57, J = 6 (2H), dd, 7.53, J = 9 (2H), m, 7.37 (5H), d, 7.09, J = 6 (1H), d, 6.99, J = 16 (1H). For cis-4-styrylpyridine: dd, 8.45, J = 6 (2H), m, 7.24 (5H), dd, 7.11, J = 6 (2H), d, 6.82, J = 12 (1H), d, 6.52, J = 12 (1H). IR spectra provide specific frequencies of both isomers 972 (trans-stpy) and 879 cm−1 (cis-stpy).
The metal complexes were synthesized according to the procedure described by Roux et al. [10] except that KNCS was replaced by KNCSe. The microcrystalline samples were colored orange-red (trans-isomer) and light orange (cis-isomer). Single-crystals suitable for an X-ray analysis were obtained for both samples. The corresponding crystal structures will be described in a future publication. Elemental analysis calcd. for C54H44N6Se2Fe: C, 65.31; H, 4.47; N, 8.47. Found for the powder of Fe(trans-stpy)4(NCSe)2 C, 65.00; H, 4.65; N, 8.52. Found for the powder of Fe(cis-stpy)4(NCSe)2 C, 63.98; H, 4.44; N, 8.28. IR data (293 K): 970.4, 961.9 cm−1 (all-trans) and 879.9 cm−1 (all-cis); C–NNCSe vibrations at 2065 (all-trans) and 2062 cm−1 (all-cis).
6.2 Powder magnetic susceptibility measurements and analysis
The temperature dependence of the magnetic susceptibility was carried out on samples of typical weight 15–20 mg using a Quantum Design SQUID magnetometer (MPMS5S model) calibrated against a palladium sample. The measurements were carried out with an applied magnetic field of 1000 Oe (all-cis) and 5000 Oe (all-trans).
In order to fit the χMT data for the all-trans SCO complex (Fig. 1(b)), we assume that , i.e. with (χMT)LS = 0, where γ(T) is the high-spin fraction which in the Slichter–Drickamer model [23,4] is given by the implicit expression:
| (2) |
6.3 Thin film preparation and UV–vis measurements
The doped polymer thin-film samples consisted of poly(methyl methacrylate) (PMMA) containing ∼2–3 wt-% of the all-cis or all-trans complex. In a typical procedure, ∼40 mg of PMMA and 1–1.5 mg of the Fe(II) complex were dissolved in ∼1 mL of chloroform and spin coated onto fused silica substrates. The low-temperature doped polymer thin-film absorption measurements were performed using a Varian Cary 5E double-beam spectrophotometer equipped with an APD Cryogenics closed-cycle helium cryogenic system including a DMX-1E cryostat and a DE-202 expander.
6.4 MCD measurements and analysis
6.4.1 UV–vis MCD measurements
The UV–vis MCD measurements were made on the doped polymer thin-film samples mounted in a superconducting magnetic cryostat (Oxford Spectromag) capable of operation over between B = 0–±9 T and T = 1.5–500 K.
The light from a fiber-coupled deuterium-halogen lamp (Ocean Optics DH2000-DUV) was passed through a grating monochromator (Solar TII, S3804, band-pass ∼5 nm FWHM) and delivered to the main experiment via a second multimode fiber. A linear polarization was imposed using a Glan–Taylor polarizer (<10−5 extinction ratio), followed by a photoelastic modulator (PEM, Hinds Instruments PEM-90 with a I/FS50 head, fixed modulation frequency: 50 kHz) in λ/4-mode with its modulation axes at 45° to the linear polarization to produce alternating circular polarized light. The beam was then focused through the Oxford cryostat and recollimated using two 250-mm focal-length fused silica lenses, and focused onto the detector (a Hamamatsu AC-coupled UV–vis avalanche photodiode (APD), model C5331). The detector voltage output was amplified by 40 dB (Femto DHPVA) and sent to a lock-in amplifier (EG&G 5302) with the lock-in reference supplied by the PEM controller. The wavelength stepping of both the monochromator and PEM was controlled by a computer program which also recorded the lock-in signal and temperature/field values from the Oxford cryostat controllers (ITC-503/IPS-120-10). As the APD detector is AC-coupled, in order to establish the background spectrum (for calculating the MCD modulation depth) we inserted a second Glan–Taylor polarizer before the detector, switched the PEM to λ/2-mode and measured the AC lock-in signal at the second harmonic (100 kHz). It is straightforward to show that the peak Faraday rotation is related to the lock-in signal by , where is the ratio of the raw MCD and background signals, and is a correction factor that accounts for the sinusoidal modulation of the PEM retardation (where denotes the nth-order Bessel function).
The VH data (for each constant temperature) for the all-cis complex were corrected for zero-field and even-order-field artifacts by anti-symmetrization of the B > 0 and B < 0 data, whilst the VT data were corrected for a constant base-line by comparison of the B = +8 and −8 T scans. For the all-trans VT data, a small residual signal after base-line correction was subtracted, as noted in the main text.
6.4.2 MCD model and fitting procedure
Following Ref. [26], we write the MCD signal as:
| (3) |
Acknowledgments
We wish to thank Jauffrey Ferré for his active participation in the synthetic work, Joelle Sainton for the NMR measurements, and Frank Neese and his group (MPI für Bioanorganische Chemie, Mühlheim) for preliminary MCD measurements and support with the MCD analysis. Financial support from the MAGMANet NoE of the European Union (Contract: NMP3-CT-2005-515767-2), and DFG Forschergruppe 412 are gratefully acknowledged.
1 It should be noted that a symmetry-forbidden n–π∗ transition could also be present in these stpy systems due to the lone pair of the pyridine N atoms (e.g. [39]). Such a band feature is not resolvable in the spectra of the isolated ligands, and if present, is most likely completely masked by the π–π∗ band. Hence we tend to rule out an n–π∗ assignment for the 400-nm band of the Fe complexes, as it would require that coordination to the Fe core would red-shift the n–π∗ excitation by at least several 1000 cm−1. Moreover, it is unlikely that the transition involves significant charge transfer to the anionic ligands X−, which do not possess such low-lying π∗ orbitals as the stpy ligands.