

1 Introduction
Interfacial properties of ionic liquids have been examined by computer simulation in recent years. These studies concern simple alkali halide electrolytes as well as the more complicated room-temperature ionic liquids. Size asymmetry effects are now well characterized, but no consideration has yet been given to the role of charge asymmetry. Recently, we have developed a first-principle-based simulation model for mixtures of lithium fluoride (LiF) with beryllium fluoride (BeF2), which accurately reproduced the properties of the real liquid [1]. In particular, the density of the melts was accurately reproduced and the computation of dynamic properties like the conductivity or viscosity gave results in perfect agreement with experimental data. The simulations allow the nature of the various fluoroberyllate ions and their concentration to be determined for different compositions of the melt. As in this system the beryllium cation carries a +2 formal charge, it presents an opportunity to examine the importance of charge asymmetry on the interfacial properties as well as the way the fluoroberyllate ions are accommodated at the interface.
Furthermore, from a practical point of view, it is crucial to understand interfaces, since their properties can dramatically impact kinetics, or transport in systems involving liquid molten salts. “FLiBe” itself is an important solvent and heat-transfer material in numerous proposed nuclear technologies, including the molten-salt reactor and the fusion-breeder reactor. In the case of Generation IV molten-salt reactors, interfaces will certainly play a role in corrosion, and predicting wettability is also important to assign good boundary conditions in thermo-hydraulic process models. To address feasibility and reliability of such predictions, we simulated a liquid–vapor interface of molten LiBeF3 (equimolar LiF–BeF2). The technical details of the model, which accounts for anion polarization, and methods used are first described. The second part of this work is devoted to the study of the structure of the interface, which differs a lot from the charge-symmetric system: in particular an important charge separation phenomenon appears, and the local concentration of beryllium cations close to the surface is enhanced. Finally the profile followed by the electrostatic potential along the liquid is presented, and the surface tension is estimated: the result obtained matches well with the experimental data.
2 Technical details
The interaction potential used in those simulations is a “polarizable-ion model” and consists of a pair potential of Born–Mayer form together with an account of ionic polarization [2]. The pair potential is written as:
| (1) |
| (2) |
Values for all parameters necessary to simulate mixtures of LiF with BeF2 are given in Table 1. A full account of the determination of these parameters is given in Ref. [4]. All the parameters are given in atomic units; the atomic unit of length is the Bohr radius, 0.52918 Å, and of energy, the Hartree, 4.3597 × 10⁻¹⁸ J. The polarization part of the potential includes fluoride ion polarization only. We used a fluoride ion polarizability of 7.09 Bohr3 and applied a damping function:
| (3) |
Potential parameters
| Ion pair | Bij | αij | ||||
| F−–F− | 181.84 | 2.267 | 15.0 | 150.0 | 1.9 | 1.9 |
| F−–Be2+ | 41.72 | 2.254 | 0.0 | 0.0 | 1.0 | 1.0 |
| F−–Li+ | 20.42 | 2.052 | 0.0 | 0.0 | 1.0 | 1.0 |
| Be2+–Be2+ | 106.16 | 3.944 | 0.0 | 0.0 | 1.0 | 1.0 |
| Li+–Li+ | 195.91 | 4.252 | 0.0 | 0.0 | 1.0 | 1.0 |
| Be2+–Li+ | 0.00 | 1.000 | 0.0 | 0.0 | 1.0 | 1.0 |
to the interaction between the anion dipoles and the cation charges, with bFBe = 1.78 au−1, bFLi = 1.81 au−1, cFBe = 0.99 and cFLi = 1.40.
The simulation box consists of a slab with square cross-section (of lateral dimension L and perpendicular dimension D), periodically replicated in all spatial directions. A vacuum region is created “above” and “below” this slab. The experimental vapor pressures of these systems are so low that very long simulation times would be needed to observe an evaporation event [5–7]. Thus, in practical terms, our simulated liquid–vapor interface is in reality a liquid–vacuum interface. The simulation supercell therefore has dimensions L × L × Lz, with Lz = D + Lvacuum. The long-range electrostatic interactions are dealt with by employing a three-dimensional (3D) Ewald summation method, with vacuum boundary conditions in the direction perpendicular to the interface (conducting boundary conductions are employed in the two lateral directions). The following terms then have to be added to the energy, forces and pressure tensor resulting from the usual Ewald sum with conducting boundary conditions [8]:
| (4) |
| (5) |
| (6) |
The method employed to enforce canonical (NVT) ensemble sampling is the Nosé–Hoover chain thermostat method [11,12]. The system consisted of 576 F−, 192 Be2+ and 192 Li+ ions, and we studied it at a temperature of 1060 K, which is the temperature for which experimental surface tensions of the mixtures of LiF with BeF2 were obtained [13]. The lateral length L of the simulation box was obtained by performing a bulk simulation of the system in the NPT ensemble following the method described by Martyna et al. [14], with a pressure fixed at 0 GPa. We obtained a value of 34.56 Bohr for L, and Lz was set to 210 Bohr. We used a time step of 0.5 fs and the system was simulated for 1.35 ns. A snapshot of the simulation box is shown in Fig. 1.
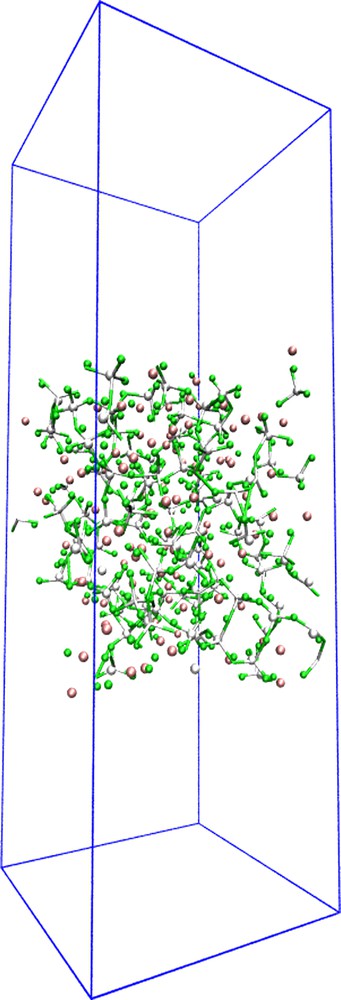
Example of a snapshot of a simulation box (green: F− ions, white: Be2+ ions, and pink: Li+ ions).
3 Results
3.1 Structure of the interface
In order to study the structural properties of the interface, we have constructed the density profiles along the direction perpendicular to the interface. The simulation cell is divided into Nbin narrow bins, each of width δz = Lz/Nbin. We have then calculated profiles of the ionic number density:
| (7) |
- • at the edge of the bulk, where the Li+ concentration already begins to decrease, appears a Be-enriched zone in which the Be2+ concentration becomes greater than its bulk value;
- • then, in the outer region of the interface, the Be2+ concentration drops abruptly and reaches values smaller than the Li+ concentration. In this zone, the overall density is low compared to the bulk.
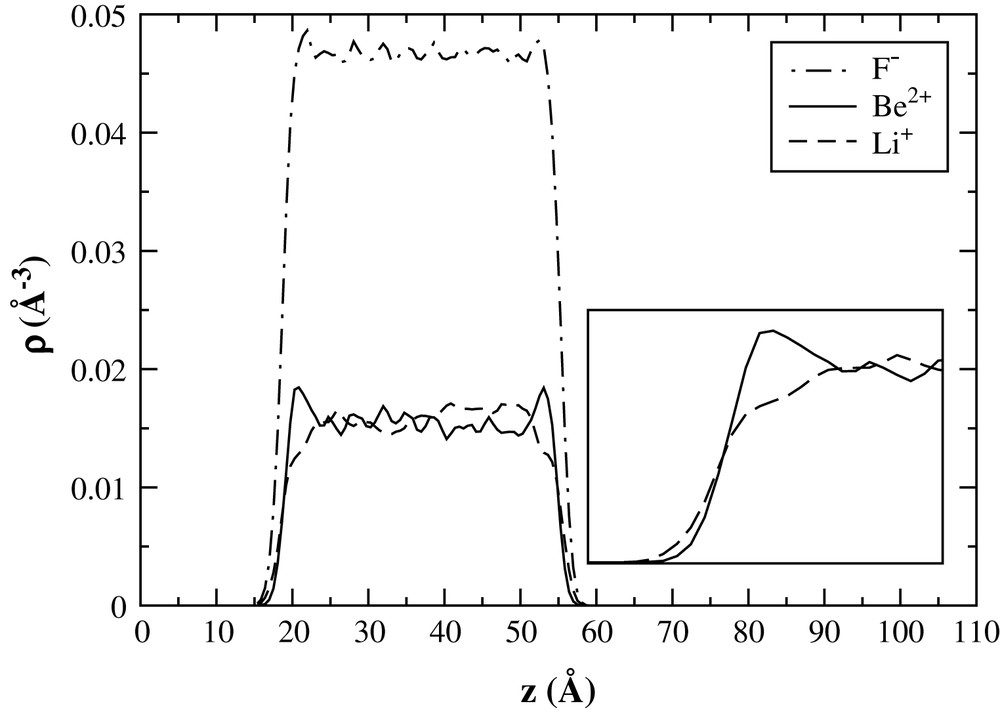
Ion density profiles.
Studying the coordination number profiles of the two cations might give an explanation of the particular aspect of the density profiles across the interface. To do so, we considered an anion to be in a cation's coordination shell if the distance between them was smaller than the position of the first minimum of the corresponding radial distribution function (these functions are given for this system in Ref. [1]), namely 2.1 Å for Be–F and 2.7 Å for Li–F. The profiles obtained are given in Fig. 3 (in which the F− ion density profile also appears to help interpretation). This shows that Be2+ ions are always tetracoordinated, even through the interface, while the Li+ ions coordination number decreases quite continuously. The units then remain intact at the interface. In our previous study [1] we showed that the system consisted of a corner-linked network of units, so that two types of fluoride ions can be considered: bridging and terminal fluorides. Of course, at the interface with vacuum all the fluorides are terminal and so there is an excess of negative charges that can only be filled in by lithium ions. This explains the bigger concentration of lithium in the outer part of the interface, which is a consequence of maintaining local charge neutrality.
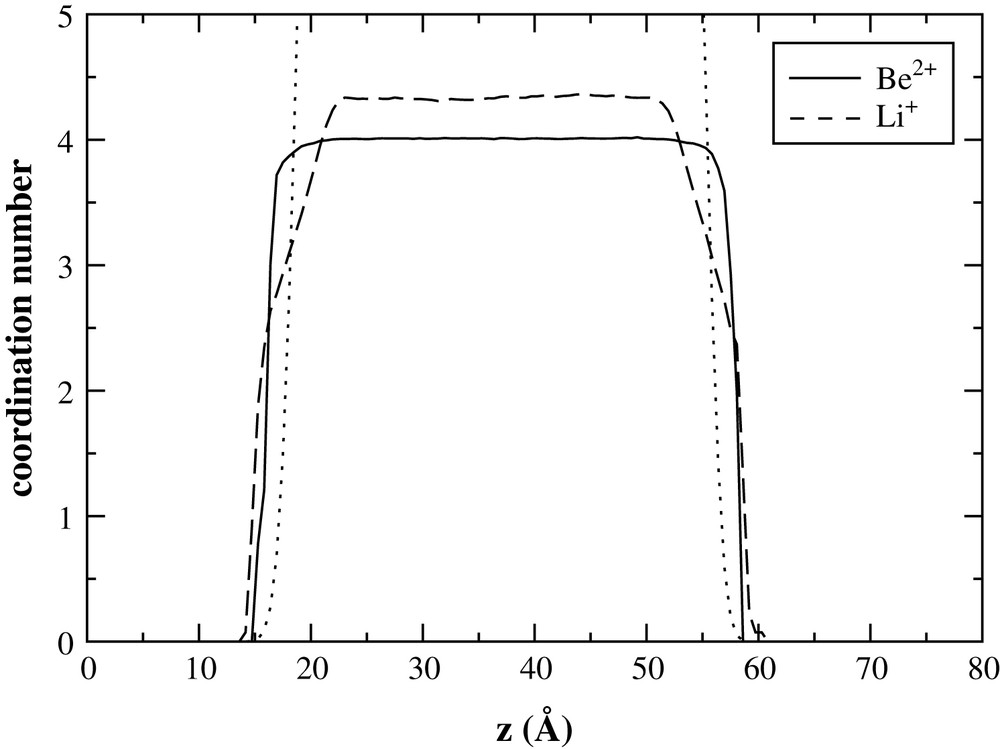
Coordination number profiles. The dotted line corresponds to the F− density profile (in arbitrary units).
Still, this is not sufficient to explain the segregation of the Be2+ ions in the inner part of the interface. Bresme et al. showed that size asymmetry could cause this type of effects [15]: in their study, the bigger anions have a higher concentration at the interface. Madden and Aguado also observed such effects in equimolar mixtures of KCl with NaCl and LiCl [16], in which the bigger potassium ions were more concentrated at the interface. In LiBeF3 the segregation is much more important and cannot be explained by size-asymmetric effects only. At this concentration of LiF, an extended network of corner-linked tetrahedral units has already been formed, and we can only imagine that the higher concentration of the Be2+ at the interface can be associated with a stabilization of this network. Indeed, near the vapor phase the density decreases and so the chains present in that region acquire more degrees of freedom for their conformational motion. Such effects are observed in room-temperature ionic liquids: in their study of the surface structure of butylmethylimidazolium ionic liquids, Lynden-Bell and Del Pópolo showed that the surface is structured with a top monolayer containing oriented cations and anions [17], and that the butyl side chains of the cations tend to face the vacuum, while the methyl side chains tend to stay in the bulk of the liquid. An alternative explanation for the segregation is that an excess of polarizable particles at an interface lowers the surface energy [16]. This would imply a tendency of the fluoride ions to occupy the surface and therefore to drag the Be2+ along with them.
On passing from the surface into the bulk, one can observe that the Be2+ and Li+ profiles do not tend to a perfectly constant value and show a number of oscillations, with local regions of alternating Be2+ and Li+ excess. This type of oscillatory structure has been seen in diffraction studies of the surfaces of liquid metals; recent progress on this topic is reviewed in Ref. [18]. In their study on mixtures of KCl with NaCl, Madden and Aguado observed that potassium segregation towards the surface leads to a local Na+ excess in the bulk, and that this excess translates along the direction perpendicular to the interface, bouncing back and forth from the two ends of the slab. They showed that 5 ns of dynamics were necessary to average out these fluctuations, after which no oscillatory structure was observed. In our study, the Be2+ segregation at the interface is far more pronounced, so that the possibility of an oscillatory concentration profile seems more likely. To really confirm this possibility would require longer runs than we have so far attempted. We have chosen to study a wide slab but on a relatively short timescale, in order to get completely independent interfaces. The Be2+ excess at the interface appears stationary, so the interface itself is well sampled in our simulations, but the oscillatory nature of the Li+ profile must be confirmed in longer runs.
3.2 Electrostatic potential
A consequence of the arrangement of the ions close to the interface is the formation of charge ordering. The excess of F− in the outer part leads to an excess of negative charges in that region, which is followed by an excess of positive charges in the Be2+ rich region. The charge distribution ρq(z) is shown in the upper part of Fig. 4. This leads to a local violation of the electroneutrality condition. The resulting electrostatic field, E, can be computed using Gauss's theorem:
| (8) |
| (9) |
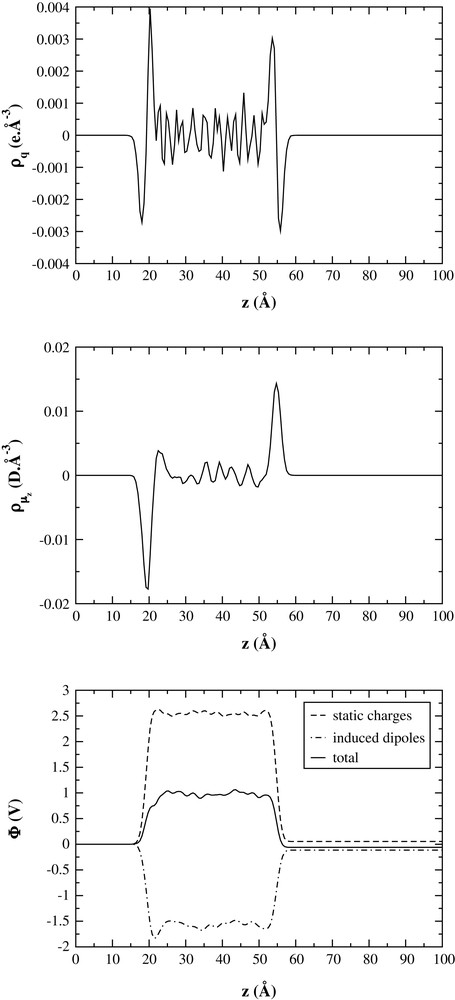
Charge density, induced dipoles' density and electrostatic potential profiles.
However, there is a second contributor to the electrostatic potential due to the induced dipole moment associated with each F− ion. On an average, the induced dipoles of the surface F− ions tend to be oriented so that their negative ends point towards the bulk, as can be seen in the middle part of Fig. 4. The induced dipole contribution to the surface potential can also be computed [19] (ρμ(z) is the z-component dipole moment density):
| (10) |
3.3 Surface tension
The surface tension has been obtained through its mechanical definition:
| (11) |
An interesting aspect of the experimental results, which were obtained for compositions of the melt ranging from pure LiF to pure BeF2, is that for a given temperature the surface tension has a minimum at about 40 mol% of BeF2. The authors attributed it to the formation of complex fluoroberyllate ions. This is in total agreement with the increase in fluoroberyllate concentration at the interface noted in the earlier section. For concentrations between 33.3 and 100 mol%, the variation of the surface tension is small, which might be due to the fact that the fluoroberyllate concentration varies less at the interface than in the bulk. The study of the interface structure for other compositions of the melt would be interesting to address this point.
4 Conclusion
In this paper we have shown that charge asymmetry in LiBeF3 had important effects on its interfacial properties. Fluoroberyllate species formed in this liquid are stabilized at the interface, leading to a local enhancement of the Be2+ concentration. We show that this segregation leads to important charge-separation effects at the interface. An electronic dipole moment is also created at the interface, which softens the electrostatic potential variation across the interface. Still, this electrostatic potential reaches higher values than in the case of size-asymmetric ionic liquids. The surface tension of the liquid has also been computed and the value is in good agreement with experimental measurements. The concentration of fluoroberyllate species at the interface seems to be responsible for the slow variation of the surface tension with composition in BeF2-rich mixtures of FLiBe. Future works will explore the evolution of all that properties with charge asymmetry by studying systems containing highly charged species (MF3 and MF4).
Acknowledgements
The authors would like to acknowledge the support of the European Commission's Research infrastructures activity of the Structuring the European Research Area programme, contract number RII3-CT-2003-506079 (HPC-Europa). Financial support of PCR-RSF (Programme concerté de recherches – Réacteur à sels fondus) is gratefully acknowledged.