

1 Introduction
Cement-based materials have been used for a long time in the oil and gas industry for cementing oil wells [1]. The main role of the cement sheath is to permanently isolate all subsurface formations penetrated by the well [2]. These drilled geological formations contain fluids whose compositions are different from the cement pore solution. This difference in composition induces chemical reactions which may lead to physico-chemical alteration of the hardened cement paste. Consequently, some leakage of formation fluids from deep geological layers to shallow aquifers or to the surface can occur through the altered cementitious matrix or rock–cement–casing interfaces. Until very recently, the oil and gas industry was mainly interested in short- or medium-term integrity of the cement sheath. The investigations on the short-term cement sheath integrity were carried out to avoid costly problems during hydrocarbon production. With the growing interest for environmental concerns, the long-term durability of the cement-based materials used for well construction has become of paramount importance. For instance, in the case of CO2 geological storage envisaged to mitigate the greenhouse gas effect, the durability of cementitious materials has to be ensured for thousands of years to guarantee the confinement of the re-injected gas underground. Many studies have been devoted to cement paste, mortar or concrete durability under conventional temperature and pressure conditions (25 °C, 105 Pa) [3,4]. The purpose of these studies was to understand long-term behaviour of cement-based materials used for nuclear waste repository [5,6]. However, microstructures and mineral assemblages of hardened cement pastes cured at elevated temperatures and pressures differ from those of pastes cured under atmospheric conditions [7,8]. Besides, the detailed mechanisms of cement degradation under down well conditions are less documented [9,10].
The curing conditions of the cement paste used in durability studies appeared to be of the utmost importance [11–15]. During leaching, a concentration gradient is created between pore solution of the cement paste and the aggressive fluid, recovered by ionic diffusion. This phenomenon implies non-equilibrium conditions between the hydrated phases and the interstitial solution of the cement paste. Moreover, the rate of the degradation is strongly linked to the fluid pH used for the leaching test, the types and amounts of hydrated phases involved in the reactions. During leaching tests, Portlandite (pH stability equal to 12.6), C–S–H (pH stability of 10–11), calcium aluminate and ferrite hydrates are successively dissolved [16,17]. The rate of degradation depends also on temperature and the type of fluid renewal (periodical or continual renewal).
The aim of the present work was to study the effect of different curing regimes on cement paste behaviour during leaching experiments, and to simulate the observed changes via a reactive transport code. First the boundary conditions experienced by the cement paste in the well were reproduced at the laboratory scale. In order to simulate the oilwell cement hydration under down well conditions, two curing conditions for the cement paste in the well were assessed. Indeed, the cement paste placed between geological formations and casing is altered by the fluids contained in the drilled rock formations as soon as it is put in place in the well. Another part of the cement sheath in contact with the casing or a cement plug set inside the casing string is not exposed to formation water during the setting and it is therefore protected against aggressive brine. Taking into account these two boundary conditions, two curing modes have been considered in our work. The first one, called “with exchange”, reproduces the curing conditions of the cement paste placed between geological formations and casing; the second one, “without exchange”, corresponds to the cement sheath in contact with the steel casing (or the cement barrier set inside the casing to plug the well). Experiments were simulated using a reactive transport code HYTEC, imposing experimental domain (geometry of the leaching device and of the samples), physical and chemical environments (for the brine and the cement pastes) and boundary conditions (imposed flow rate during leaching tests).
2 Materials and methods
The anhydrous Class G CEMOIL Portland cement was obtained from Italcementi company. The Bogue composition [18] is given in Table 1. The cement powder was mixed with distilled water with a water/cement ratio (w/c) of 0.44. Before curing and leaching periods, the specimens were hardened in cylindrical moulds (diameter = 40 mm, height = 70 mm) for 16 h in a pressurised cell (7 × 10⁶ Pa) at 80 °C. The pressurised cell was filled with water saturated with Ca(OH)2, NaOH and KOH to prevent any ion diffusion out of the cement interstitial solution and thus a pre-alteration during the hardening.
Bogue composition for the Class G oilwell cement (wt.%) – in cement chemistry abbreviation, C = CaO, S = SiO2, A = Al2O3 and F = Fe2O3
| C3S | C2S | C4AF | C3A |
| 62.2 | 12 | 12.2 | 2.2 |
Then the boundary conditions experienced by the hardened cement paste in the well were reproduced at the laboratory scale. After the initial hydrating period, cement paste was cured for 1 month at 80 °C and 7 × 10⁶ Pa, following two curing modes.
One half of the cement paste specimens was cut into cubes (20 mm of size). The cement paste monoliths were placed on Teflon® grooved discs in a specific cell, filled with the brine used by Le Saoût et al. [9] (composition given in Table 2), where pressure was imposed with N2. For this first curing condition, ionic species' diffusion between formation water and cement pore solution occurs. In the following, these samples were called “with exchange” and reproduced the cement paste located at the geological formation-primary cementing interface.
Chemical composition of brine
| Species | Ca2+ | Cl− | HCO3− | K+ | Mg2+ | Na+ | SO42− |
| Concentration (mmolal) | 4.1 | 376 | 6.4 | 33.5 | 1.5 | 343 | 2.3 |
The second half of the specimens was placed directly in sealed containers to prevent any matter exchange. The sealed containers were put in N2-pressurised cells. Such a protocol allowed us to reproduce the cement-casing interface (samples called “without exchange”).
All the pressurised cells were placed in an oven at 80 °C.
After 1-month of curing, “without exchange” samples were cut into 20 mm cubes. The two sets of cement paste specimens were separately leached for 1 and 3 months at 80 °C and atmospheric pressure by the brine (composition given in Table 2). Samples were directly put in a four-litre High Density Polyethylene tank, corresponding to a cement surface/fluid volume ratio (S/V) of 0.02. In the tanks, cement cubes were maintained on a stainless steel mesh support (Fig. 1). The two tanks were filled with the brine, and placed in an oven at 80 °C. The brine was continuously renewed with a flow rate of 0.5 l per day thanks to a peristaltic pump. Leachants were collected separately.
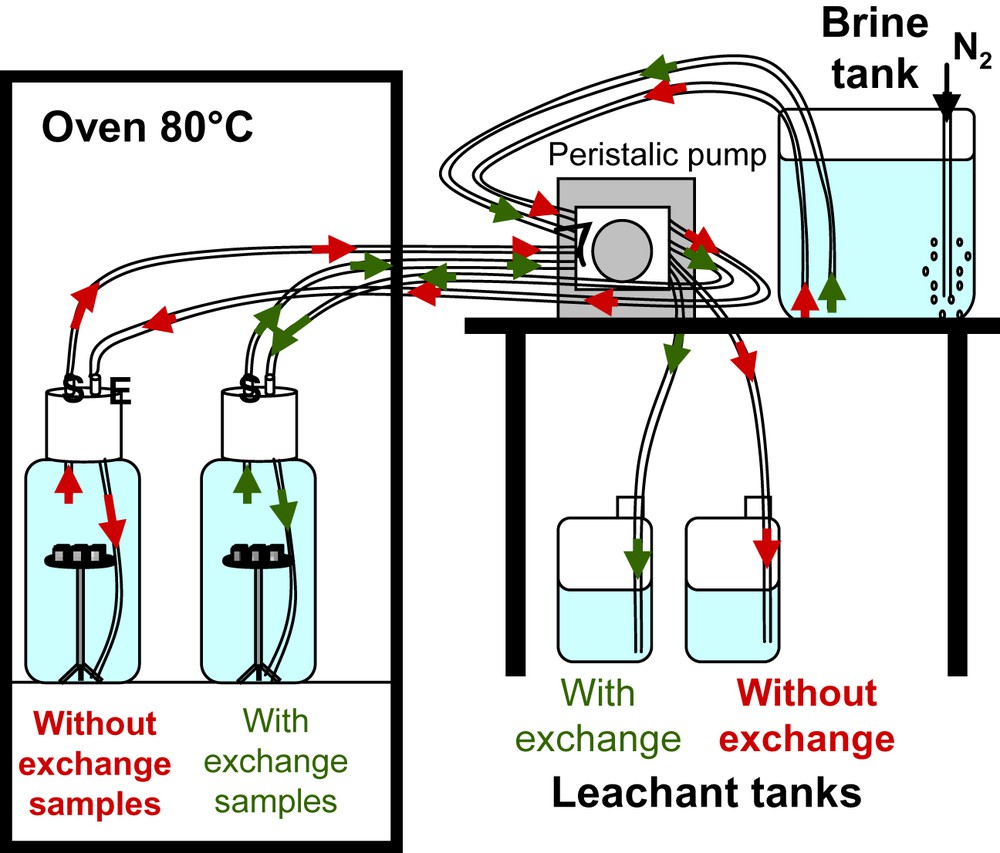
Experimental set-up for the cement paste leaching tests.
The cement pastes were first characterised both after the 1-month curing and after the 3-month leaching test, in order to identify and understand physico-chemical mechanisms leading to cement degradation. Thermogravimetric analysis (TGA) and X-ray diffraction (XRD) were performed on homogeneous powdered samples. Thermal analysis consists in measuring the mass variations of a sample during a thermal treatment. This technique allows to quantify the amounts of Ca(OH)2 and CaCO3. The thermobalance instrument used for this work was a NETZSCH STA 409 C. To prevent cement carbonation during analyses, Argon flowed into the chamber (flow rate = 75 ml/min). Samples were submitted to temperatures ranging from 20 to 1080 °C. The ramp rates were as followed: temperature increase from 20 to 105 °C with a step of 2 °C/min, stabilization at 105 °C during 75 min and temperature increase from 105 to 1080 °C with a step of 3 °C/min.
XRD experiments were performed on a BRUCKER AXS D8 ADVANCE using the Co Kα radiation (Kα = 1.78 Å). The X-ray patterns were acquired in the 2θ (5–99.9°) interval with a step of 0.036° and 7 s per step. This method allowed crystallised phases' identification.
Samples were observed with a Scanning Electron Microscope (SEM). Prior to SEM observations, the cement monoliths were impregnated with Araldite® resin, cut into slices, and polished using silicon carbide (SiC) discs and diamond pastes of different meshes. The polished sections were then coated with carbon. The scanning electron microscope was a FEI QUANTA 200 coupled with a ROENTEC Energy Dispersive Spectrometer. The analysis conditions were 20 kV for the accelerating voltage, 10.1 mm for the working distance and the counting time was 40 s per point range for semi-quantitative chemical analyses.
Mercury intrusion porosity (MIP) allowed us to measure porous properties before and after leaching tests. Before MIP measurements, all specimens have been dried up at temperature of 80 °C during one night. Porosity of hardened cement paste was measured by means of high pressure porosimeter Micromeritics AutoPore IV 9500 with pressure range up to 413 MPa. The porosimeter measures a minimal access pore diameter of 3.6 nm.
Modelling of cement paste leaching is a very efficient way to predict the cement paste evolution over geological time scale (timescale to consider for the underground CO2 storage) [19–21]. HYTEC is a coupled reactive transport model developed by École des mines de Paris [22–24]. The model is used for groundwater pollution studies, safety assessment of nuclear waste disposals, geochemical studies and interpretation of laboratory column experiments [24]. Indeed, the numerical code takes into account geochemical heterogeneities and calculates physical parameter variations (e.g. porosity and diffusion coefficient) resulting from mineralogical changes (dissolution/precipitation) leading to variations of the mineral volume. Moreover, the effective diffusion coefficient is calculated as a function of porosity variation by the following modified Archie's law:
Chemical speciation is executed by CHESS module thanks to a thermodynamic database which allows chemical equilibrium state between different phases (aqueous and gaseous species, minerals, colloids etc.) within a system. Thermodynamic equilibrium state is solved by the basis component method according to an improved Newton–Raphson algorithm. HYTEC uses also R2D2 that is a two-dimensional flow and transport module based on the representative elementary volume (REV) approach with finite volume calculation [25]. In HYTEC, transport is coupled to chemistry according to the following equation [26,27]:
3 Results
3.1 After curing
After 1-month of curing at both high temperature and high pressure, crystallised phase identification of “without exchange” specimens by XRD analysis showed the presence of unhydrated cement phases Alite (C3S), Belite (C2S), Ferrite phase (C4AF) (in cement chemistry abbreviation, C = CaO, S = SiO2, A = Al2O3 and F = Fe2O3). A poorly crystallised calcium silicate hydrate (C–S–H) was identified. Hydrated phases such as portlandite CH and katoite C3ASH4 were detected. Katoite belongs to the hydrogrossular solid solution C3AS3−xH2x (where x = 0 → 3) [28,29], was formed whereas ettringite (AFt) was not detected in such hydrating conditions. This result agrees with other studies, where the AFt phase at elevated temperature was generally not observed [3,30] in such a system because of AFt stability decreasing as a function of temperature [31–34]. Mass losses determined by TGA/DTG are shown in Fig. 2. A mass loss at 380 °C could be attributable to calcium monosulfoaluminate hydrate, though this mineral was not observed by XRD, may be due to very small crystals intermixed with C–S–H as shown by Taylor [33]. A mass loss at around 500 °C corresponded to portlandite decomposition and revealed the presence of about 20 wt.% of this phase. Another weak mass loss was detected at about 700 °C that corresponded to calcite decarbonation. The calcite content is expected to be low in unattacked cement paste (from 2 to 5 wt.%). This mineral was also observed by XRD. SEM/EDS analyses showed that C–S–H phase had a Calcium/Silicium (C/S) ratio close to 2 which is typical for a neat cement paste. Porosity of the cement paste was about 28%.
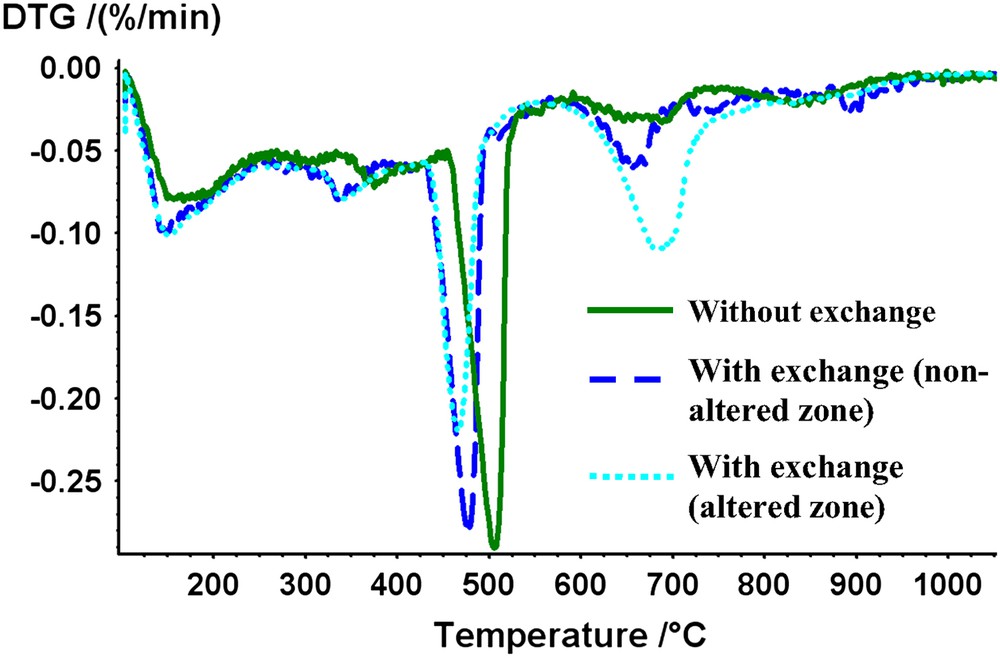
DTG curves for cement pastes cured for 1 month.
A 100 μm thickness degraded zone was observed by SEM in the case of the “with exchange” specimens (Fig. 3a). Calcium cartography showed a depletion of calcium concentration in the degraded zone (Fig. 3b) that corresponded to a cement matrix decalcification. This phenomenon was not observed for the “without exchange” samples (data not shown). Fig. 2 shows TG curves for both the zones. In the decalcified zone, portlandite has been partially dissolved; the average portlandite content was about 11 wt.%. SEM analyses confirmed the appearance of the calcite in the outer layer of the samples (about 13 wt.%). Moreover, EDS analyses showed that C/S ratio of C–S–H ranged from 1.5 to 1.75, whereas C/S ratio was about 2 in the centre of the monolith. The average porosity value for the outer zone of these samples was about 30%. Because of the small thickness of the degraded zone this value integrated a non-degraded part.
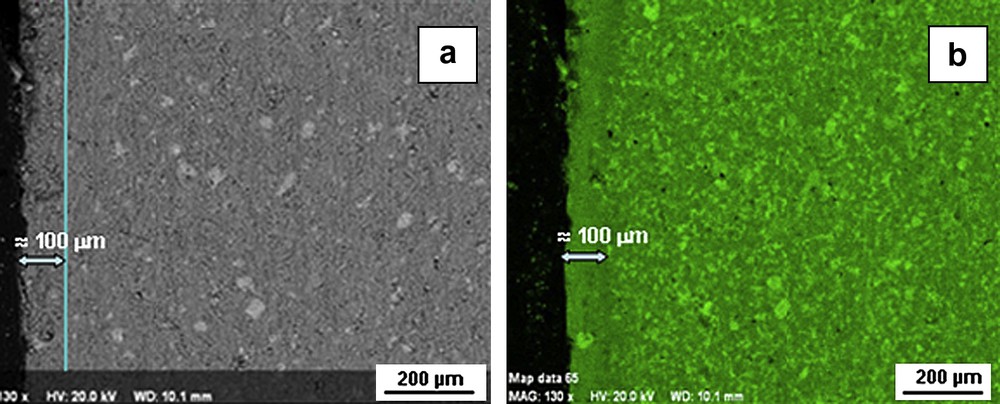
BSE image for the “with exchange” sample after 1-month curing in brine (a); calcium cartography of the same zone (b).
3.2 After leaching
After 3 months of leaching at elevated temperature, three distinct zones were visible at macroscopic scale for the “without exchange” specimens (Fig. 4). TGA/DTG analyses highlighted the presence of portlandite in area 1 situated in the very centre of the cube whereas this mineral was absent in the other zones (Fig. 5). The content of Ca(OH)2 in the inner part of the monolith is about 20 wt.%. Zones 1 and 2 were delimited by the portlandite dissolution front. Moreover calcite was present in large amount in zone 3 (≈40 wt.%). Calcium cartographies analyses (Fig. 6a and b) showed a decrease of the calcium content in zone 2; this calcium depletion was more pronounced in zone 3. EDS analyses for the three zones revealed that C/S ratio of C–S–H decreased from the centre to the edge of the cement cubes: C/S ratio was about 2 in the centre (zone 1 which corresponded to a sound zone of the cement paste), 1.75 in the first degraded zone (zone 2) and about 0.8 in the second degraded zone (zone 3). These values showed that zones represented different degradation states during leaching tests that is in good accordance with other studies [16,17]. However, our experimental parameters were different from these studies using pure water for leaching at 25 °C, implying different kinetics of leaching. Porosity values for the non-altered zone (zone 1) and the whole degraded zone (zones 2 and 3) were, respectively, about 28 and 39%.
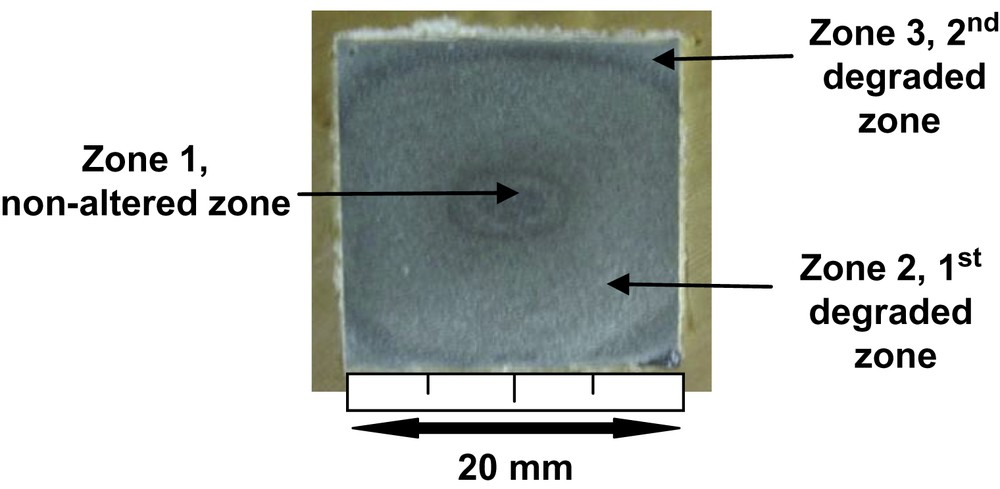
Photography of the “without exchange” sample after 3-month leaching.
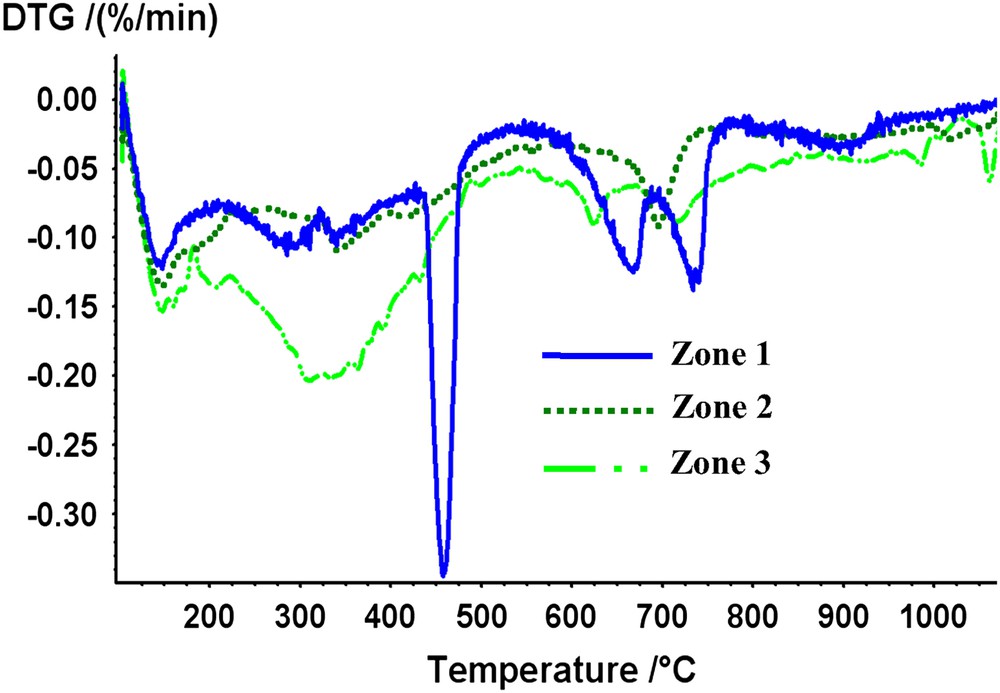
DTG curves for the three zones observed after the leaching of the “without exchange” sample.
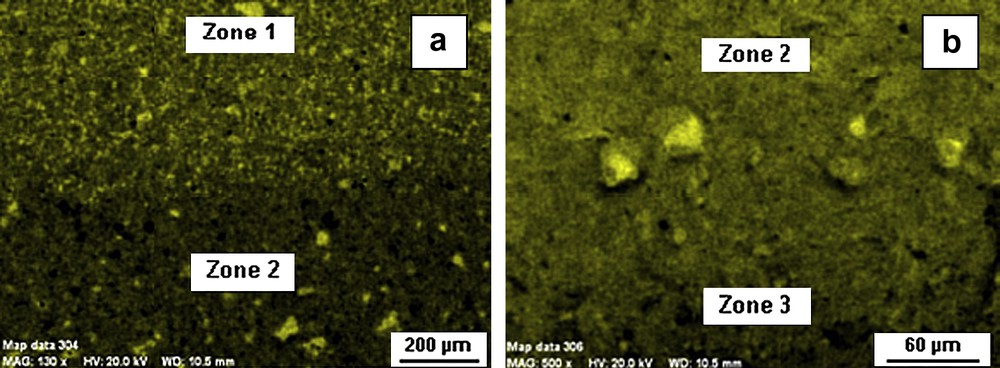
Calcium maps for zone 1–zone 2 (a) and zone 2–zone 3 (b) interfaces.
After leaching, the “with exchange” specimens were very different from the “without exchange” samples. Fig. 7a shows a leached cement monolith by backscattered electron (BSE) imaging on a polished section. We observed a deeper degraded zone (about 250 μm deep) when compared after the curing period; calcium cartography indicated a decreasing concentration for this element in the degraded zone and TGA confirmed that this phenomenon was due to portlandite dissolution in this area. Moreover, at the liquid/solid interface we observed a calcium rich crust identified as calcite by EDS analyses (Fig. 7b). We explained this result by the progression during the leaching of the initial calcite layer formed during the curing. This crust played a role of diffusion barrier and has limited the progression of portlandite dissolution front.
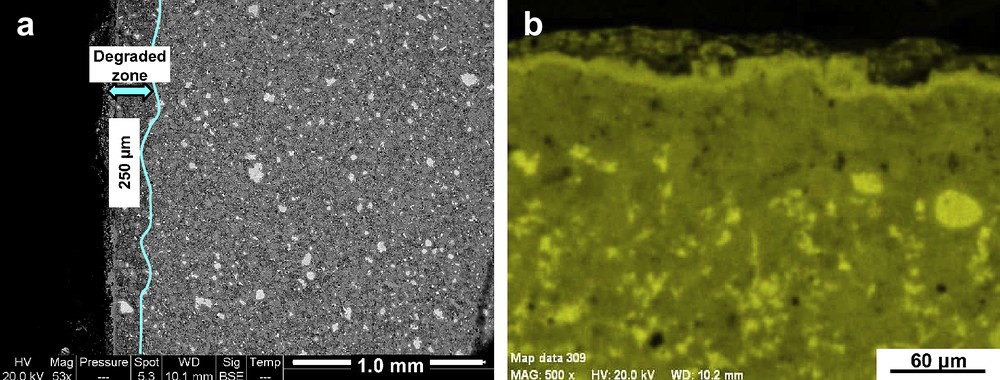
BSE image (a) and calcium cartography (b) for the “with exchange” samples after 3-month leaching test.
3.3 Simulation results
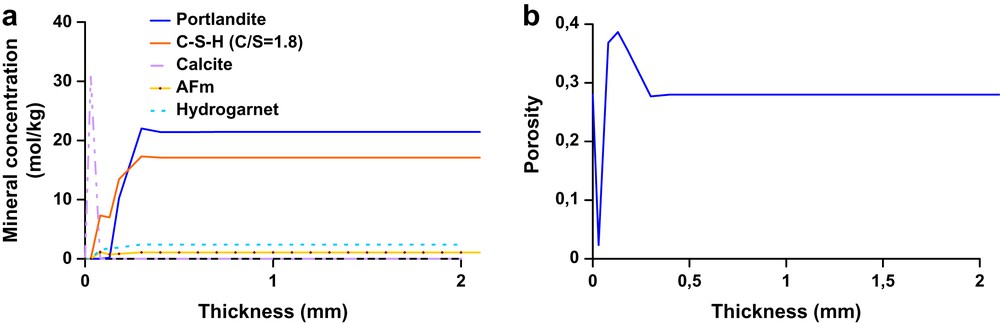
The first approach of this study consisted in characterising physico-chemical modifications during oilwell cement leaching tests, with the aim of modelling these processes with the reactive transport model HYTEC. The remaining unhydrated phases were not taken into account as input data in HYTEC. The concentration of the other phases (hydration products and calcite) in the pore solution was calculated by using the experimental analyses presented in Table 3. A one-dimensional mesh for the cement domain has been chosen for the simulations. The results of the simulation for the 3-month leaching are presented in Figs. 9 and 10. The cement paste domain had a 10 mm total thickness (10 mm-depth corresponding to the centre of the cement monolith) divided in 100 nodes. The external media, the brine in this case, was represented by a zone where constant concentrations of ionic species were imposed (Fig. 8). This last assumption was done in order to simulate a continuous aggressive fluid renewal (experimental conditions of the leaching test). Indeed, in an oilfield, the volume of formation water is extremely high compared to the cement sheath volume; one can consider, in this case, that the cement pore solution is in contact with an infinite brine reservoir. Cement paste porosity was considered as a variable parameter. Modelling results are reported on graphs representing mineral phase's profiles as a function of depth. Fig. 9a shows profiles for CH, Afm, C–S–H and hydrogarnet after 3-month simulation. Portlandite dissolution front was situated at about 5.2 mm, whereas leaching tests for the “without exchange” specimens showed that the total degraded thickness was about 7 mm. Moreover, in this first zone C–S–H (C/S = 1.8), Afm and hydrogarnet concentrations decreased. C–S–H (C/S = 1.8) dissolution led to the appearance of C–S–H with lower C/S ratio (C/S = 1.6). We observed a second degraded zone (1 mm wide, according to experimental observations) where hydrogarnet and C–S–H (C/S = 1.6) were totally dissolved. C–S–H with C/S = 1.1 were present in this area. A calcite crust was developed during leaching simulation (corresponding to 39 wt.%), that is in good accordance with TGA analyses in the most degraded zone. Indeed, calcium coming from portlandite dissolution reacted with HCO3− in the brine to form calcium carbonates. This crust led silicium, calcium and aluminium accumulation in pore solution, which involved an increase of the concentration of aluminium and silicon bearing phases like Afm and C–S–H near the edge of the cement paste. Fig. 9b shows porosity variation along the profile, with an increasing value between 1 and 5.2 mm where the porosity value reached about 49%. This physical parameter decreased near the surface of the material because of calcite crust formation (porosity value is about 33% between the surface and 1 mm-depth). These observations are in good accordance with mercury porosity values (about 39%) for the bulk degraded zones after leaching tests for the “without exchange” samples.
Scheme of results after curing and leaching
| After 1-month curing | After 3-month leaching | |||||||||||
| Thickness degraded (mm) | Number of zones | Phases (wt.%) | Sound zone | Degraded zone | Protective layer | Thickness degraded (mm) | Number of zones | Phases (wt.%) | Sound zone | First degraded zone | Second degraded zone | |
| “Without exchange” sample | 0 | 1 | CH | 20 | – | – | 7 | 3 | CH | 20 | – | – |
| C–S–H (C/S = 1.8) | 52.6 | C–S–H (C/S = 1.8) | 52.6 | – | – | |||||||
| C–S–H (C/S) | 2.0 | C–S–H (C/S) | 2.0 | – | – | |||||||
| C–S–H (C/S = 1.6) | – | C–S–H (C/S = 1.6) | – | 26.9 | – | |||||||
| C–S–H (C/S) | – | C–S–H (C/S) | – | 1.5–1.75 | – | |||||||
| C–S–H(C/S = 1.1) | – | C–S–H(C/S = 1.1) | – | – | 28.1 | |||||||
| C–S–H (C/S) | – | C–S–H (C/S) | – | – | 0.8 | |||||||
| CaCO3 | 3.0 | CaCO3 | 3.0 | 39 | ||||||||
| Afm | 9.5 | Afm | 9.5 | 5.3 | 16.4 | |||||||
| Hydrogarnet | 10.0 | Hydrogarnet | 10.0 | 5.6 | – | |||||||
| Porosity (%) | 28 | Porosity (%) | 28 | 39 | ||||||||
| “Without exchange” sample | 0.1 | 2 | CH | 20 | 11 | – | 0.2 | 2 | CH | 20 | – | – |
| C–S–H (C/S = 1.8) | 52.6 | – | – | C–S–H (C/S = 1.8) | 52.6 | 21.5 | ||||||
| C–S–H (C/S) | 2.0 | – | – | C–S–H (C/S) | 2.0 | 1.5–1.75 | ||||||
| C–S–H (C/S = 1.6) | – | 27.6 | – | C–S–H (C/S = 1.6) | – | – | ||||||
| C–S–H (C/S) | – | 1.5–1.75 | – | C–S–H (C/S) | – | – | ||||||
| C–S–H(C/S = 1.1) | – | – | – | C–S–H(C/S = 1.1) | – | – | ||||||
| C–S–H (C/S) | – | – | – | C–S–H (C/S) | – | – | ||||||
| CaCO3 | 3.0 | 3.0 | 13 | CaCO3 | 3.0 | – | ||||||
| Afm | 9.5 | 9.5 | – | Afm | 9.5 | 6 | ||||||
| Hydrogarnet | 10.0 | 10 | – | Hydrogarnet | 10.0 | 6.27 | ||||||
| Porosity (%) | 30 | Porosity (%) | 35 | 28 |

Modelling of chemical degradation for “without exchange” sample, mineral solid phases (a) and porosity (b) profiles as a function of the material depth.
Modelling of chemical degradation for “with exchange” sample, mineral solid phases (a) and porosity (b) profiles as a function of the material depth.

Geometry and mesh used for one-dimensional simulations.
Concerning simulations for the “with exchange” cement pastes, a first mesh at the cement surface has been added in the input data, with 13 wt.% of calcite. The thickness of this calcite mesh was equal to 10 μm as it was observed after curing period for these specimens. Moreover, a 100 μm-wide degraded zone was added according to observation after 1-month curing, where portlandite and C–S–H (C/S = 1.8) were partially dissolved. Fig. 10a is an enlargement of the profile, and shows that the total degraded thickness was about 250 μm (represented by the portlandite dissolution). This value fits very well with experimental observations. C–S–H (C/S = 1.8) further decreased but C–S–H with lower C/S ratios were absent because of a weak material degradation.
Calcite crust was further developed, and this diffusion barrier prevented the progression of cement paste degradation. Fig. 10b shows that porosity increased in the degraded zone (between 30 and 250 μm) reaching 35%, and decreased near the cement paste surface layer (2–3%).
4 Discussion
4.1 Curing effects
The two curing conditions induced mineralogical and structural differences between the specimens. XRD, TGA and SEM analyses indicated that all the specimens contained both portlandite and C–S–H. It is important to highlight the difference between the two sets of specimens after 1-month maturation. “Without exchange” samples were not altered after the 1-month curing, whereas “with exchange” samples presented a leached zone and a calcite surface layer as summarised in Table 3. This surface layer can affect the leaching behaviour as presented in the next section. Diffraction patterns and TGA indicated that this degradation resulted in the partial dissolution of portlandite and C–S–H decalcification. Indeed, the cement paste pore solution pH was about 13 whereas pH of the brine was close to 7.5. Ionic diffusion between the pore solution and the aggressive brine occurred due to concentration gradients. This ionic diffusion creates non-equilibrium conditions between the hydration products and the cement interstitial solution, the equilibrium being recovered by dissolution and precipitation phenomena [16,35]. This is consistent with the hypothesis that pore solution is in local equilibrium with the solid phases. Partial decalcification of the “with exchange” cement pastes occurred to maintain calcium concentration of the pore solution. In addition, dissolved CO2 in the brine can also be responsible for portlandite dissolution, according to this reaction:
4.2 Leaching behaviour
After a 3-month leaching test, “without exchange” specimens were highly leached with a total degraded thickness reaching 7 mm that corresponds to the portlandite dissolution front. SEM observations and XRD/TGA analyses allowed us to clearly distinguish three different zones (Table 3): (1). A zone, situated in the centre of the cement monolith, containing all the main phases (portlandite, C–S–H with C/S = 2, hydrogrossular, Afm); (2). A first degraded zone, where portlandite was absent and C/S for C–S–H was about 1.5; (3). Finally, a second degraded zone where C/S for C–S–H reached about 0.8 and portlandite was totally dissolved. These degraded zones were also characterised by a significant increase in porosity. This phenomenon resulted in the decrease of the bulk mineral volume and enhanced fluid transport in the cement paste [36,37]. Simulations for “without exchange” samples presented three zones, corresponding to different mineralogies. The portlandite dissolution front was localised about 5.2 mm from the surface. This simulated front thickness is under-estimated and this can be explained by several reasons, like the fact that the simulations did not take into account CO2 dissolution in the brine during experiments, involving portlandite dissolution. Calcite precipitation at the surface of the cement paste is caused by local calcium saturation with respect to calcium carbonate at the cement/brine interface [9,38]. Consequently, transport properties change (e.g. porosity).
Concerning the “with exchange” samples, the calcite surface layer was further developed during leaching test, forming a crust at the monolith surface. Degraded zone was enlarged to reach about 250 μm, where portlandite was totally dissolved. This calcite layer allowed the reduction of the leaching process [39] for these specimens, by forming a diffusion barrier. This phenomenon is well reproduced by HYTEC. Indeed, the simulations gave the same thickness for portlandite dissolution front when an initial mesh containing calcite at the surface is imposed as input data. Moreover, porosity drastically decreased during the development of this surface layer, preventing ionic species' diffusion into the cementitious matrix.
5 Conclusion
Reproducing in a laboratory experiment the long-term alteration of the cement sheath under down well conditions is complicated and probably illusive. The strategy implemented in this research work has been to carry out leaching tests with formation water at a realistic temperature. All parameters (flowrate, brine volume, leachant composition…) of these laboratory tests were carefully controlled in order to get reliable data. These reliable data allowed us to perform modelling of the cement paste alteration observed after the leaching tests. Curing conditions as key parameter had to be investigated. Two curing modes have been implemented at 80 °C and 7 × 10⁶ Pa: in a first experiment, cement paste samples were allowed to cure in contact with a brine, and in a second experiment, the hydration of cement paste took place in sealed conditions. Then leaching tests with a brine were carried out for 3 months at 80 °C on the two sets of samples. Results showed that “without exchange” samples presented three specific zones: a sound zone in the centre and two degraded zones where portlandite was absent. C/S ratio of C–S–H decreased and porosity increased from the centre to the edge of these samples. Cement pastes “without exchange” cured in brine were less degraded. We explained this result by the initial calcite layer that was further developed during leaching. Thus curing conditions are a key parameter that clearly influences both the degradation mechanism and its kinetics. Therefore long-term cement paste behaviour in down well conditions is likely to be influenced by the hydrating and curing conditions especially if some protective layers are formed. With the brine used for this study, it appears that a calcite layer plays a major role on fluid transport and thus on the rate of leaching. Modelling allowed to reproduce the general trends experimentally observed. The results showed very accurately the fall of bulk mineral volume, assigned to portlandite dissolution and C–S–H decalcification, the concentrations of which are calculated in accordance to the time. Cement paste porosity, which is a time-evoluting property in HYTEC, increased as degradation developed, in agreement with experimental results. Second, the local precipitation of calcite, for the simulation of the “with exchange” samples, involved the use of a fine mesh on the edge of samples. The results were also in good accordance with experiments. Tests on the same cementitious formulation with a specific cell working at 80 °C and up to 7 × 10⁶ Pa are in progress to highlight and understand the role of pressure on alteration mechanisms. As a further perspective of this study, leaching tests on a High Performance Cement formulation, a portlandite-free material, will be performed.
Acknowledgments
The authors sincerely thank the anonymous reviewer (#2) for his constructive comments. We thank Laurent De Windt, Vincent Lagneau and Jan Van der Lee for their contribution to the use of the HYTEC model. The authors also thank Nathalie Ferrer, Paul Blervaque, Guillaume Potier, Michael D'helft and Christophe Cappelaere for their technical assistance.