

1 Introduction
Hydrographical systems and water resources in Mediterranean regions are particularly sensitive to climate changes, especially when submitted to anthropogenic pressure. The increase in water consumption requires a better understanding of groundwater and surface water circulations in order to prevent both quantity and quality degradations of water resources in the future. Because of the general rainfall decrease in Mediterranean regions during the last fifty years, particularly in south-east France, including the Nice area, it becomes crucial to follow in details the evolution of their hydrographical systems.
In the past, the control of water quality was mainly based on major elements and microbiological parameters, whereas trace elements were not routinely measured, excepted on specific sites that could be affected by industrial or agricultural pollution. Nevertheless, their distribution in the environment and the processes involved for both natural and anthropogenic trace elements were largely investigated [1–6] (among others). Then the increasing awareness of water quality induced national water monitoring networks developing more systematic approaches [7,8].
The pollution may be anthropogenic [9–11], but may have a natural origin, as for example in the well known cases of arsenic in the Bengal delta plain [12], Hanoi [13,14] or in Chili [15]. We shall give here another example of water contamination by natural arsenic.
Trace elements may be efficient tools for detecting eventual hazards in an aquifer system. Nevertheless this needs a previous and precise knowledge of the natural background of trace elements in the system.
This paper deals with geochemical investigations on surface water and groundwater in the Var River catchment basin (Alpes Maritimes, France), showing how trace elements can help (1) the understanding of the precise relationships between the main aquifer and the Var River, and between different aquifers, (2) detecting and understanding anthropogenic or natural pollution, and (3) determining the best markers for a good definition of the natural trace elements background of the catchment. This approach may allow us to anticipate the difficulties resulting from an eventual strong relative decrease of water resources in the future, resulting of both lower rainfalls and increasing demand. We report in this paper the preliminary data obtained in a research program recently started [16].
2 Trace elements as tracers of water origin and pollution
Trace element concentrations in natural water depend on many factors such as climatic, morphological and hydrological conditions, type of minerals present in drained rocks, mobility of elements during erosion and transport, physical parameters of water, and residence time of water into the rocks or soils.
Concerning the natural signature of waters, it is possible to determine general trace elements concentration domains for various types of geological environments. For instance, on aquifers in the Alps, Kilchmann et al. [17] showed that iodine concentration is particularly high in groundwaters from carbonate rocks, and arsenic, uranium and fluoride concentrations are higher in aquifers from crystalline rocks (granites, metamorphic rocks). Such a synthetic study allows determining the best natural tracers for each type of alpine aquifer.
Many trace element studies were carried out on polluted waters in order to determine the origin of the pollution. Long-term studies of trace elements in a catchment appear often necessary to detect seasonal pollutions by agriculture, episodic pollution by wastewater or factory discharges. Sampling at various periods of the year may reveal seasonal variations caused by water temperature, pH, redox conditions, water flux or activity of microorganisms [18,19]. Detailed and long-term studies may allow us to distinguish between several pollution sources at different catchment levels and also to evidence various natural or anthropogenic contributions from different components (tributaries) of a catchment year by year [20]. During the transportation phase, transfers of elements between water and suspended particulate matter (SPM) or sediments are more or less active, depending on elements and physical parameters [21–23].
Whereas African and American rivers are more extensively studied, trace elements distribution and evolution through time in European and Mediterranean [19] River water are not very known [25,19]. This paper concerns an example of Mediterranean River basin.
3 The Var hydrological system
The Var River is the largest river of the Côte d'Azur area. It starts at about 2600 m altitude. Its catchment of about 2800 km2 has a mean altitude higher than 1500 m, with highest summits at more than 3000 m altitude. The main tributaries are the Coulomp, Tinée, Vésubie [26] and Estéron Rivers, whereas the Roudoule and Cians Rivers have most often lower discharges (Fig. 1). All along the 110 km of the Var River, numerous small streams contribute to the final discharge, but their importance is much lower along the last 20 km. The rainy seasons are April–May and October–November. It is a typical Mediterranean River, affected by contrasted water flow regimes, with a discharge that can reach as much as 3000 m3/s, as during the 1994 major flood, and minima as low as 9 m3/s. Longer dry seasons were observed for the last few years, modifying various ecosystem parameters of the whole catchment, as mechanical and chemical erosion, fluxes of solid and dissolved matter reaching the Mediterranean Sea.
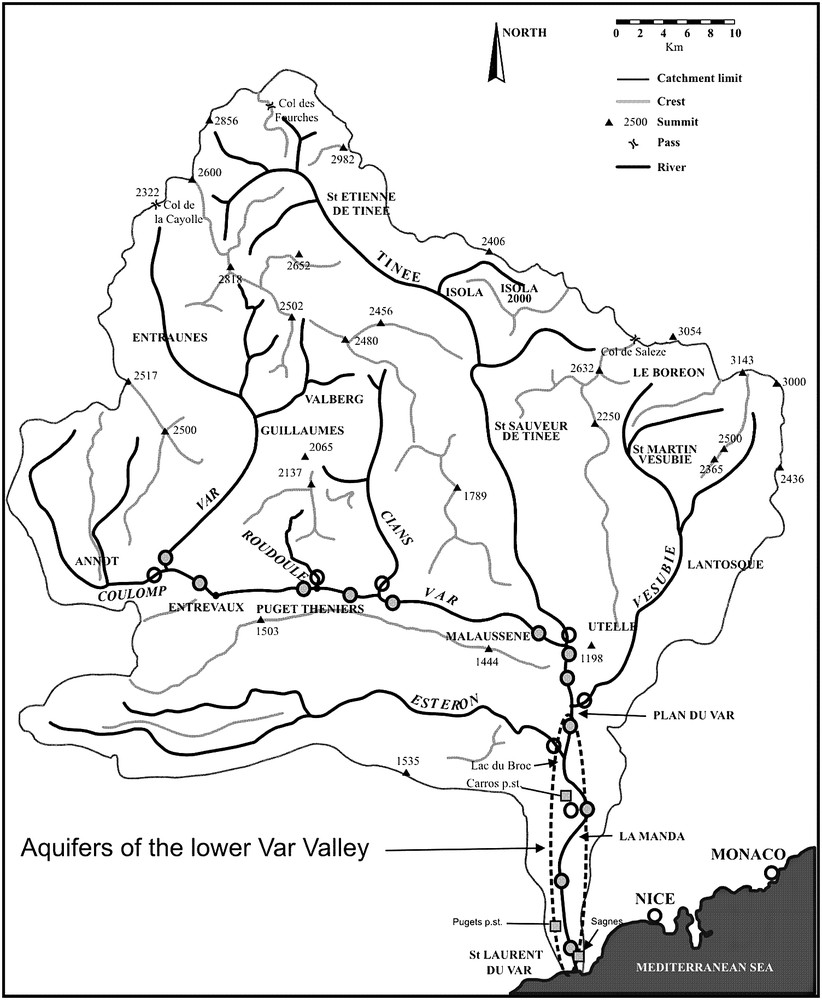
The Var River hydrographic system and sampling location. Grey circles = Var River sampling. Empty circles = tributaries sampling. Squares = groundwater sampling. c.w. = catchment well. The ellipse shows the lower Var Valley.
The Var River and its tributaries start in a relatively protected natural environment, whereas the main used aquifers are located in the lower part of the valley (Fig. 1), just below industrial zones. These aquifers are now exploited for a population of more than 600 000 inhabitants, and their exploitation has considerably increased since the last 50 years. From major elements and oxygen isotopic ratios, Guglielmi [27] showed that this 25 km long aquifer draining recent alluvial deposits, is fed by the Var River itself and lateral aquifers originating from contiguous geological formations on both sides of the valley. At the mouth of the river, the aquifer becomes confined and flows under impermeable sediments of a small coastal delta, and freshwater discharge areas were detected in the sea [28]. The surface waters and groundwaters of the catchment are classified as calcium sulphate and calcium bicarbonate types. Major elements compositions are routinely supplied by the Agence de l'Eau Rhône – Méditerranée – Corse (http://www.rhone-mediterranee.eaufrance.fr).
4 The geology of the catchment basin
The main geological formations of the Var River catchment consist of the following rocks, hereafter presented in chronological/stratigraphical order (Fig. 2).
- (1) The oldest rocks are magmatic (granites) and metamorphic (gneisses and micashists) rocks of the Mercantour massif, at the north-eastern edge of the basin. These rocks belong to the 300–350 million years old Hercynian chain that affected the whole western Europe at that time. They are mainly formed by alumino-silicated minerals.
- (2) Continental sediments of Permian age, deposited immediately above the previous rocks, are located all around the Mercantour massif, and at the north of Puget-Théniers (=Dôme de Barrot, Fig. 2). They partly consist of red and very fine grain rocks named argillites. They are believed to originate from volcanic activity and alteration and erosion of the Hercynian chain; they mainly consist of clays and fine micas.
- (3) The Triassic formations mark the beginning of sediments deposited in an aqueous environment (sea or lakes). The rocks are dolomitic limestones, sandstones, marls and are partly characterized by an abundant proportion of gypsum (CaSO4).
- (4) The Jurassic and Cretaceous marine sediments mainly consist in marl–limestone alternations. Marls contain a mixture of calcium/magnesium carbonates and clays, and limestones consist of calcium and magnesium carbonates.
- (5) Tertiary sediments are more varied, with sandstones (“grès d'Annot”, well developed in the western part of the catchment basin, rich in quartz), limestones and marls.
- (6) At the south of the basin are found Miocene molasses, marls and limestones.
- (7) The lower part of the Var Valley mainly consists of about 700 m thick conglomerates (so-called “poudingues du Var”) that represent the old Var delta during the Pliocene. They contain pebbles from rocks outcropping in the whole basin.
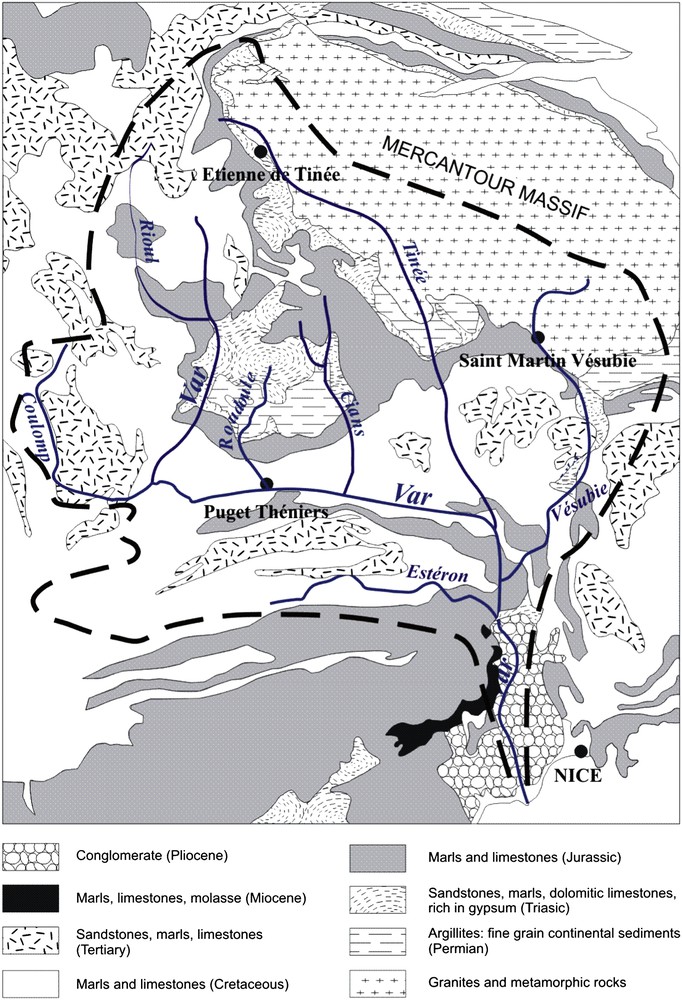
The schematic geological map of the Var River catchment.
From Fig. 2, we observe that the different rivers of the catchment do not drain the same geological formations. For instance, only the Tinée and Vésubie Rivers are draining the granites and metamorphic rocks of the Mercantour massif in their upper part. The upper Var, Roudoule, Cians and Tinée Rivers are crossing the Permian argillites. The Estéron River flows on Jurassic, Cretaceous and Tertiary sedimentary rocks. The Coulomp River drains areas where Tertiary sandstones are abundant. We can therefore expect specific chemical compositions for each river.
5 Sampling and analytical method
Surface water was sampled on 18 sites of the Var, Coulomp, Roudoule, Cians, Tinée, Vésubie and Estéron Rivers (Fig. 1). In addition, a specific sampling for arsenic measurement was carried out on the Tinée River (see below and Fig. 6). Groundwaters of the lower valley alluvial aquifer were sampled in 24 sites, either directly in catchment wells or in bore-holes, or taps. During each groundwater sampling campaign, surface waters were also sampled in the investigated area (three points in the Var River and two in Vésubie and Estéron Rivers).
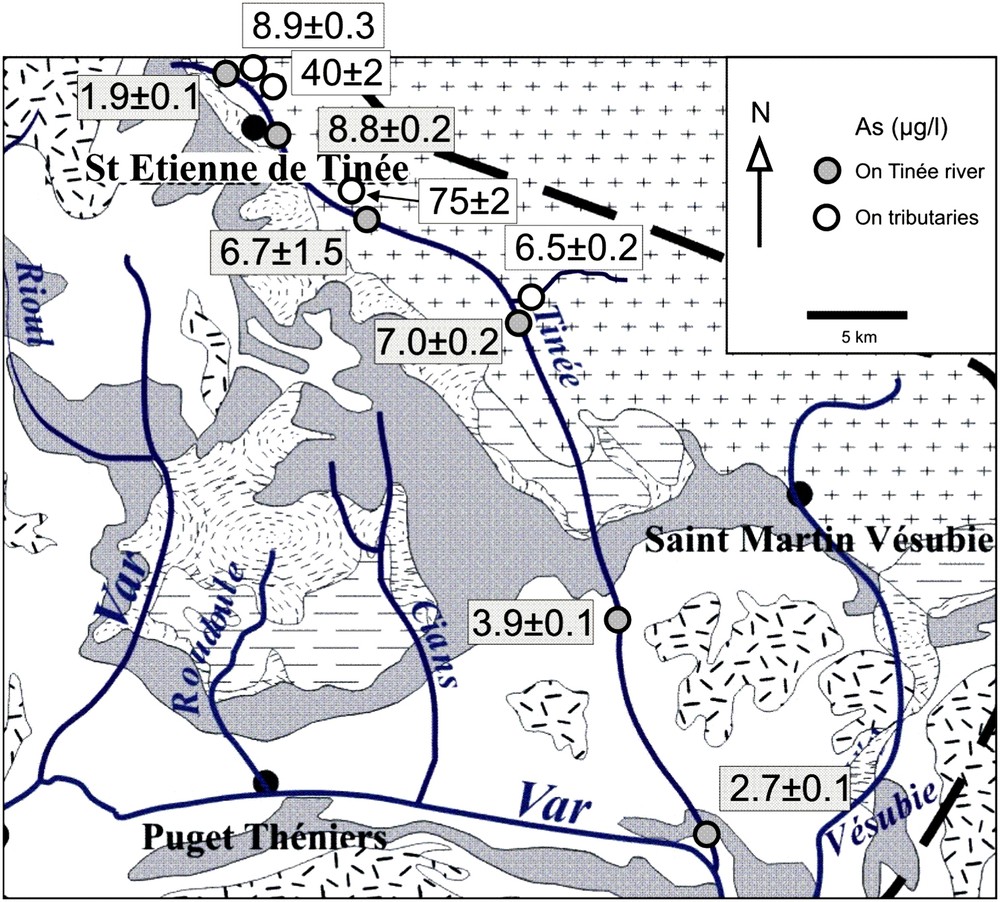
Arsenic concentration (in μg/L) measured in Tinée River water and small tributaries, sampled on 29th February 2008. The geological map corresponds to Fig. 2.
Water samples were collected in 250 or 125 ml acid-cleaned polypropylene bottles, after an immediate filtration through a 0.45 μm membrane. The trace element measured in the filtered waters will be named hereafter “dissolved” elements, even if this term is not really appropriate [25] (see below). The same or the following day, 4 or 2 ml (respectively) of high-purity nitric acid (TraceSelectultra, Sigma–Aldrich) were added to the samples in the clean room of the Géosciences Azur laboratory. Sample preparation for inductively coupled plasma mass spectrometry (ICP–MS) analysis was exclusively performed in the clean room.
Trace element concentrations were determined using a Perkin–Elmer Elan DRC II ICP mass spectrometer. Experiments on groundwater and for arsenic analyses were carried out with internal standards (Tb–Y and Ge, respectively) and external standards were used for other surface water experiments. In that case, calibrations were carried out every 6–7 sample run in order to minimize drifting of the measured signal. Duplicates were performed at the beginning and end of cycles, in order to evaluate the signal drifting. Blanks were performed for each campaign and measurement series. 75As was determined with the Dynamic Reaction Cell mode (DRC), optimized with an argon (95%)–hydrogen (5%) mixture, in order to minimize polyatomic interferences by 40Ar35Cl and 40Ca35Cl. Nevertheless, a dynamic polyatomic correction was also applied to decrease an eventual remaining interference on the m/z 75 peak. The efficiency of this double procedure was tested by analysing the river water reference material SLRS-4 (National Research Council, Canada) spiked with various amounts of CaCl2 (purity 99%).
Data are reported in Figs. 3–5. The error bars do not appear when the symbols are larger.
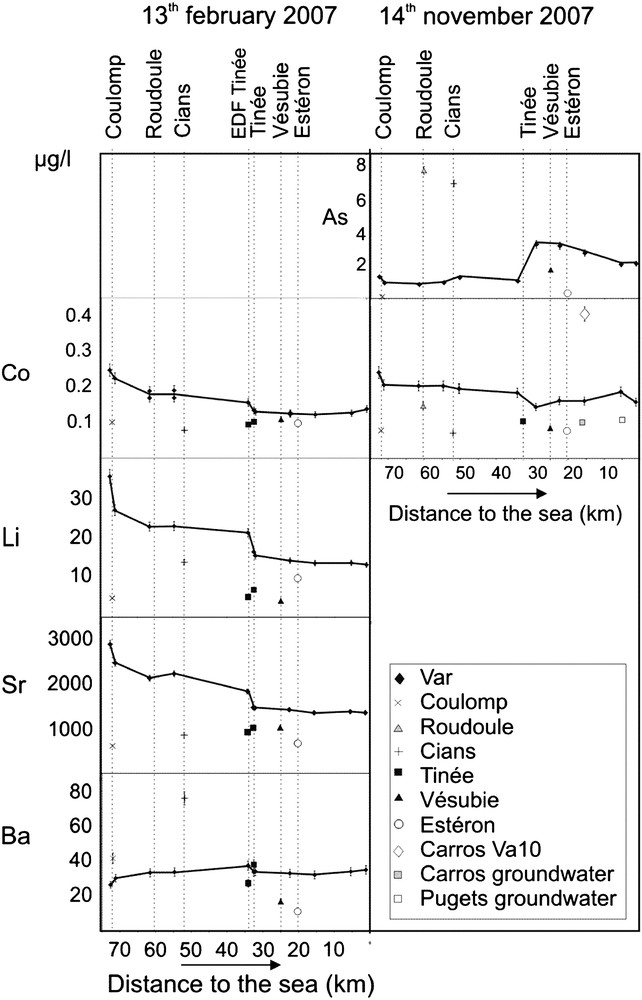
Concentration (in microgram per litre) of As, Co, Li, Sr and Ba along the Var River, its main tributaries (Coulomp, Roudoule, Cians, Tinée, Vésubie and Estéron), one small stream (VA10) crossing the Carros industrial area and groundwaters from the alluvial plain of the lower Var River Valley (right side: Carros and Pugets cathment wells). Distances are referred to the mouth of the Var River. Sampling was performed on two days: 13th February 2007 and 14th November 2007. Data of other elements are given in Fig. 4. “EDF Tinée” represents the output of water issued from the Tinée River, via an electricity power plant, but reaching the Var River above the Tinée/Var confluence. It was not working on 14th February 2007. Error bars do not appear when they are smaller than symbols. Masquer
Concentration (in microgram per litre) of As, Co, Li, Sr and Ba along the Var River, its main tributaries (Coulomp, Roudoule, Cians, Tinée, Vésubie and Estéron), one small stream (VA10) crossing the Carros industrial area and groundwaters from the alluvial ... Lire la suite
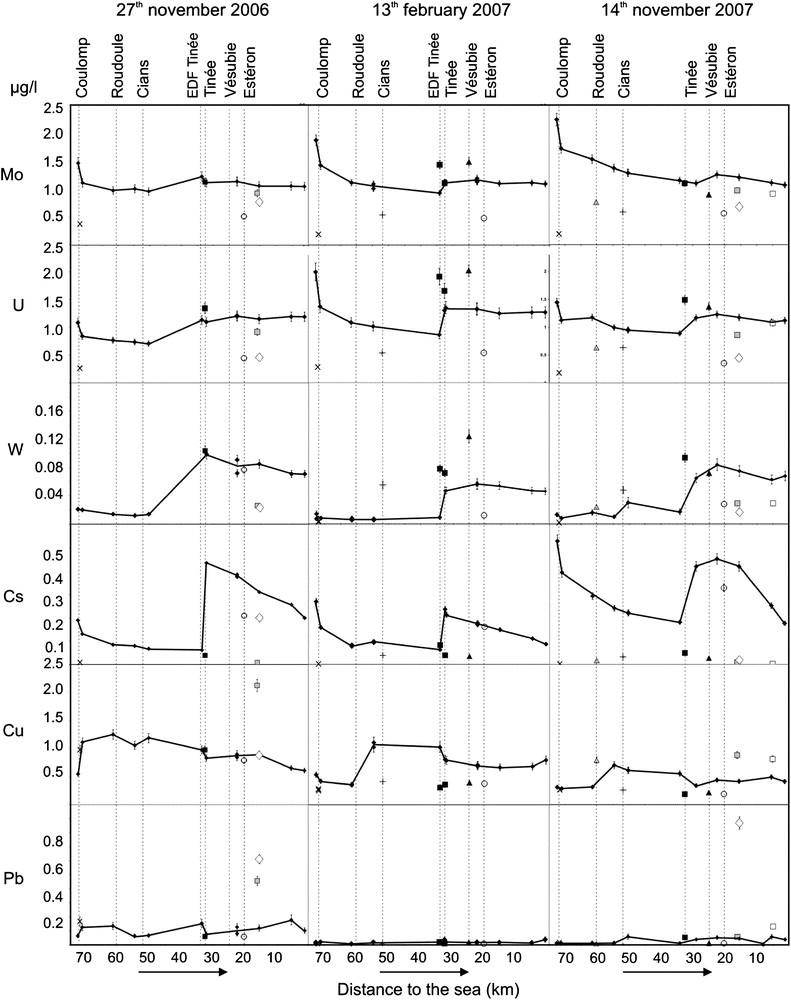
Concentration of Mo, U, W, Cs, Cu and Pb along the Var River, its main tributaries (Coulomp, Roudoule, Cians, Tinée, Vésubie, and Estéron), one small stream (VA10) crossing the Carros industrial area and groundwater from the alluvial plain of the lower Var River Valley (right side: Carros and Pugets captage wells). Sampling was performed on three days: 27th November 2006, 13th February 2007 and 14th November 2007. Caption as for Fig. 3. Error bars do not appear when they are smaller than symbols. Masquer
Concentration of Mo, U, W, Cs, Cu and Pb along the Var River, its main tributaries (Coulomp, Roudoule, Cians, Tinée, Vésubie, and Estéron), one small stream (VA10) crossing the Carros industrial area and groundwater from the alluvial plain of the ... Lire la suite
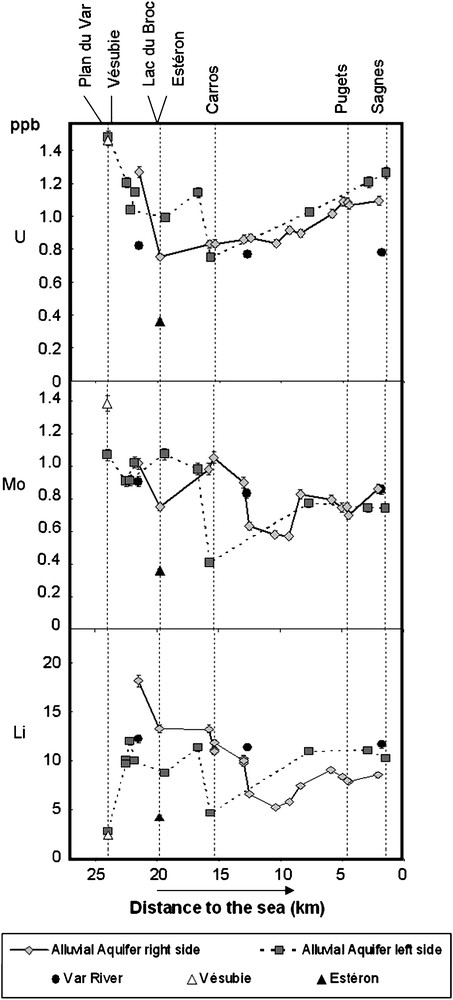
Concentration of U, Mo and Li on groundwaters and surface waters from the lower Var Valley. Left and right side groundwaters are distinguished.
6 Results
Concentration data from surface water of the Var River catchment are reported in Figs. 3 and 4, they concern water sampled during three field campaigns: 27th November 2006, 13th February 2007 and 14th November 2007. The last sampling was performed after a dry season of several months, in rivers with relative low water level, whereas the two previous ones corresponded to higher water flows. One specific sampling was carried out during a flood event (12th January 2008), it is shown separately in Fig. 8. Unfortunately, precise discharge of sampled rivers is unknown. In most cases (the 12th January 2008 flood sampling excepted), the water was transparent with low amounts of SPM.
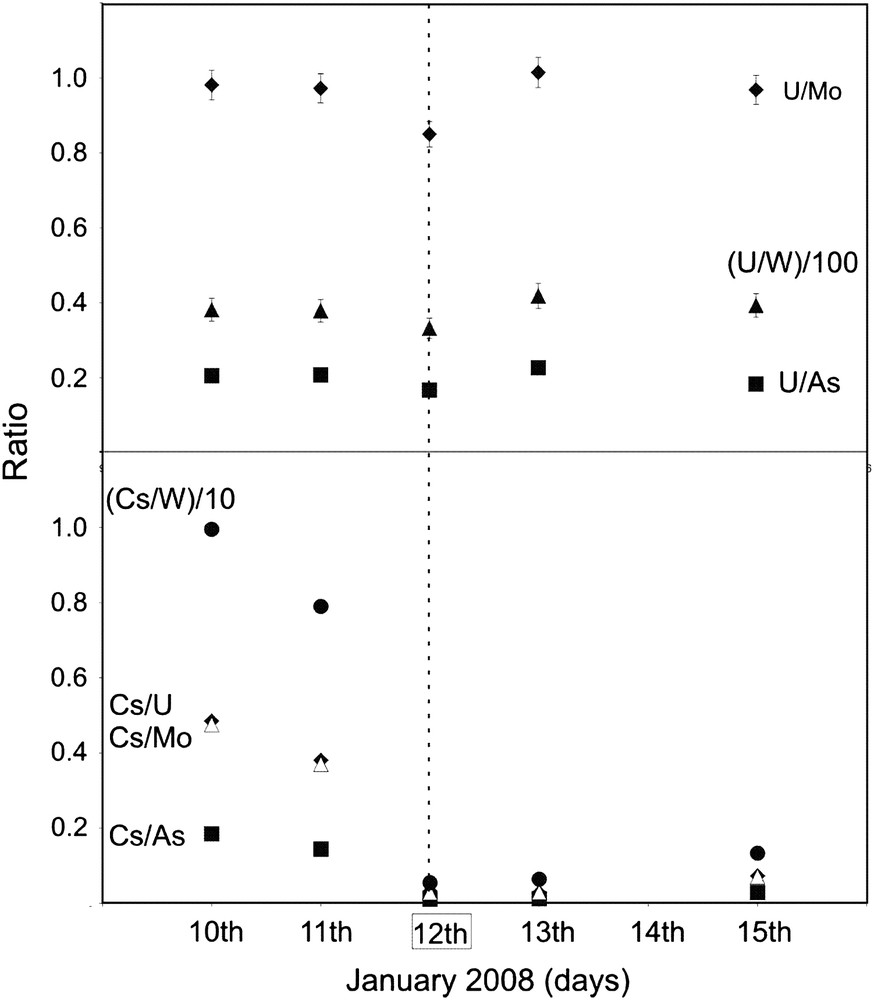
Plotting of trace element ratios measured on Var waters before, during and after the overflow of 12th January 2008.
On the Var River, the highest concentrations are obtained on Sr, Ba and Li, while Co, W, Cu and Pb may be lower than 0.1 μg/L. From upstream to downstream along the Var River, we observe a more or less intense variation of concentrations, which is clearly the result of mixing with water of tributaries. For instance, before and after the Coulomp confluence, concentrations of As, Co, Li, Sr (Fig. 3), Mo, U and Cs (Fig. 4) in the Var River decrease, because of lower concentrations of these elements in the Coulomp River. On the contrary, Ba and Cu increase and W remains stable. When we compare the Var River concentrations with those of investigated tributaries, we generally observe lower concentration on tributaries. This is often the case for Co, Li, Sr, Ba (Coulomp and Tinée excepted, Fig. 3), Mo (excepted Tinée and Vésubie sampled on 13th February 2007), Cs and Cu (Roudoule sampled on 14th November 2007 excepted, Fig. 4). Arsenic concentration is much higher in the Roudoule and Cians water streams (Fig. 3). U and W are significantly higher in Tinée and sometimes in Vésubie water, and Mo is partly higher in these rivers.
The general concentration profiles observed on the Var River (Figs. 3 and 4) show a strong concentration variation for most of the measured elements at the Coulomp and particularly at the Tinée confluence. On the other hand, the concentration of all elements (Cs excepted) remains nearly constant after the Vésubie confluence. Cs represents a special case because (1) the higher concentration observed just after the Tinée confluence cannot be explained by a higher concentration in the Tinée River, and (2) its concentration is the only one to sharply decrease in the lower Var Valley.
Because of specific natural As pollution problems detected in water from the Tinée River valley, we carried out a detailed sampling along the stream and some tributaries. Fig. 6 shows that As concentrations on the Tinée River itself is sharply increasing from 1.9 to 8.8 μg/L in the upper stream, remains high over at least 15 km, then decreases when approaching the Var River confluence (2.7 ± 0.1 μg/L). Small tributaries display higher values reaching 40 ± 2 and 75 ± 2 μg/L.
Concerning groundwaters, we report data obtained on U, Mo and Li, for water sampled on 4th and 5th of March 2008, on both sides of the Var River (Fig. 5). For the three elements, this figure shows a higher variability for groundwaters than for surface water of the lower Var River.
7 Discussion of data
7.1 Repeatability and quality of data
Duplicate data (Figs. 3 and 4) generally agree within error bars although two discordant data are obtained for W (Var River, between Vésubie and Estéron confluences, 27th November 2006, Fig. 4). For each element, we observe the same general upstream to downstream trends for the Var River, corresponding to different sampling campaigns, and these profiles are most often regular within error bars. For the tributaries compositions, we observe about the same values relatively to the Var River. Cu and Pb show more complicated profiles, which may be the result of poorer precision on lower concentrations measurements and/or a possible underestimate of error bars.
Therefore, despite the low amount of sampling campaigns, the quality of data (Pb excepted) should allow one to define a general chemical frame of the catchment waters, at least for the investigated elements, with specific values for each river. This is not the case for natural Pb for which we cannot assign individual river compositions. Blank level for Pb typically corresponds to 5–10% of the measured signal, but in the case of concentration as low as 0.01 μg/L, the blank level may represent 20 % of the Pb signal. Nevertheless, the obtained Pb data seem adequate for detecting anthropogenic pollution (see below).
7.2 The natural chemical signature of individual rivers in the catchment
For most of the investigated trace elements, both the chemical trends observed on the Var River and the compositions of the investigated tributaries for the three sampling campaigns are close. This means that (1) each river of the catchment basin appears to have its own relative signature and (2) despite the different water regimes in the catchment during the three sampling campaigns, the relative contribution of each component seems relatively stable.
In the upper part of the catchment, Var and Coulomp Rivers have very different compositions in Co, Li, Sr, Mo, U and Cs, with much lower concentrations in Coulomp. This is the result of shorter residence times of groundwaters supplying the Coulomp River or/and a more restrictive exchange water/rock in the Coulomp individual catchment. We can notice that the geology of this last catchment is partly represented by sandstones (in Tertiary terrains shown in Fig. 2) in which quartz is highly dominant and resistant to alteration. At the lower part of the Var River catchment, Estéron water displays low concentrations in As, Co, Sr, Ba Mo, U, W, Cs, Cu. This is probably the result of abundant karst cavities in the dominating the Jurassic limestones of the Estéron individual catchment where residence time of water is probably shorter. Tinée and Vésubie Rivers have often close concentrations (As, Co, Li, Sr, Mo, U, and Cu: Figs. 3–5) but higher values in U and W, when compared to other rivers. This is probably the result of the existence of drained granitic and metamorphic rocks upstream. The high U concentration may originate from granites and metamorphic rocks from the Mercantour massif, but also from the Permian argillites, where high concentrations in U were detected during mining prospection [29], and/or the evaporites from Triassic [17]. The fact that the Roudoule and Cians Rivers draining Permian argillites and Triassic evaporites (but not crystalline rocks), have lower U concentrations, favours the hypothesis of a major role of granites and metamorphic rocks in the high U concentration in Tinée and Vésubie streams.
7.3 Groundwaters of the lower valley
Surface waters and groundwaters mostly display distinct compositions as shown by Fig. 5. Nevertheless, we can locally observe some similarities: for example (1) for U and Li in Vésubie surface water and groundwater draining the Vésubie alluvial sediments just before the Var confluence, and (2) just before Carros (around 16 km). In addition, we observe a strong influence of the Estéron tributary on the right side groundwaters trend: U, Mo, Li concentrations strongly decrease just after the confluence. These observations allow us to precisely determine where surface waters are supplying groundwaters. This knowledge is crucial for groundwater quality monitoring if hazardous pollutions happens in the rivers.
These three elements show distinct trends on the left and right sides of the alluvial plain, indicating that both sides of the aquifer appear partially disconnected, as previously suggested [27]. Whereas U, Mo, Li concentrations are very stable in the Var River, they appear highly variable in groundwaters from upstream to downstream. In addition to the Var River water, lateral and/or deeper aquifers draining substratum of the alluvial deposits are feeding the alluvial plain groundwaters [27], and variations in concentrations should allow us to precisely localize the lateral groundwater supplies.
For example, we can see a strong decrease in Mo concentration on three samples from the right side of the aquifer, between 12 and 9 km away from the sea, although there is no tributary in this area. We observe the same trend in Li concentration. This suggests a lateral supply of less concentrated groundwaters coming from the west side of the valley.
Another sampling point, at 15.7 km from the sea in the left side of aquifer, shows a drastic variation in Mo, Li and U. Because of the U variation, this water supply has probably a different origin than the previous one.
These observations are partially in agreement with the study of Gulglielmi [27] who used major elements, but the location of the supply is slightly different: we may suppose that either the groundwater system has been modified or trace elements give different information than major elements. This study requires extension to other trace elements and a regular survey along the year (in progress), of the groundwater system affected by varying seasonal hydrological conditions. Nevertheless, these preliminary data show that trace elements may be efficient natural tracers to localize different supplies in a complex groundwater system.
7.4 The arsenic case
Whereas arsenic is not globally abundant in the Earth's crust, it can be highly concentrated in ore deposits minerals as arsenopyrite (FeAsS), realgar (AsS) and orpiment (As2S3). It can also be present in rock-forming minerals as pyrite [30], marcasite, chalcopyrite, oxide minerals, and sulphate minerals (as jarosite) [31]. Concentrations are low in main rock-forming minerals as silicates and carbonates [32].
Fig. 3 clearly shows that As in Var River is sharply increasing at the confluence with the Tinée River (as was not measured in the Tinée River for this sampling), clearly demonstrating that this tributary has higher As concentrations. However, the highest As concentrations were measured in the two small Roudoule and Cians streams. Because these two rivers are not in contact with the granites and metamorphic rocks of the Mercantour massif, it is likely that As is originating from the Permian argillites that are largely crossed by these streams. This is in agreement with the compilation of Smedley and Kinniburgh [32]. We can notice that these two streams have close concentrations in Mo, U and Cs, revealing a peculiar partly common chemical signature. The detailed As concentration plot along the Tinée River and small tributaries (Fig. 6) clearly shows that the highest concentrations are related to metamorphic rocks (and not granites that do not outpour in this area). This is in agreement with the data compilation of Kilchmann et al. [17]. The highest values are largely above the 10 μg/L admitted limit for dinking water. The decrease of As in the lower part of the Tinée River is the result of either a strong dilution by low As content tributaries and/or an adsorption of As on SPM. Therefore, we can conclude that the high As concentrations in the Var River catchment basin is probably produced by both metamorphic rocks and Permian argillites. This result will help to prospect low As concentration waters for drinking water supply.
7.5 Natural and anthropogenic signatures
Trace elements may be highly sensitive for the detection of human pollution. Although relative concentrations for different aquifer types have been proposed for the main Alpine groundwaters [17], it is necessary to determine the trace element natural background for each catchment where a routine survey of pollution is carried out. The concentrations of individual elements are strongly dependent on river discharge, especially in Mediterranean regions affected by contrasting climates. Therefore, it is more convenient to plot appropriate trace element ratios rather than individual elements [20]. Fig. 7a gives an example of ratio plot using W/Mo vs U/Mo. Two distinct natural domains appear: one for the Tinée and Vésubie Rivers, and the other one for all other rivers including Var. Only one point for the Coulomp River is outside the delimited domain, for still unknown reasons. Fig. 7b seems more appropriate to detect anthropogenic pollution. Pb/Mo is plotted vs Cu/Mo. We observe a clustering of most of the points toward low values; this domain may represent the natural background for the catchment. Four points are outside this domain: one groundwater sample from one of the Carros catchment wells (Fig. 1), two points from the small stream (Carros VA10) crossing the Carros industrial zone (notice in Fig. 3 that Co is also higher). This anthropogenic pollution is probably related to industrial activity. One point of the Coulomp River (the same sample as in the previous diagram) is also outside the natural domain for unknown reasons.
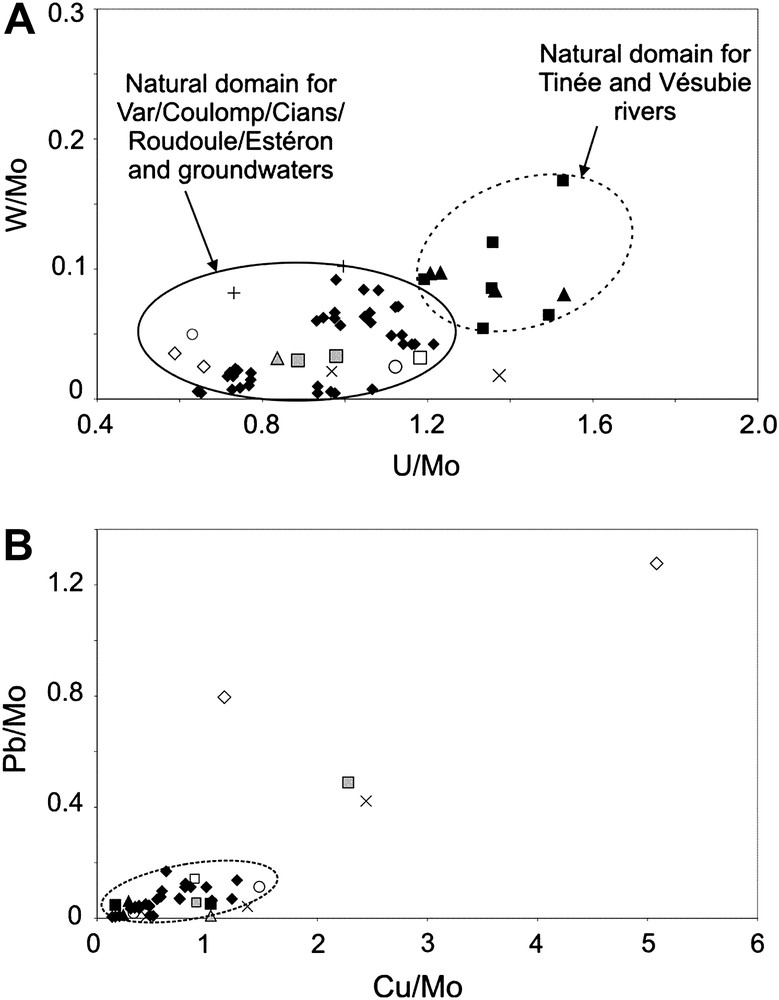
Plotting of trace element ratios of waters from the Var catchment, sampled on 27th November 2006, 13th February 2007 and 14th November 2007. (a) W/Mo vs U/Mo ratios, and (b) Pb/Mo vs Cu/Mo. Caption as for Fig. 3.
7.6 Stability of “dissolved” trace elements
The chemical composition of waters in different discharge conditions may depend on several factors as different raining regimes in individual tributary catchments and differences of surface runoff, but it can be also the result of element transfers between water and SPM, colloidal matter or sediments [33,23,24]. Therefore, a good knowledge of the geochemical frame of a watershed is needed to understand these transfers which are related to the mobility of elements during erosion and transport [25]. Some elements remain dissolved from upstream to downstream, whereas others are easily transferred to solid and colloidal phases, depending on the water physical parameters (pH, temperature, redox conditions, organic matter abundance, etc). The role of colloids may be particularly important, depending on the element [23,24], but this aspect is not investigated in this paper.
We observe in Figs. 3 and 4 that most of the investigated elements of the Var River water (filtered at 0.45 μm) show almost constant concentrations between the Vésubie River confluence and the mouth, whereas Cs and As decrease significantly. Moreover, Cs concentration in Var water is sharply increasing at the Tinée confluence, but unlike the other elements, this is not due to a simple mass balance effect because Cs concentration in Tinée River is much lower than in the Var River. We may conclude that Cs is not stable in the Var River aqueous phase: (a) Cs is probably adsorbed on SPM and/or sediments in the lower Var Valley, and (b) Cs is transferred from these solid phases to water at the Tinée confluence. This last event is probably the result of physical parameters variations controlling mobility. Nevertheless, pH and temperatures are similar in both rivers: for instance, they were 8.03/6.8 °C in Var River and 8.01/6.9 °C in Tinée River, respectively, on 14th November 2007. Therefore, these parameters are not good candidates to explain this transfer. Unfortunately, other parameters were not measured, and therefore this phenomenon needs to be investigated in more details (in progress).
A comparison of “dissolved” element concentrations in different samples of water containing variable SPM in a same location, should allow us to identify the most mobile elements during transportation. The Var River flood of 12th January 2008 was investigated with this aim: we analysed trace element concentrations in water before, during and after the flood. The corresponding geochemical data (As, Cs, Mo, W, U) are shown in Fig. 8. The exact SPM concentration was not measured, but it was clearly related to the discharge. Although the water was never completely transparent, the less muddy water was sampled on 10th January, then the discharge and SPM amount increased on the 11th, reached a maximum on 12th then regularly decreased. The ratios U/Mo, U/W and U/As remain relatively stable during this six days period, although a slight decrease appears for the 12th January main flood. The lower relative U concentration during the main flood may be explained either by a relative higher raining regime in specific tributary catchments (as proposed by [34] in the Rhône watershed) characterized by lower U concentration rocks, or by a higher adsorption of U on SPM. Chemical analysis of the solid fraction (not done) would help to choose between these two hypotheses. The Cs case is clearer. Fig. 8 shows a sharp decrease of Cs/W, Cs/U, Cs/Mo and Cs/As ratios related to discharge and SPM amount, indicating that Cs is strongly transferred from water to solid fraction.
This is confirmed by the fact that the Cs concentration in groundwater of the lower Var valley is much lower than in surface water which is partly supplying groundwaters (Figs. 3 and 4). Here it is likely that Cs is transferred to the sediments of the alluvial plain.
8 Conclusions
The preliminary geochemical data obtained on the Var hydrological system allow us to give the following information on the trace element distribution and evolution in a typical Mediterranean River:
- (1) Because the geology of the Var River catchment is diversified, each component (tributaries and main stream, groundwaters of different origins) displays a specific geochemical natural signature.
- (2) Although we could not sample in detail water affected by very different discharges, the signatures do not seem strongly dependent on discharge for most of the investigated trace elements. Moreover, the relative geochemical contribution of each tributary in the main stream is not strongly variable for the three sampling campaigns.
- (3) Although general relative concentrations for different aquifer types have been proposed for the main Alpine groundwaters [17], the detection of anthropogenic pollution needs a precise knowledge of the natural background for each catchment, including surface waters and groundwaters. Concentration ratios should be preferred in order to minimize dilution effect related to raining episodes.
- (4) In Mediterranean regions, the amount of suspended particulate matter may be highly variable, particularly where marls are abundant. Therefore, for a good understanding of the chemical processes involved in a catchment, we need a comprehensive study on elements transfer between aqueous, solid (suspended particulate matter and sediments) and colloidal phases. For instance, we could observe that Cs is more easily transferred to solid phase in surface and underground waters than other elements.
- (5) A significant natural pollution by arsenic, affecting some specific areas of the catchment mainly originates from metamorphic rocks of the Mercantour massif and continental argillites.
- (6) Trace elements appear as a powerful tool to determine the detailed operating mode of groundwater circulations where mixture of waters from various origins is involved.
- (7) Trace elements studies on surface and ground waters over long periods of time are necessary (a) to determine the relative contributions of various aquifers and their evolution with time and (b) to anticipate pollution problems in an environment affected by climatic changes and increasing anthropogenic pressure.
Acknowledgements
We acknowledge Ph. Abela for sampling, J.-F. Gal, A. Barats, M. Dubar and an anonymous reviewer for a critical review of the manuscript. This study is in part financially supported by Conseil Général 06, Agence de l'Eau, Syndicat Mixte d'Etude de la Basse Vallée du Var, VEOLIA Eau and Région PACA.