

1 Introduction
In the area of depollution, the example of automotive exhaust gas after treatment [1] has demonstrated the complementarity of catalyst design and process design for higher performance. While Pt-based oxidation catalysts of the early converters evolved towards the three-way Pt-Rh catalysts, the classical fixed bed of millimetric particles evolved towards the monolith to minimize pressure drop and internal diffusion resistance; now the “cold trap” is used to better monitor pollutant release at cold-start.
This complementary approach, which is typical of process intensification applied to environmental issues, will be illustrated by three examples of research carried out at the LGPC.
2 A three-step process for the treatment of aqueous effluents loaded with phenolic compounds
The main drawback of water depollution is the slow reaction rate due to the low pollutant concentration level. Even the best available catalyst may require too high a pressure or a temperature to be efficient; this is well illustrated by catalytic wet oxidation. The second problem is that most people think of destroying the pollutant instead of destroying first the toxicity of the pollutant. With both ideas in mind, one may design a new depollution process of water containing chlorophenols [2]:
- • hydrogenation/hydrogenolysis instead of oxidation is a candidate reaction for toxicity reduction since it leads to cyclohexanol that can be destroyed in a standard biological water treatment plant;
- • preliminary adsorption of the pollutant(s) ensures the quality of the treated water and enables one to confine the pollutant within the process;
- • finally, the design of a solid that is both the adsorbent and the hydrogenation catalyst leads to an intensified process wherein purification by adsorption and toxicity destruction takes place.
The third item above may seem paradoxical: if the pollutant is strongly adsorbed on the solid, it will be poorly available for the catalytic sites. Fortunately, simple chemistry yields the solution: at natural pH (slightly acidic), chlorophenol are neutral molecules that can be strongly adsorbed on charcoal. At higher pH, after adding sodium hydroxide, the phenol group ionizes and the molecules are much more available for some metal catalyst deposited on the charcoal. Incidentally, soda is then used to neutralized the hydrochloric acid produced by the hydrogenolysis of the CCl bond.
The depollution process is performed in a single fixed bed using a periodic sequence of three steps: adsorption, catalytic hydrogenation and thermal regeneration. The solid in the fixed bed is 3% w/w ruthenium on activated carbon. This material is suitable for both liquid–solid adsorption (first step) and gas-liquid-solid catalytic hydrogenation (second step). Fig. 1 illustrates the laboratory-scale process.
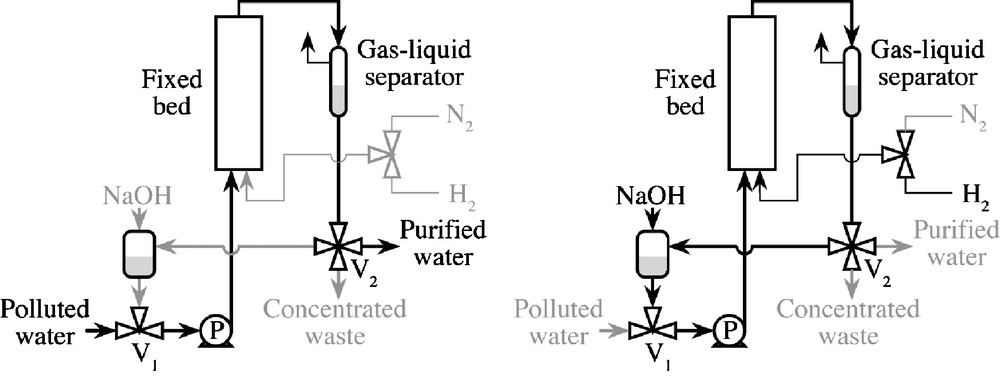
Apparatus used for the decontamination of phenol-polluted waters by catalytic hydrogenation. Schematic of the pilot-scale process; left: adsorption/purification step, right: hydrogenation step.
2.1 Adsorption–concentration step
Waste water is continuously fed (pump P) to a fixed bed of pollutant-free activated carbon at ambient temperature and close to atmospheric pressure. As long as the outlet concentration is below the upper limit, a depolluted effluent is obtained. When the upper limit is reached, purification stops and two three-way valves (V1 and V2) allow for recycling of the polluted solution through the fixed bed, condenser, gas-liquid separator and liquid tank.
2.2 Hydrogenation step
Hydrogen is then fed to the fixed bed, which is operated in a co-current up flow mode under mild pressure conditions (less than 3 MPa). In the case of chlorophenol hydrogenation, sodium hydroxide is added to the recycled solution since it promotes chlorophenol desorption as chlorophenolate ions. Sodium hydroxide is also used to neutralize the hydrochloric acid produced during the reaction.
2.3 Regeneration step
Once the reaction is complete, the solution is discharged, the fixed bed is flushed with pure water and it is thermally regenerated under hydrogen to recover the initial state of the adsorbent and catalyst, and a new cycle is initiated.
2.4 Limitation of the process
Each of the step may bring its limitations to the whole process:
- • the adsorption–concentration: it is generally very efficient for simple or more complex phenolic compounds; however, it has been observed that presence of high molecular weight molecules (such as lignin) may hinder the adsorption of the pollutants;
- • the catalytic hydrogenation: like any other hydrogenation catalyst the Ru/carbon used may be sensitive to poisons. So far, the only poison clearly evidenced has been the Ca2+ ion. No significant deactivation has been observed for cumulated time of tens of hours during long time runs of 4-chlorophenol hydrogenation, but the catalyst lifetime has to be estimated to confirm the interest of the process. The use of Ru as catalyst may give rise to the question of the release of this metal in the effluents, but so far, under the operating conditions used, no leaching was observed.
2.5 Advantages of the process
Chaining the adsorption and reaction steps has several decisive advantages which make the process original:
- • the adsorption of aromatic compounds on activated carbon is efficient, even at ambient temperature. This ensures low energy costs during the purification step. More or less severe conditions (T and P) are required only in the reaction step;
- • prior to the reaction step, partial desorption by a base leads to a concentrated solution of pollutant. The reaction rates are thus much higher as compared with the treatment of the raw polluted effluent. Alternatively, the required amount of catalyst is much lower;
- • the reaction products are concentrated in a small volume of residual liquid. The lower the concentration of pollutant in the feed stream, the smaller the fraction of residual liquid, and the longer the adsorption step under ambient conditions. Conversely, the reaction step is independent of the concentration level of the polluted water;
- • using a single vessel and catalytic adsorbent for both steps ensures pollutant confinement. An appropriate fluid distribution to several fixed beds at various stages of the cycle would make the process quasi-continuous.
Up-scaling the adsorption step requires to know the relation between the pollutant concentration in waste water, the flow rate of polluted water, and the critical time at which the critical concentration of pollutant is reached at the outlet of the adsorption fixed bed. For that purpose, experimental breakthrough curves have been recorded under various conditions and a model has been built, based on the adsorption isotherm of the pollutant on the activated carbon, and of the kinetics of adsorption. This model relies upon the following assumptions:
- • one dimensional plug-flow prevails;
- • the particles behave as a pseudo-homogeneous medium where the pollutant diffuses;
- • external mass-transfer limitation is accounted for;
- • adsorption equilibrium prevails at the fluid-solid external surface and gives global breakthrough curves in good agreement with experimental ones; however, it tends to underestimate the critical time.
The limitations of this model and the ways to overcome them in order to extrapolate the process are discussed in detail in previous papers [2,3].
In order to model the reaction step, it is necessary to know the kinetic of hydrogenation of specific phenolic compound. The detailed kinetics of 4-chlorophenol hydrogenation has been reported in a previous paper [4]. It has also been shown that 13 different mono-, di-, tri-, tetra- and pentachlorophenols could undergo catalytic hydrodechlorination and hydrodearomatisation in the same conditions. The same applies to 4-chloroaniline and 6,6′-dichlorodibenzyle. The kinetics of tyrosol (a model for the complex phenolic compounds found in olive mill waste waters) hydrogenation has also been reported in detail [5].
We have shown that combining adsorption and catalytic hydrogenation leads to an original and efficient detoxification process which works under mild conditions (298–353 K, 0.3–0.5 MPa). It involves a “dual-purpose” catalyst which take part in both adsorption and catalytic processes. In order to validate this process for a specific effluent, the catalyst sensibility to poisoning has to be checked, together with possible deactivation. Although some other points have to be further investigated such as the regeneration of the adsorbent catalyst or the cost of the required infrastructure, the depollution of phenol-containing waste waters by catalytic hydrogenation is a process that should not be discarded and may compare favourably with the oxidative ones. Catalytic hydrogenation could be used in combination with biological depollution treatments to overcome their limitations i.e. when the pollutant concentration is too high or when the treated compounds are toxic for the microorganisms.
3 Recreating the pollutant to better control the pollution
Many human activities (agricultural or industrial) lead to the pollution of water by nitrogen compounds such as NH4+, NO2− and NO3−. As these compounds are potentially harmful to human health as well as to the environment, it is therefore necessary to treat water thus polluted in order to decrease their content below the authorized level [6,7] (Table 1). Catalytic hydrogenations of NO3− and NO2− into nitrogen gas have been the topic of many studies during the last years [8]. The catalysts used were Pd-based and the most efficient involved a Pd-Cu catalytic system. Table 2 present some – amongst many others – of the catalytic systems proposed during the last decades. The main drawback of such processes remains a selectivity towards nitrogen N2 which is too low for practical applications because of the production of large quantities of the very harmful ammonium ions. One point to notice is that whatever the amount of work involved in developing new catalytic formulation, the most recently proposed are not significantly better than the first Pd-Cu system proposed by Hörold et al. [9].
Limits for nitrogen compounds in drinking water [6].
| Compound | Guide level CEE (mg/L) | Maximal concentration France (mg/L) |
| NO3− | 25 | 50 |
| NO2− | – | 0.1 |
| NH4− | 0.05 | 4 |
Selectivity towards N2 in the catalytic hydrogenation of NO3−.
| Catalyseur | Selectivity | Reference |
| Pd-Cu/Al2O3 | 95 | [9] |
| Pd-Cu/Al2O3 | 95–97 | [10] |
| Pd-In/Al2O3 | 97–98 | [11] |
| Pd-Sn/Al2O3 | 63–88 | [12] |
| Pd-Cu/Al2O3 | 95 | [13] |
| Pd/CeO2 | 80 | [14] |
| Pd-Au/Al2O3 | 92–97 | [15] |
| Pd-Au-Sn/Al2O3 | 85–92 | [16] |
To overcome this issue, a new concept is now proposed that couples two steps (Fig. 2): the catalytic hydrogenation allows for the abatement of nitrate ions with concomitant formation of nitrogen and ammonium ions (‘red’ step), while the photocatalytic oxidation of ammonium ions leads back to the formation of nitrate ion, some further nitrogen being produced (‘blue’ step).
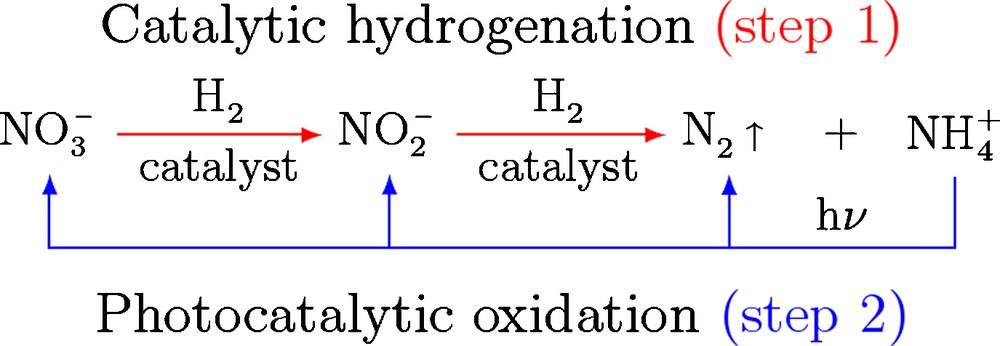
Principle of the catalytic hydrogenation–photocatalytic oxidation coupling.
The combination of both techniques in a cyclic process should lead to a lower amount of nitrate at the outlet through a partial formation of gaseous nitrogen in each cycle.
3.1 Catalytic hydrogenation of the nitrate ions
However, the catalytic photo-oxidation of the ammonium ion can only be carried out at a sufficient rate in a basic medium. For this reason, catalysts working in this medium such as Raney Ni or Co have been tested (Table 3).
Performance of the Raney catalyst tested for nitrate hydrogenation (reaction condition T = 373 K, , [NO3−]o = 400 mg/L−1).
| Catalyst | Additive | Activity (mmol/min/gcat.) | Selectivity to NH4+ (%) | Reaction time (min) |
| Pd-Cu/C | – | 9.3 × 10⁻⁵ | 76 | 300 |
| Ni (1) | 0.54 | 41 | 180 | |
| Ni (2) | 3.62 | 59 | 15 | |
| Ni (3) | 2.40 | 72 | 15 | |
| Ni (4) | Fe, Cr | 1.54 | 78 | 130 |
| Ni (5) | Fe, Cr | 4.00 | 69 | 5 |
| Co (1) | Cr | 0.33 | 58 | >200 |
| Co (2) | Ni, Cr | 0.02 | 69 | 180 |
The main results achieved are:
- • monometallic Raney Ni are active for nitrate hydrogenation;
- • an activity of 1 mg/L/min/gcat much larger than those of Pd-Cu catalysts is achieved;
- • no deactivation is observed during successive reloads of NO3− in a batch reactor;
- • some Raney Ni doped by other metal are even more active than monometallic ones;
- • Raney Co are generally less active.
3.2 Photocatalytic oxidation of the ammonium ions
A study of this reaction was undertaken in order to:
- • quantify the pH effect on the photocatalytic oxidation of ammonia;
- • determine the effect of several parameters (TiO2 concentration, temperature, initial NH4+ concentration), on the rate of decomposition of NH4+ in the presence of a photocatalyst TiO2 alone or doped with transition metals, and on the formation of the nitrogen species.
The main results of this study are:
- • the catalytic degradation of NH3/NH4+ in water in the presence of TiO2 as photocatalyst is possible in a basic medium;
- • the addition of a metal allows for an activity increase, especially the addition of Zn, Fe or Ni;
- • the different Metal/TiO2 photocatalysts present very different selectivities: Ni/TiO2 and Fe/TiO2 are those which result in the highest production of molecular nitrogen.
And thus the photocatalysts that are:
- • active with characteristic time similar with those of the hydrogenation reaction;
- • selective since they partially convert NH4+ ions into N2;
- • working in pH condition compatibles with those of the hydrogenation reaction and with the effluent release regulation (6,5 < pH < 9);
have been obtained during this study as an example at a pH of 10 and with Zn (3%)/TiO2 suspensions, a degradation yields of 60% is achieved after 5 h and less than 34% of the converted NH3/NH4+ is transformed in NO3−, the other product being considered as molecular nitrogen.
The detailed study of the photocatalytic oxidation step is reported in an other paper [17].
3.3 Advantage and drawbacks
The main advantage of the process proposed is that it does not require an hydrogenation catalyst extremely selective towards N2, a moderately selective hydrogenation catalyst is acceptable since the second step transform the formed NH4+ ions. Moreover, by coupling two processes, it offers more parameters to adjust in order to reach a satisfactory working point that is an effluent release with the nitrogen ions below the authorized level.
The pH compatibility of the two steps being demonstrated, the combination of the two steps is under study.
4 Reverse flow reactor: trapping the heat inside
Destroying Volatile Organic Compounds (VOC) diluted in air by combustion is easy. However, the gas temperature must be high enough to ignite combustion and, whatever the VOCs and the catalyst, about 150–200 °C is necessary at least. This means that a lot of energy is necessary to heat up the air stream; for instance, heating 10 000 Nm3/h of air from 20 to 150 °C requires about 450 kW. If air contains 1 g.m−3 of xylene (model solvent for paints), the adiabatic temperature rises due to combustion of 34 °C, and about 300 kW must still be provided to reach ignition. It is thus necessary to couple the catalytic purification together with an efficient heat supply-and-recovery process.
The RFR technology is the key to this energy issue, and it was originally proposed by Boreskov and Matros [18]. Fig. 3 illustrates the basic concept.
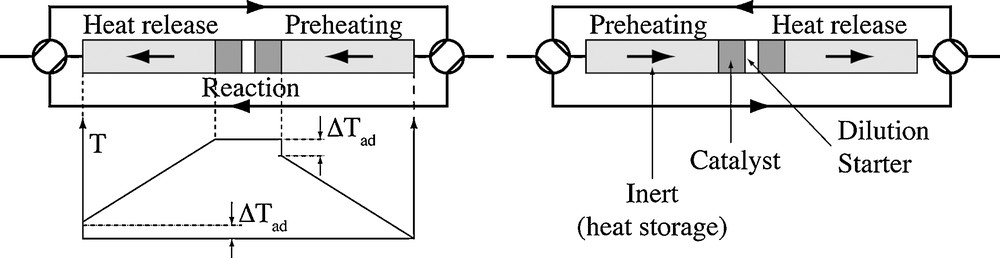
Schema of the RFR.
The reactor is a symmetric bed (packed, monolithic…) made of catalytic (dark grey) and heat storage (light grey) elements. An inlet–outlet manifold allows reversing the flow direction periodically. In the middle part of the system, there is a starter (electric resistance, gas burner…). Assume that the reactor is initially cold and the starter is switched on so that heat is generated in the middle of the reactor. Owing to gas flow, the heat generated by the starter is used to heat up the downstream elements (catalyst and inert). Because the heat capacity of the solid is much higher than that of the gas, the heat is “trapped” in the downstream solid. When flow is reversed, the cold incoming gas is slightly preheated by the previously warmed solid, then heated by the starter and it finally releases heat to the “new” downstream elements. Because heat moves much more slowly than the gas flows owing to the heat capacity, the heat generated by the starter progressively accumulates in the solid element on both sides, temperature increases and a Λ-shaped temperature profile builds up. When the middle temperature is high enough, VOC combustion takes place and it becomes the energy supply: the starter can be switched off.
The temperature profile is almost symmetrical as indicated in Fig. 3 left. The slight difference between the inlet and outlet temperature is, at most, the adiabatic temperature rise (no heat loss in the RFR). The reactor behaves as a “temperature amplifier”: in the adiabatic case, the maximum temperature in the middle of the reactor close to the catalytic element is given by:
| (1) |
| (2) |
| (3) |
Fig. 4 shows a typical experimental example. The continuous curves are obtained from a detailed model. The dotted curve is obtained from a linear and simple model that accounts for heat loss and that can be solved with a pocket calculator or better using a spreadsheet editor [19]. The agreement is excellent, and it shows that simple calculation allows for designing the RFR, not only in the adiabatic case (as in Eqs (1)–(3)).
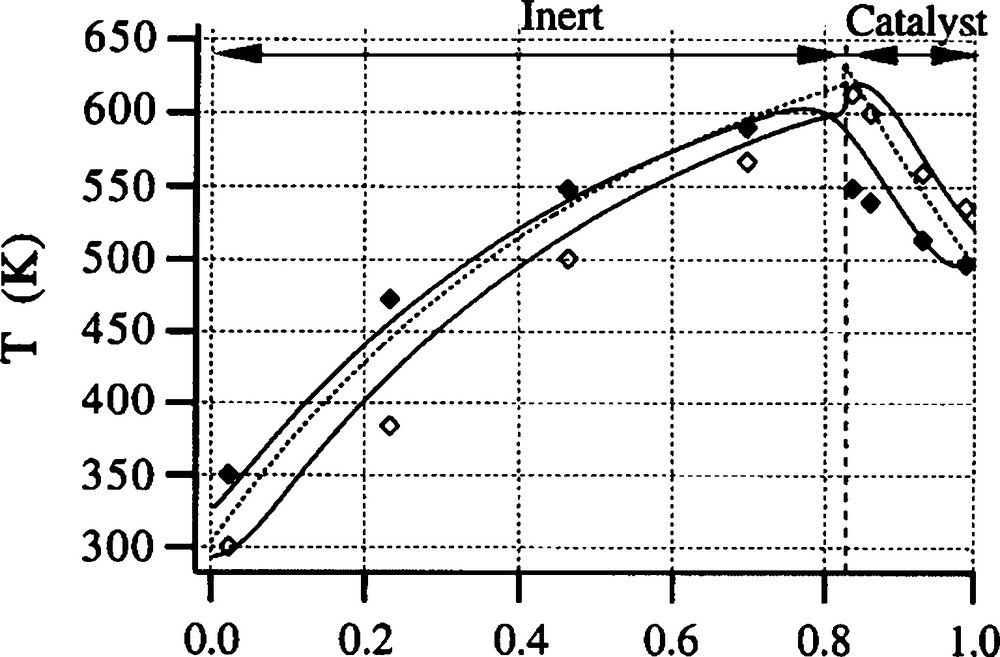
Temperature profiles (left-half of the reactor) for xylene combustion at flow reversal. Diamonds: upstream and downstream temperature; Curves: see text. ΔTad = 30 K, Pe = 35, Linert = 2 × 355 mm, Lcatalyst = 2 × 75 mm.
4.1 Advantages and drawbacks
The RFR is typical of the “process intensification” philosophy since it couples a reactor and a heat exchanger. In addition to this fashionable concept, the RFR has unrivalled advantages:
- • suffice to increase the length of inert material to increase the maximum temperature and, consequently, to purify even more diluted gas streams;
- • if the catalyst deactivates owing to too high a temperature or independent poisoning, the upstream face of the catalyst element becomes part of the adjacent inert element. As a consequence, temperature at the catalyst entrance increases along catalyst deactivation and counteracts deactivation… until the whole catalyst element is deactivated;
- • because of the heat capacity of the solid, the characteristic heating or cooling time of the reactor can be of several tens to hundreds of minutes. In other words the dynamic response of the reactor is very slow. This allows accepting sudden (although brief) lack or burst of pollutant (change of color in printing or painting industries, solvent leaks…);
- • since the maximum temperature is proportional to the adiabatic temperature which is in turn proportional to the concentration of pollutant, temperature becomes a “measure” of this concentration. This can be used for control purpose [20].
Conversely, there are drawbacks:
- • flow reversal requires switching valves over a long time. For some applications, the switching frequency is about a few tens of seconds;
- • the slow dynamics is not only an advantage: start-up of the reactor can be very long;
- • the more diluted the pollutant, the thinner the operating window from a thermal point of view. If the pollutant is very diluted, one would need a “long” RFR, i.e. a high Péclet number to compensate for the low ΔTad. For instance, if ΔTad = 1 K, one needs Pe = 200 to enable the catalyst to reach about 200 °C. If the pollutant concentration becomes five times higher, i.e. ΔTad = 5 K, still a very low energy content, the same RFR would reach 1000 °C, which would probably destroy the catalyst.
5 Conclusion
These examples lead to five main conclusions.
The example of nitrate shows that improving the catalyst is not sufficient in general, especially when selectivity is involved. In such a case, the design of the reactor (or reactors), the coupling with other processes (adsorption, electro- and photo-chemistry, plasma…) and the control strategy (reverse flow, periodic operations…) become of prime importance.
Progress in either field, catalysis or process, generally boosts progress or generate problems in the other field: the Pt-Rh catalyst for three-way catalysis required an accurate control of the air–fuel ratio (engine design); the uncertainties in this ratio were then compensated by the transient oxygen storage in ceria (catalyst design).
Process and catalyst design concepts should not be used successively, hierarchically or independently. They must be used together as a multidisciplinary approach that stimulates synergy: knowledge of chemistry (phenol–phenolate equilibrium, hydrogenolysis–hydrogenation) and of chromatographic process (breakthrough curve prediction) and of three-phase reactor technology and control are necessary for the chorophenol problem.
Problem formulation is also important: the depollution problem does not necessarily require pollutant destruction. Conversely, it always requires toxicity destruction. The latter formulation allows using hydrogenation of phenol instead of oxidation.
Finally, as time goes on, regulation will become more and more stringent. This means that even more diluted streams will require deep treatments. Improving the catalyst is a possible solution; however, trapping and concentrating the pollutant by a suitable process, or concentrating another activating agent (photons, electrons, heat, plasma…) in a suitable device is another solution.