

1 Introduction
Gangliosides, the GSL carrying one or more sialic acid residues, are essentially located in the outer part of the plasma membrane in microdomains named “glycosynapses”, where they can interact with transmembrane receptors or signal transducers involved in cell proliferation and intracellular signaling [1,2].
GSL from ganglio-series are usually classified in four series according to the presence of 0 to 3 sialic acid residues linked to LacCer: β-Galp-(1→4)-β-Glcp-Cer (LacCer, GA3). The transfer of sialic acid residues is catalyzed in the Golgi apparatus by specific sialyltransferases (namely GM3 synthase, GD3S and GT3 synthase, respectively) that exhibit a high specificity toward their respective glycolipid substrates [3]. Thus, GA3, GM3 (α-Neup5Ac-(2→3)-β-Galp-(1→4)-β-Glcp-Cer), GD3 (α-Neup5Ac-(2→8)-α-Neup5Ac-(2→3)-β-Galp-(1→4)-β-Glcp-Cer) and GT3 (α-Neup5Ac-(2→8)-α-Neup5Ac-(2→8)-α-Neup5Ac-(2→3)-β-Galp-(1→4)-β-Glcp-Cer) initiate 0-, a-, b- and c-series gangliosides and the biosynthesis of these compounds determines the relative proportion of gangliosides in each series (Fig. 1). The steady state level of membrane-associated gangliosides is therefore dependent on the activity of corresponding sialyltransferases, and the expression of b- and c- series gangliosides is strictly controlled by ST8Sia I, also named GD3S. Afterwards, further monosaccharides, including GalpNAc, Galp and Neup5Ac, can be transferred in a stepwise manner by other glycosyltransferases [4].
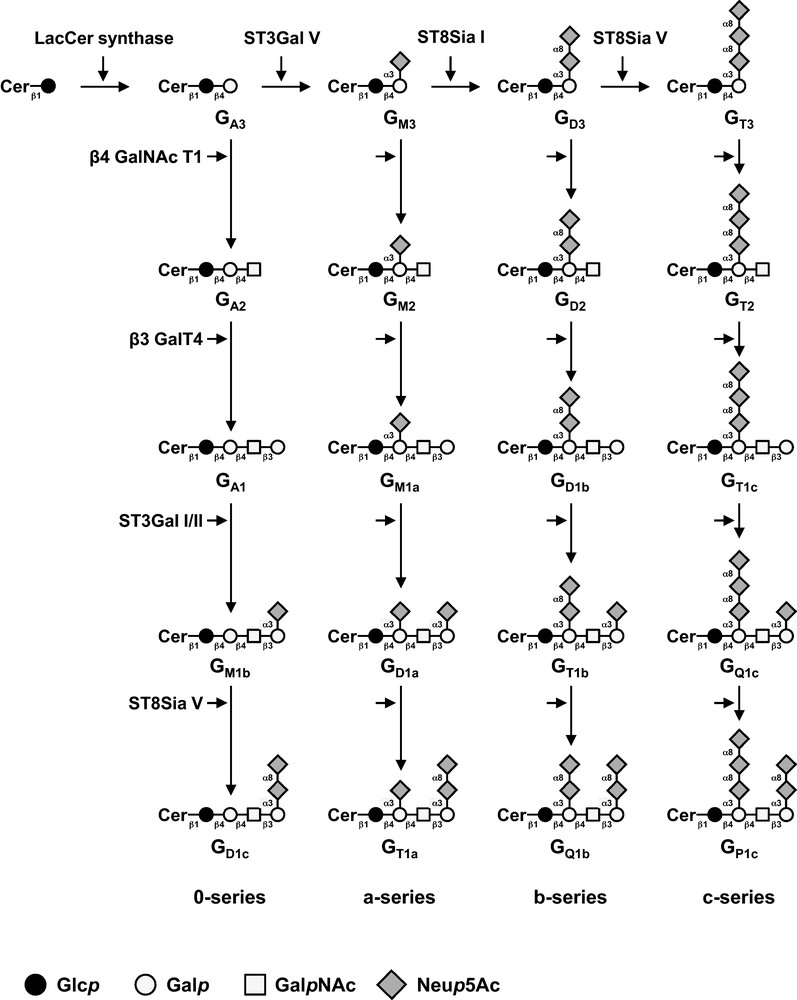
Biosynthesis of gangliosides. The action of ST3 Gal V (GM3 synthase), ST8Sia I (GD3 synthase) and ST8Sia V (GT3 synthase) leads to the biosynthesis of the precursors of a-, b- and c-series gangliosides, respectively. The 0-series gangliosides are directly synthesized from lactosylceramide (GA3). Elongation is performed by the sequential action of N-acetyl-galactosaminyltransferase (β4GalNAc T1), galactosyltransferase (β3 Gal T4) and sialyltransferases (ST3 Gal I, ST3 Gal II and ST8Sia V). Cer: ceramide; LacCer: lactosylceramide.
Normal human tissues usually express a-series gangliosides, mainly GM1a, whereas complex gangliosides from b- and c-series are essentially found during embryogenesis, in developing tissues and are mostly restricted to the nervous system in adult [5]. Complex gangliosides expression also increases in different pathological conditions including cancers, such as melanoma [6], neuroblastoma [7], or small cell lung carcinoma [8]. In particular, disialogangliosides (GD3 and GD2) play a key role in proliferation and migration of neuro-ectoderm-derived tumor cells [9] and are used as targets for development of anti-cancer vaccines [10]. In breast cancer, GD3 and 9-O-acetyl-GD3 are over-expressed in about 50% of invasive ductal carcinoma [11] and ST8SIA1, the gene that encodes GD3S, displays higher expression among ER negative breast cancer tumors [12,13]. We have previously shown that GD3S expression in the ER-negative MDA-MB-231 cells results in the accumulation of b- and c- series gangliosides [14] and mass spectrometry analysis of permethylated GSL has shown that GD2 is the main ganglioside expressed at the cell surface of MDA-MB-231 GD3S+ clones (unpublished data). The expression of GD2 is associated with an increased cell migration and with a proliferative phenotype of MDA-MB-231 GD3S+ clones in absence of serum or exogenous growth factors [14]. We have also shown that the proliferative capacities of MDA-MB-231 GD3S+ clones in serum-free conditions directly proceed from the specific and constitutive activation of c-Met receptor and the downstream MEK/ERK and PI3 K/Akt signaling pathways [15]. Moreover, GD3S expression also stimulates primary tumor growth in severe immunodeficient mice [15].Here, we describe the effect of GD3S expression in MCF-7 cells, a usual model of ER-positive breast cancer cells in culture. We show by mass spectrometry that the MCF-7 GD3S+ cells accumulate di- and trisialogangliosides, mainly GD1b. Moreover, the MCF-7 GD3S+ clones showed an increased migration without any change in proliferation compared to control cells.
2 Material and methods
2.1 Antibodies and reagents
Anti-GM3 GMR6 (mouse IgM) and anti-GD2 (mouse IgG3) S220-51 mAbs were purchased from Seikagaku Corp. (Tokyo, Japan). Anti-GD3 R24 mAb was purchased from AbCam (Cambridge, UK). Anti-GD1b GGR12 mAb (mouse IgG2b) [16] was kindly provided by Pr. Ronald L. Schnaar (Depart. of Pharmacology and Neuroscience, The Johns Hopkins University School of Medicine, Baltimore, USA). Anti-GT3 A2B5 mAb [17] was kindly provided by Pr. Jacques Portoukalian (Depart. of Transplantation and Clinical Immunology, Claude Bernard University and Edouard Herriot Hospital, Lyon, France). FITC-conjugated cholera toxin B-subunit from Vibrio cholerae was from Sigma-Aldrich (Lyon, France) and FITC-conjugated sheep anti-mouse IgG was from GE Healthcare (Templemars, France). Alexa Fluor 488 donkey anti-mouse IgG (H + L), Alexa Fluor 488 donkey anti-mouse IgM and FITC-conjugated anti-mouse IgM were purchased from Molecular Probes (Invitrogen, Carlsbad, CA, USA). Mouse mAb directed against the cytoplasmic region of human c-Met was purchased from Invitrogen, and rabbit polyclonal antibody against phosphorylated tyrosine 1234 and 1235 of the c-Met kinase domain was purchased from Cell Signaling Technology (Danvers, MA, USA). Anti-rabbit and anti-mouse IgG conjugated with horseradish peroxidase were purchased from GE Healthcare.
2.2 Cell culture
The breast cancer cell line MCF-7 and the melanoma cell line SK-Mel 28 were obtained from the American Type Cell Culture Collection. Cell culture reagents were purchased from Lonza (Levallois-Perret, France). Cells were routinely grown in monolayer and maintained at 37 °C in an atmosphere of 5% CO2, in DMEM supplemented with 10% FBS, 2 mM l-glutamine, and 100 units/mL penicillin-streptomycin. MCF-7 control (empty vector transfected) and MCF-7 GD3S+ clones #1 and #4 were cultured in the presence of 1 mg/mL G418 (Invitrogen).
2.3 Stable transfection
The pcDNA3-GD3S expression vector encoding the full-length human GD3 synthase [18] was obtained from Pr. C.H. Kim (Molecular and Cellular Glycobiology Unit, Department of Biological Science, SungKyunKwan University, Suwon, Korea). Transfections were performed by electroporation using the Nucleofection technology according to Amaxa Biosystem protocol (Lonza). Briefly, 2 × 10⁶ cells were resuspended in 100 μl of Cell Line Nucleofector™ Solution V and cell suspension was mixed with 2 μg of pcDNA3 or pcDNA3-GD3S vector. The sample was transferred into an electroporation cuvette and transfection was performed using the program E-014 according to manufacturer's instructions. After nucleofection, cells were transferred into prewarmed complete DMEM medium and maintained at 37 °C in an atmosphere of 5% CO2. After 48 h, the transfected cells were cultured in the presence of 1 mg/mL G418 (Invitrogen). After 21 days of culture in the selective medium, individual G418-resistant colonies were isolated by limit dilution. Two positive clones (#1 and #4), expressing GD3S and complex gangliosides, as determined by real-time PCR and flow cytometry analysis, respectively, were used for further study.
2.4 Extraction and preparation of glycolipids
20 dishes (10 cm diameter) of cultured cells were washed twice with ice-cold PBS and cells were scraped and homogenized. Cells were suspended in 200 μL of water and sonicated on ice. The resulting material was dried under vacuum and sequentially extracted by CHCl3/CH3OH (2:1, v/v), CHCl3/CH3OH (1:1, v/v) and CHCl3/CH3OH/H2O (1:2:0.8, v/v/v). Supernatants were pooled, dried and subjected to a mild saponification in 0.1 M NaOH in CHCl3/CH3OH (1:1) at 37 °C for 2 h and then evaporated to dryness [19]. Samples were reconstituted in CH3OH/H2O (1:1, v/v) and applied to a reverse phase C18 cartridge (Waters, Milford, MA) equilibrated in the same solvent. After washing with CH3OH/H2O (1:1, v/v), GSLs were eluted by CH3OH, CHCl3/CH3OH (1:1, v/v) and CHCl3/CH3OH (2:1, v/v).
2.5 Mass spectrometry analysis of GSL
Prior to mass spectrometry analysis, GSL were permethylated according to Ciucanu and Kerek [20]. Briefly, compounds were incubated 2 h in a suspension of 200 mg/mL NaOH in dry DMSO (300 μL) and CH3I (200 μL). The methylated derivatives were extracted in CHCl3 and washed several times with water. The reagents were evaporated and the sample was dissolved in CHCl3 in the appropriate dilution. MALDI-MS and MS/MS analyses of permethylated GSL were performed on 4800 Proteomics Analyzer (Applied Biosystems, Framingham, MA, USA) mass spectrometer, operated in the reflectron mode. For MS acquisition, 5 μL of diluted permethylated samples in CHCl3 were mixed with 5 μL of 2,5-dihydroxybenzoic acid matrix solution (10 mg/mL dissolved in CHCl3/CH3OH (1:1, v/v)). The mixtures (2 μL) were then spotted on the target plate and air-dried. MS survey data comprises a total of 50 subspectra of 1500 laser shots. Peaks observed in the MS spectra were selected for further MS/MS. CID MS/MS data comprises a total of 100 subspectra of 3000 laser shots. Two or more spectra can be combined postacquisition with mass tolerance set at 0.1 Da to improve S/N ratio. The potential difference between the source acceleration voltage and the collision cell was set to 1 kV and argon was used as collision gas.
2.6 Analysis of cell surface ganglioside by flow cytometry
Cells were washed in cold PBS and detached by EDTA 4 mM. Cells were incubated at 4 °C during 1 h with anti-ganglioside mAbs: anti-GM3 GMR6 (1:75), anti-GD3 R24 (1:100), anti-GD2 S220-51 (1:100), anti-GD1b GGR12 (1:100) and anti-GT3 A2B5 (1:10), diluted in PBS containing 0.5% PBS-BSA (Sigma-Aldrich). After washing with PBS-BSA, cells were incubated on ice during 1 h with FITC-conjugated anti-mouse IgM or IgG. To analyze GM1a expression, cells were incubated with a FITC-conjugated cholera toxin B-subunit (1:1000). Control experiments were performed using secondary antibody alone. Cells were analyzed by flow cytometry (FACScalibur, Becton Dickinson).
2.7 Analysis of ganglioside by confocal microscopy
Cells were cultured on glass coverslips in DMEM supplemented with 10% FBS. After 24 h, cells were washed twice in PBS and fixed in 4% paraformaldehyde (Sigma-Aldrich) for 20 min at room temperature. After washing with PBS, cells were blocked in PBS-BSA 0.2% for 30 min. Cells were incubated for 1 h at room temperature with anti-GD3 R24 (1:100), anti-GD2 S220-51 (1:100), anti-GD1b GGR12 (1:100) and anti-GT3 A2B5 (1:10), diluted in PBS-BSA. Cells were then washed three times in PBS-BSA and incubated with Alexa Fluor® 488 anti-IgG or anti-IgM (1 h at room temperature; dilution 1:2000 in PBS-BSA). After three washes in PBS-BSA, PBS and deionised water, cells were mounted in Mowiol. Stained slides were examined under a Leica SP5 spectral microscope (IRI CNRS USR 3078, Villeneuve d’Ascq, France) with a 63X oil immersion lens at room temperature. Data were therefore collected using the LAS 6000 AF software.
2.8 Quantitative real-time-PCR (QPCR) analysis of GD3 synthase
Total RNA was extracted using the Nucleospin RNA II kit (Macherey Nagel, Hoerdt, France), quantified using a NanoDrop spectrophotometer (Thermo Scientifics, Wilmington, USA) and the purity of the preparation was checked by ratio of the absorbance at 260 and 280 nm. The cDNA was synthesized using 2 μg of RNA (GE Healthcare). PCR primers for GD3S and HPRT were previously described [14,21] and synthesized by Eurogentec (Seraing, Belgium). PCR reactions (25 μL) were performed using 2X SYBR® Green Universal QPCR Master Mix (Stratagene, Amsterdam, The Netherlands), with 2 μL of cDNA solution and 300 nM final concentration of each primer. PCR conditions were as follows: 95 °C for 30 s, 51 °C for 45 s, 72 °C for 30 s (40 cycles). Assays were performed in triplicate and GD3S transcript expression level was normalized to HPRT using the 2−ΔΔCt method described by Livak and Schmittgen [22]. Serial dilutions of the appropriate positive control cDNA sample were used to create standard curves for relative quantification and negative control reactions were performed by replacing cDNA templates by sterile water.
2.9 Proliferation assays
Control and clones cells (2 × 10³) were seeded in 96-well plates (Thermo Fisher Scientific, Rockford, IL, USA) and grown in DMEM containing 5, 1, 0.5% FBS, or in FBS-free medium. Cell growth was analyzed at different times using the MTS reagent (Promega, Charbonnières-les-Bains, France) according to the manufacturer's instructions.
2.10 Cell migration analysis
Cells (5 × 10⁴) were seeded in the upper surface of Transwell 12 plates (BD Biosciences, Le-Pont-de-Claix, France) and cultured for 24 h in 10% FBS-containing medium. After incubation, cells were fixed in 4% paraformaldehyde (20 min at room temperature) and stained with Hoescht 33528 (Sigma-Aldrich) during 20 min in the dark at room temperature. Then, the upper chamber of the well's porous membrane was removed by scraping with a cotton swab and washed several times with PBS. The membrane was mounted on slide with Glycergel mounting medium (Dako, Trappes, France). The migrating cells were counted on the overall membranes under × 200 magnification and the mean number of cells was evaluated in three independent experiments.
2.11 Immunodetection of c-Met and phospho-c-Met
Cell pellets were treated with lysis buffer (150 mM NaCl, 50 mM Tris-HCl [pH 7.5], 1% Triton X-100, 1 mM sodium orthovanadate, and protease inhibitor cocktail tablet). The supernatants were assessed for protein concentration using the Bio-Rad DC protein assay kit II. One hundred microgram of total proteins were subjected to SDS-PAGE and transferred onto a nitrocellulose membrane. Membranes were saturated in TBS containing 5% BSA and 0.05% Tween-20. Membranes were then incubated with blocking buffer (0.2% casein, 0.1% Tween-20 in PBS) for 1 h and probed for 1 h at room temperature with appropriate antibodies diluted in blocking buffer according to the manufacturer's recommendations. After washing in PBS-Tween 0.2%, immune complexes were detected with specific secondary antiserum conjugated with alkaline phosphatase followed by an enhanced chemiluminescence detection system (Amersham ECL Western Blotting Detection Reagents).
2.12 Statistical analyses
Student's t-test was used for statistical analysis. p < 0.05 was considered as statistically significant.
3 Results
3.1 Establishment of GD3S+ MCF-7 breast cancer cells
MCF-7 cells were transfected with the pcDNA3-GD3S expression vector containing the full-length cDNA of human GD3S or the empty pcDNA3 vector as control. Transfected cells were cultured 21 days in the presence of 1 mg/mL G418. As previously shown [14], QPCR analysis of GD3S expression (Fig. 2A) indicates that GD3S mRNA is expressed at a very low level in wild-type and control (empty vector transfected) MCF-7 cells compared to SK-Mel 28 melanoma cells used as positive control for GD3S expression [23]. Meanwhile, GD3S expression was significantly increased in pcDNA3-GD3S transfected MCF-7 cell population. Flow cytometry analysis of gangliosides in both control and pcDNA3-GD3S transfected cells shows that GD3S stable transfectants do not expressed GD3 or GD2 and only a low percentage of cells (about 15%) expresses GD1b concomitantly with a decrease of GM1a expression, a larger proportion of cells being recognized by the anti-GT3 A2B5 mAb (Fig. 2B).
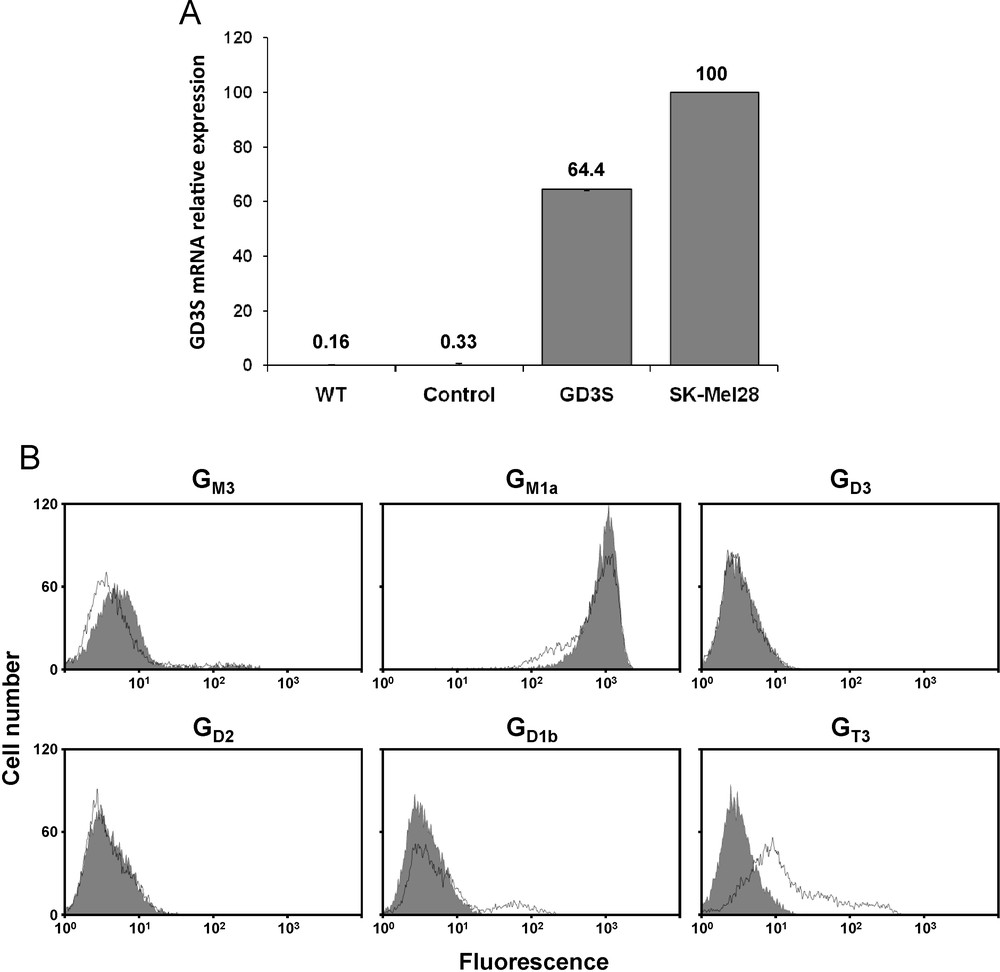
A: QPCR analysis of GD3S mRNA in pcDNA3-GD3S transfected MCF-7 cell population. Results were normalized to the expression of HPRT mRNA and expressed relative to GDS3 mRNA in SK-Mel 28 melanoma cells, which was regarded as 100%. The quantification was performed by the method described by Livak and Schmittgen [22]. WT: MCF-7 wild-type; Control: empty vector transfected MCF-7; GD3S: pcDNA3-GD3S transfected MCF-7. B: Flow cytometry analysis of gangliosides expression in pcDNA3-GD3S transfected MCF-7 cell population. The immunodetection of GM3, GD3, GD2, GD1b, GT3 and GM1a was performed using GMR6, R24, S220-51, GGR12, A2B5 mAbs and cholera toxin B-subunit from Vibrio cholerae, respectively. The grey peaks correspond to control MCF-7 cells (empty vector transfected) and black lines correspond to pcDNA3-GD3S transfected MCF-7 cells.
Given the fact that the pcDNA3-GD3S transfected cell population was heterogenous, individual G418-resistant colonies were isolated by limiting dilution cloning. Forty-three different clones were obtained and analyzed for the expression of GD3S and gangliosides. Positive clones for GD1b and GT3 expression were selected and two of them, clones #1 and #4, were used for this study. The pattern of gangliosides was monitored in the two clones by flow cytometry using different anti-ganglioside mAbs. As shown in Fig. 3A, the two selected clones expressed high levels of GD1b and GT3. In contrast, GM1a expression level was reduced (Fig. 3A). GD1b expression appeared to be slightly higher in clone #1 than in clone #4. Control cells showed no change in the ganglioside profile compared with wild-type MCF-7 (data not shown). Finally, immunofluorescence and confocal microscopy confirmed that GD1b and GT3 were expressed at the cell surface of both clones (Fig. 3B).
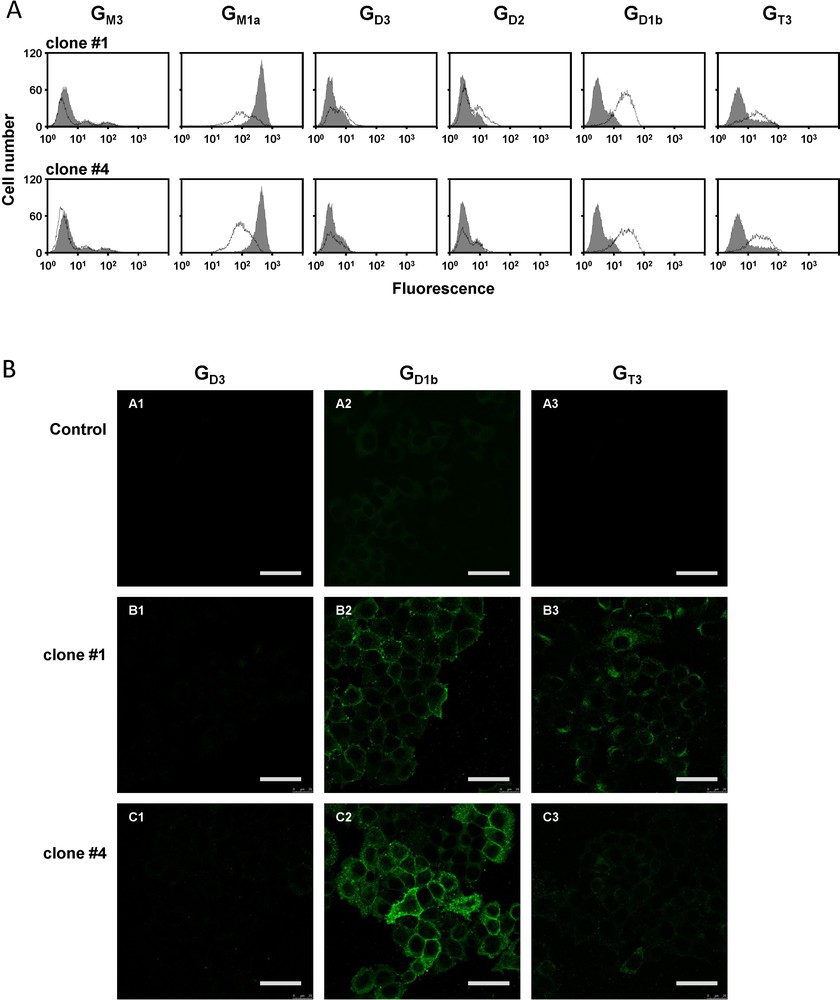
Analysis of the expression of gangliosides in MCF-7 GD3S+ clones. A: flow cytometry analysis of ganglioside expression. Gangliosides GM3, GD3, GD2, GD1b, and GT3 were revealed with anti-GM3 GMR6, anti-GD3 R24, anti-GD2 S220-51, anti-GD1b GGR12, and anti-GT3 A2B5 mAbs, respectively. GM1a expression was analyzed with FITC-labeled cholera toxin B from Vibrio cholerae. The grey peaks correspond to control MCF-7 cells, whereas black lines correspond to MCF-7 GD3S+ cells. Results are representative of three independent experiments. B: Analysis of ganglioside expression at the membrane surface MCF-7 cells by immunocytochemistry and confocal microscopy. Ganglioside were revealed with anti-GD3 R24 (A1, B1, C1), anti-GD1b GGR12 (A2, B2, C2) or anti-GT3 A2B5 (A3, B3, C3) mAbs and anti-mouse IgM or anti-mouse IgG labeled with Alexa 488. Bars: 50 μm.
3.2 Mass spectrometry analysis of GD3S+ MCF-7 cells GSL composition
In order to confirm the modifications in gangliosides composition observed by flow cytometry analysis in MCF-7 GD3S+ cells, we compared the GSLs profiles from control and GD3S+ MCF-7 cells by MALDI-TOF-MS and MALDI-TOF-MS/MS sequencing (Figs. 4 and 5). The total glycolipids were extracted and subjected to mild alkalinolysis. GSLs were further purified on reversed-phase C18 column and analyzed by mass spectrometry as permethylated derivatives. As shown in Fig. 4, the MALDI-MS analysis revealed that MCF-7 cells expressed a complex pattern of GSLs. Individual signals were identified by calculating monosaccharide and Cer compositions and by establishing monosaccharide sequences by MALDI-TOF-MS/MS fragmentation. Then, the final attribution of individual GSLs to existing series was based on the known biosynthetic pathways of GSLs in human cells. Altogether, the data established that MCF-7 cells expressed GSLs from the globo- and the ganglio-series. Each GSL, irrespective of their series, were identified as two distinct signals exhibiting 112 mu differences, which established that they are substituted by two Cer moieties differing by eight –CH2– groups. Indeed, two Cer isoforms are usually expressed in human tissues due to the substitution of the sphingosine by palmitic acid C16:0 or lignoceric acid C24:0. Globo-series GSLs were characterized by the presence of simple Gb3 and Gb4 at m/z 1215/1327 and 1460/1572, respectively. Ganglio-series GSLs were characterized by the presence of a single neutral GA1 at m/z 1215/1327, monosialylated GM2 and GM1 at m/z 1616/1728 and 1821/1933, as well as disialylated at m/z 2182/2294. MS/MS fragmentation of individual signals allows one to differentiate isobaric molecules such as Gb4/GA1 and GM1a/GM1b (data not shown). It is noteworthy that the MS/MS sequencing established that the disialylated GD1 expressed in empty vector-transfected MCF-7 cells was exclusively constituted by the a-series ganglioside. Indeed, the intense B- and C-cleavage ions at m/z [M + Na]+ 847 and 620 unambiguously established that the terminal Gal residue of the Hex-HexNAc motif was monosialylated (Fig. 5B). Accordingly to the attribution as GD1a, Y-cleavage ion at m/z [M + Na]+ 1469 and the Y2α/C5 double cleavage ion at m/z 810 [M + Na]+ confirmed that Galp-(1→4)-β-Glcp disaccharide was also mono-sialylated.
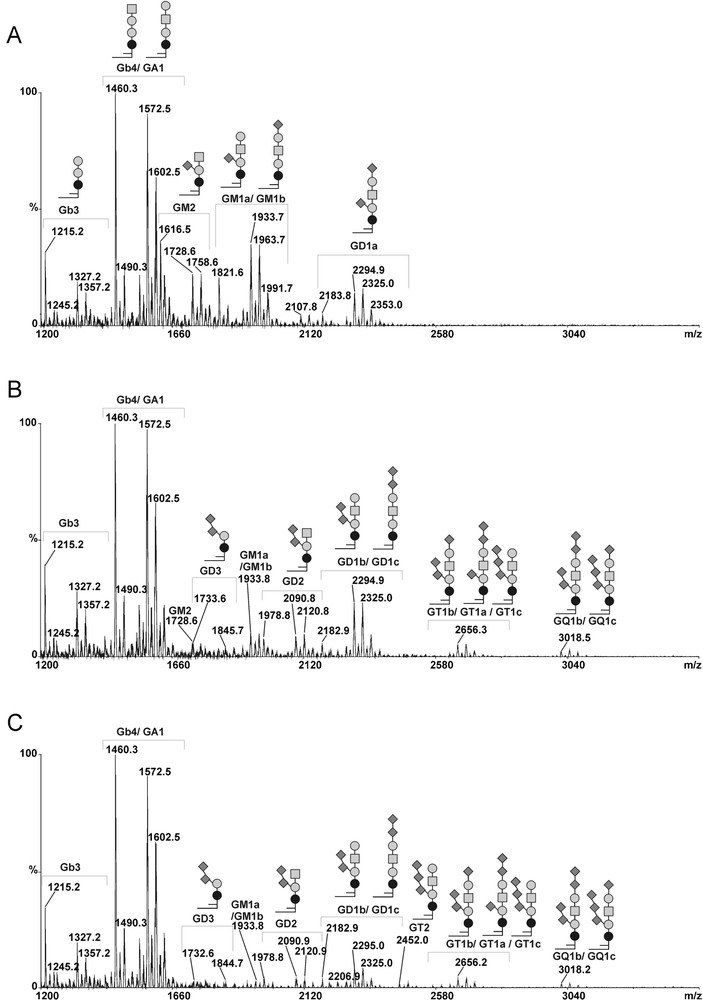
MALDI-TOF-MS profiles of permethylated GSLs from control and GD3S+ MCF-7 cells. Mass Spectra of permethylated GSLs isolated from control MCF-7 transfected with empty vector (A), GD3S+ MCF-7 cells clone #1 (B) and clone #4 (C). Gangliosides from b- or c-series were not detected in control cells, whereas complex gangliosides containing 2 to 4 sialic acids residues (i.e. GD3, GD2, GD1b, GT2, GD3, GT1b/c, GQ1b/c) were detected in GD3S+ MCF-7 cells. Glcp; Galp; GalpNAc; Neup5Ac; Ceramide.
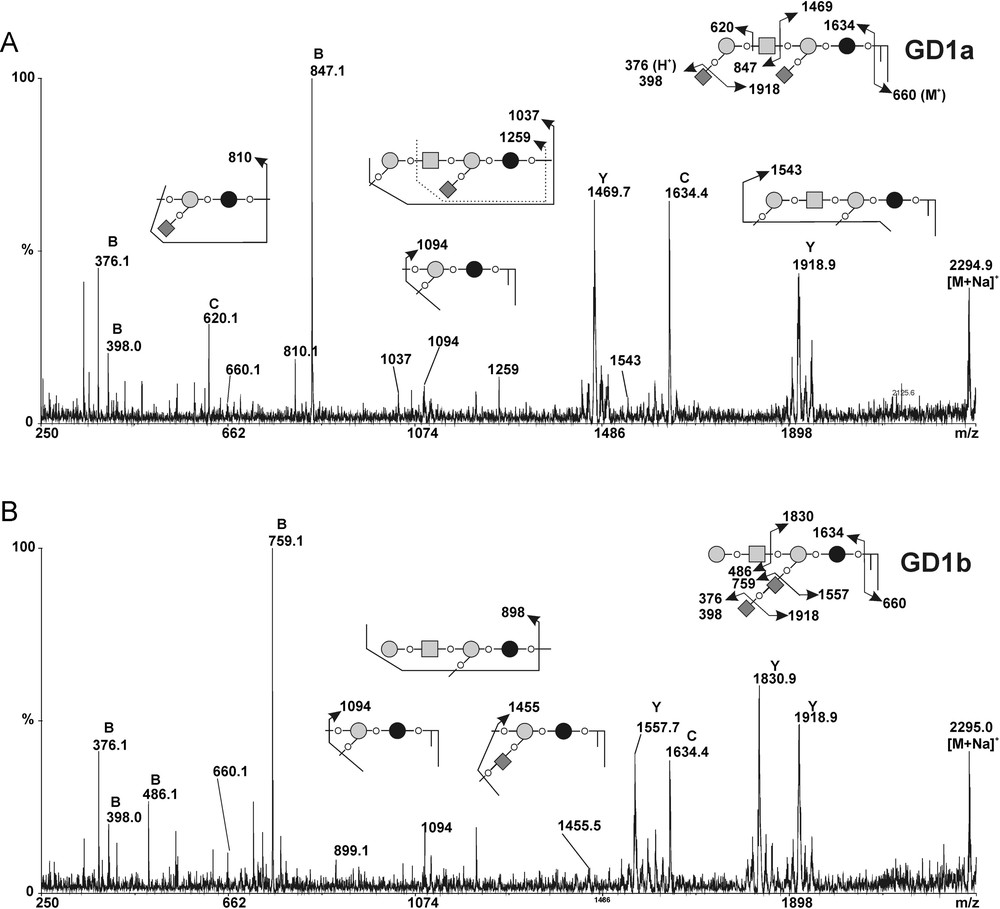
MALDI-MS/MS sequencing of the permethylated gangliosides from control and GD3S+ MCF-7 cells. MALDI-MS/MS spectra of the [M + Na]+ molecular ion m/z 2495 corresponding to permethylated GD1 gangliosides in MCF-7 transfected with empty vector (A) and GD3S+ MCF-7 clone #1 (B). Fragment ions were annotated according to nomenclature of Domon and Costello [31]. All molecules are detected as [M + Na]+ ions with the exception of those into brackets {}. The fragmentation profiles of permethylated GD1 ganglioside typifies GD1a in control MCF-7 cells and GD1b in GD3S+ MCF-7 clones. The C/Z couple fragment ions at m/z 1634 [M + Na]+ and 660 [M + H]+ typify the ceramide moiety as sphingosine C18:1 substituted by lignoceric acid C24:0. Glcp; Galp; GalpNAc; Neup5Ac; Ceramide.
As expected, the gangliosides profiles of MCF-7 GD3S+ clones established by MALDI-MS significantly differed from those of the wild-type (data not shown) and empty vector-transfected MCF-7 (control) cells (Fig. 4). Indeed, whereas MCF-7 cells expressed simple a-series gangliosides including GM2, GM1a and GD1a, GD3S+ clones accumulated di-, tri- and tetra-sialylated gangliosides of higher complexity including GD3, GD2, GD1, GT2, GT1 and GQ1. In parallel, monosialylated gangliosides totally disappeared in MCF-7 GD3S+ cells compared to control cells. Then, MS/MS fragmentation analysis of individual compounds in MCF-7 GD3S+ cells established that all GSLs are b- and c-series, which permitted to precisely identify GD1b, GT1b/c and GQ1b/c. In particular, comparison of the fragmentation patterns of GD1 signals from control MCF-7 cells and GD3S+ clones revealed that GD1 isolated from GD3S+ cells exclusively contained the b-series isomer whereas control MCF-7 cells only contained the a-series isomer (Fig. 5B). The presence of the di-sialylated motif on the lactose moiety typifying b-series was unambiguously established by the presence of Y/B couple cleavage ions at m/z 1830/486 and B ion at m/z 759.
3.3 Growth and migration of GD3S+ MCF-7 cells
Cell growth was determined by MTS assay in culture media containing decreasing concentrations of FBS. As shown in Fig. 6A, no difference in cell growth was observed between control and GD3S+ cells. Similar result was obtained with wild-type MCF-7 cells (data not shown). In all cases, cell proliferation decreased with serum concentration. Similar result was obtained by direct cell counting experiments (data not shown). Interestingly, cell migration assay using Transwell Boyden chambers showed that GD3S expression induced twice as much cell migration to the bottom chamber compared to control cells (Fig. 6B).

Analysis of the effect of GD3S expression on MCF-7 cell proliferation and migration. A: Proliferation assays were performed by MTS in 96-wells plates and cells were grown in DMEM supplemented with 5, 1 or 0.5% FBS. Cells were counted after 24, 48, 72, 96 and 120 h. Each measure was performed in 16 wells and data are mean of four independent manipulations. : control cells; : clone #1; : clone #4. B: Transwell cell migration analysis. Cells were counted after 24 h of culture in DMEM medium supplemented with 1% FBS. ** p < 0.02.
3.4 Immunodetection of c-Met and phospho-c-Met in MCF-7 GD3S+ clones
The expression and phosphorylation of c-Met were analyzed in control and MCF-7 GD3S+ clones by Western blotting and immunodetection using anti-c-Met and anti–phospho-c-Met antibodies directed against phosphorylated tyrosine residues 1234 and 1235 of the receptor. As shown in Fig. 7, c-Met was detected at the same expression level in both control and GD3S+ clones (Fig. 7). Phosphorylation of c-Met was revealed neither in control nor in untreated GD3S+ clones, while HGF/SF induced efficient Met phosphorylation in MCF7 cells (Fig. 7).
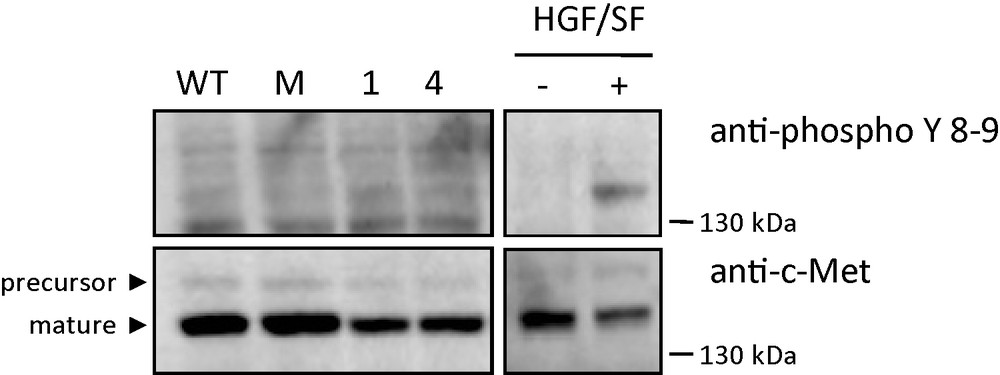
Western blot analysis using specific c-Met and phospho-c-Met antibodies. Untransfected MCF-7 (WT), control MCF-7 transfected with empty vector, GD3S+ MCF-7 cells clone #1 and clone #4 were cultured in serum free condition. Untransfected MCF-7 (WT) were treated or not 15 min with 30 ng/ml HGF/SF. Cell lysates were analyzed by Western blotting with antibodies directed against human c-Met and the phosphorylated tyrosine residues of the c-Met kinase domain. The positions of molecular weight markers are indicated. Arrowheads indicate the positions of precursor and mature c-Met.
4 Discussion
Recent evidences have proposed that GD3S could be associated with breast cancer development and aggressiveness. Clinical studies using breast tumors microarray datasets have shown that the GD3S gene (ST8SIA1) displayed higher expression among ER negative tumors [12]. ST8SIA1 expression is associated with poor histopathological grading and tumor size in ER negative tumors [12,13]. We have also recently showed that ST8SIA1 expression is significantly higher in the basal-subtype [24] breast cancer tumors [15], indicating that GD3S could be over-expressed in aggressive breast cancer tumors. However, in comparison with tumors, breast cancer cells do not express complex gangliosides from b- and c-series in culture conditions [14]. To analyze the effect of GD3S expression in breast cancer, we have established and characterized cellular models deriving from two breast cancer cell lines: the triple negative (ER-, PR- and Her2-) basal-subtype MDA-MB-231 and the luminal-A subtype ER+ MCF-7 breast cancer cells, that both express GD3S. We have shown that MDA-MB-231 GD3S+ clones exhibit a proliferative phenotype in absence of serum or growth factors, and an increased tumor growth in severe immunodeficiency mice. This phenotype results from the constitutive activation of c-Met receptor and subsequent activation of MEK/ERK and PI3 K/Akt pathways [15]. Here, we reported the phenotype of MCF-7 GD3S+ clones.
MALDI-TOF analysis has confirmed that wild-type MCF-7 and MDA-MB-231 have different GSL composition. GSL composition of MDA-MB-231 and MCF-7 cell lines was previously examined [25], showing that there is twice as much neutral GSL in MCF-7 as in MDA-MB-231 cells and that ganglioside content is four-fold higher in MDA-MB-231 cells compared to MCF-7 cells. Our data confirm that MCF-7 express large amount of globosides such as Gb3 and Gb4 and lower amount of gangliosides compared to MDA-MB-231 [14]. This difference in GSL composition may be explained by the lowest expression of the GM3 synthase (ST3 Gal V) in MCF-7, the enzyme that regulates the first step of gangliosides biosynthesis [14]. Similarly to MDA-MB-231 cells, wild-type MCF-7 cells only express a-series gangliosides, but mainly accumulate GM1a instead of GM2 in MDA-MB-231, probably due to the 5-fold higher expression of the β3 Gal T4 in MCF-7 cells (data not shown). In MCF-7 clones, GD3S expression resulted in the conversion of a-series in b- and c-series gangliosides absent from control cells, GD1b being the main compound instead of GD2 in MDA-MB-231 GD3S+ clones (unpublished data). These data are in good agreement with ganglioside profiles of wild-type MCF-7 and with the expression of related enzymes, GD2 being efficiently converted in GD1b by the β3 Gal T4 in MCF-7 cells. It is noteworthy that GD3S+ clones also express c-series gangliosides whereas the GT3 synthase ST8Sia V is weakly expressed in both MDA-MB-231 and MCF-7 cells. This may be due to the GT3 synthase activity of GD3S that also uses GD3 as acceptor substrate to synthesize GT3 [26].
As previously shown, GD3S expression in MDA-MB-231 induces a proliferative phenotype in serum-free conditions, resulting from the constitutive activation of c-Met receptor and subsequent activation of MEK/ERK and PI3 K/Akt transduction pathways [15]. Moreover, the silencing of the GM2/GD2 synthase (β4GalNAc T1) reverses the proliferative phenotype and c-Met phosphorylation, underlying the role of GD2 in c-Met activation. It is commonly known that ganglioside expression can have important effects on RTKs-mediated signaling and regulates cell growth through activation or inhibition of intracellular transduction pathways [27]. For example, EGFR tyrosine kinase activity is inhibited by GM3 through interactions of GM3 with terminal β-GlcpNAc of EGFR N-glycans [28]. However, no change in the proliferative capacity of GD3S+ MCF-7 clones was observed and no activation of c-Met was detected in these cells. The absence of phenotype of GD3S+ MCF-7 clones can be related to the expression of GD1b instead of GD2, and reinforces the role of GD2 in c-Met activation. In parallel, MCF-7 GD3S+ cells show an increased migration as observed for MDA-MB-231 clones. This seems to indicate that proliferation and migration are activated by different mechanisms in GD3S+ cells.
In conclusion, the present data together with our previous results show that the expression of GD3S in breast cancer cells results in different ganglioside profiles and phenotypes according to the cell type and the cell-dependent expression of other glycosyltransferases involved in ganglioside biosynthesis (i.e. ST3 Gal V, β4GalNAc T1, and β3 Gal T4). Recently, it has been shown that breast cancer cell gangliosides can serve as functional E-selectin ligands and be involved in cell adhesion to vascular endothelium, favoring metastasis [29]. Moreover, the expression of ST6GalNAc V, a sialyltransferase catalyzing α-ganglioside biosynthesis, has been associated to brain metastasis of breast cancer. Normally restricted to the brain, the expression of ST6GalNAc V in breast cancer cells enhances their adhesion to brain endothelial cells and their passage through the blood-brain barrier [30]. We have also previously shown that ST8SIA1 expression is significantly higher in the basal-subtype breast cancer tumors and that GD2 expression induces a growth factor independent proliferative phenotype via the constitutive activation of c-Met [15]. Nevertheless, ST8SIA1 alone is not sufficient to induce GD2 accumulation and c-Met activation, as low expression of β3 Gal T4 is also required. Altogether, these data indicate that the fine analysis of ganglioside glycosyltransferase genes expression should give new insights on proliferation capacity and tissue-specific metastasis targeting of basal-subtype breast cancer tumors.
Acknowledgments
We thank Pr. Jacques Portoukalian (Depart. of Transplantation and Clinical Immunology, Claude Bernard University and Edouard Herriot Hospital, Lyon, France) and Pr. Ronald L. Schnaar (Depart. of Pharmacology and Neuroscience, The Johns Hopkins University School of Medicine, Baltimore, USA) for the kind gift of anti-GT3 and anti-GD1b mAbs, respectively. We also thank Pr. C.H. Kim (Molecular and Cellular Glycobiology Unit, Depart. of Biological Science, Sung Kyun Kwan University, Suwon, Korea) for providing the pcDNA3-GD3S expression vector. This work was supported by the University of Sciences and Technologies of Lille, the Association pour la Recherche sur le Cancer (P. Delannoy grant no. 7936 and 5023, D. Tulasne grant no. 1137), La Ligue Régionale contre le Cancer and the ANR-Young Investigator Program (D. Tulasne).