

1 Introduction
Steroids have been the focus of important research throughout the scientific history. But the recent past has seen an exhaustive interest of research being diverted towards these biologically important molecules. It is probably because of the various advantages associated with steroid-based chemotherapeutics, as these compounds turn out to be non-toxic, less vulnerable to multidrug resistance and highly bioavailable because they are capable of penetrating the cell wall [1]. Although various modifications of steroids, including derivatization, cyclization, heterocyclization, etc., have been tried, as far as the literature precedents are concerned, little efforts have been made towards the efficient synthesis of steroidal based pyrimidines derivatives and simultaneous studies of in vitro DNA binding or of nuclease.
Pyrimidine moiety containing molecules have been shown to exhibit a broad spectrum of biological activities like anticancer [2,3], antiviral [4], antibacterial [5], antioxidant [6,7], anxiolytic [8], antidepressant [9], anti-inflammatory [10] and analgesic [11,12] ones. Recently, pyrimidine derivatives have also been used as histamine and adenosine receptor antagonists together with other biological receptors and modulators [13,14].
In the field of molecular biology and drug development, the cleaving agents of nucleic acid have attracted extensive attention due to their potential applications [15]. Under uncatalyzed physiological conditions, the phosphodiester bonds of DNA are extremely stable and the half-life of DNA for hydrolysis is estimated to be around 200 million years [16]. Metal complexes have been widely investigated as cleaving agents of nucleic acids and are found to be reasonably efficient [17], but their use in pharmacy is restricted because of serious issues over the lability and toxicity produced due to free radical generation of some transition metals during the redox processes [18]. To overcome these limitations of lability and toxicity, Gobel et al. [19] put forward the concept of ‘metal-free cleaving agents’, which are being applied to active phosphodiesters like ‘nucleic acid mimic’ and RNA.
In continuation of our previous work [20], we report herein the synthesis of new steroidal pyrimidines as metal-free DNA binding agents. The presence of –NH and –CO groups in the molecules can cooperatively participate in the interaction with DNA via hydrogen bonding. A computer-aided molecular docking study was carried out to validate the specific binding mode of the newly synthesized compounds. Furthermore, these compounds have also been screened for in vitro cytotoxicity. It is indeed gratifying to note that these compounds show significantly potential cytotoxic behaviour against the human cancer cells selected for this study.
2 Results and discussion
2.1 Chemistry
Development of highly functional molecules from simple building blocks has always attracted the curiosity of synthetic chemists. So we herein report a convenient route for the synthesis of new [6′-amino-2′-thioxo-4′-oxo dihydro-1H-pyrimidin-1-yl] 6-imino-5α-cholestane derivatives (7–9) by the reaction of 5α-cholestan-6-one thiosemicarbazones (4–6) with ethyl cyanoacetate in 1,4-dioxane for about 11–15 h under reflux conditions; on the completion of the reaction, the products were obtained in better yields (70–80%). The mechanism for the formation of compounds 7–9 involves the nucleophilic attack of the thiosemicarbazone's nitrogen on the carbonyl carbon of ethyl cyanoacetate, making the ethoxy group to leave, with a simultaneous attack of another thiosemicarbazone nitrogen on the cyano group of ethyl cyanoacetate, converting it to CNH2, which leads to the formation of a pyrimidine heterocyclic moiety with a steroid skeleton.
The characterization studies are in good agreement with the proposed structures for steroidal pyrimidines 7–9 shown in Scheme 1. In the IR spectra, the absorption bands in the ranges 3345–3353 and 3284–3290 cm−1 were attributed to the NH, NH2 groups, respectively, while a strong absorption band at 1669–1671 cm−1 confirmed the presence of the CONH group in compounds 7–9. In our 1H NMR study, the two singlets in the range δ 8.2–7.6 and 2.9–3.2 confirmed the presence of NH and NH2, respectively, while the singlet at δ 5.7–5.5 depicted the presence of an olefinic proton in compounds 7–9. In our 13C NMR study, the signals at δ 183–185, 167–168, 154–155, 81–85.8 confirmed the presence of the CS, CO, CN, CC groups, respectively, in compounds 7–9. Finally, the presence of distinct molecular ion peaks [M+•] at m/z 584, 560/562 and 526 in the MS spectra also proved the formation of the compounds 7–9. This strategy can also be applied to diverse thiosemicarbazones; in that way pyrimidines may also allow further modifications on the substituted heterocyclic systems.
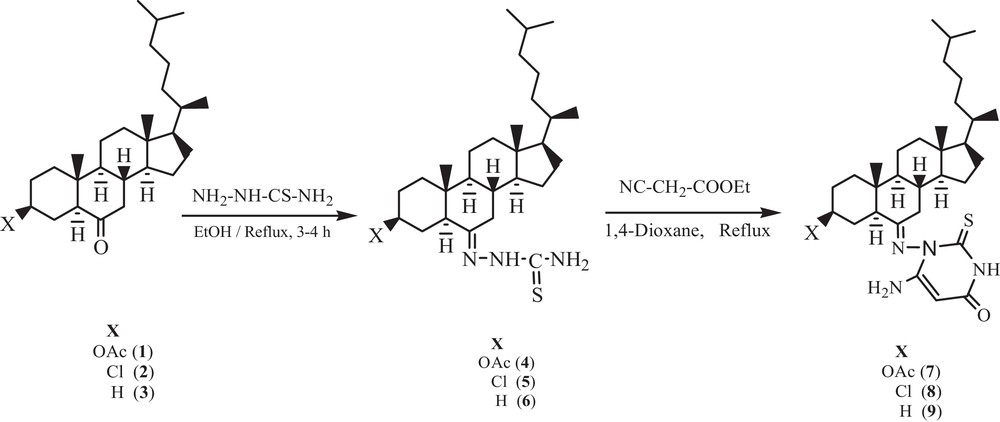
Pathway for the formation of steroidal pyrimidines 7–9.
2.2 DNA binding studies
2.2.1 Electronic absorption titration
Electronic absorption spectroscopy is one of the most useful techniques for the investigation of the interaction mode of compounds with DNA. The UV–vis spectra of compounds 7–9 exhibited intense absorption bands at 290 nm, attributed to the π→π* or intraligand transitions, as shown in Fig. 1. This intense ligand (π→π*) absorption band is used to monitor the interaction of the compounds with calf thymus DNA. Upon the addition of an increasing concentration of DNA (0.70–4.24 × 10⁻⁵ M) to the test compounds in a 2% DMSO/5 mM Tris HCl/50 mM NaCl buffer solution, there was an increase in the absorption intensity of the intraligand absorption band (hyperchromism), without any shift of the position of the band. Hyperchromicity and hypochromicity are the spectral features of DNA concerning its double helical structure. The hyperchromic effect reflects the corresponding changes of DNA in its conformation and structure and results from a structural damage brought to the secondary structure of the DNA double helix [21]. These spectral characteristics suggested that our compounds exhibited higher binding propensity with DNA and interact presumably by electrostatic interaction via the phosphate backbone of the DNA double helix together with the hydrophobic interaction, since the bulky nature of the compounds is expected to hinder the intercalative mode of binding. The hydrophobic interaction with DNA replaces the water molecules in the DNA grooves, leading to an enhancement of the entropy and to the stabilization of the DNA-bound compound [22].
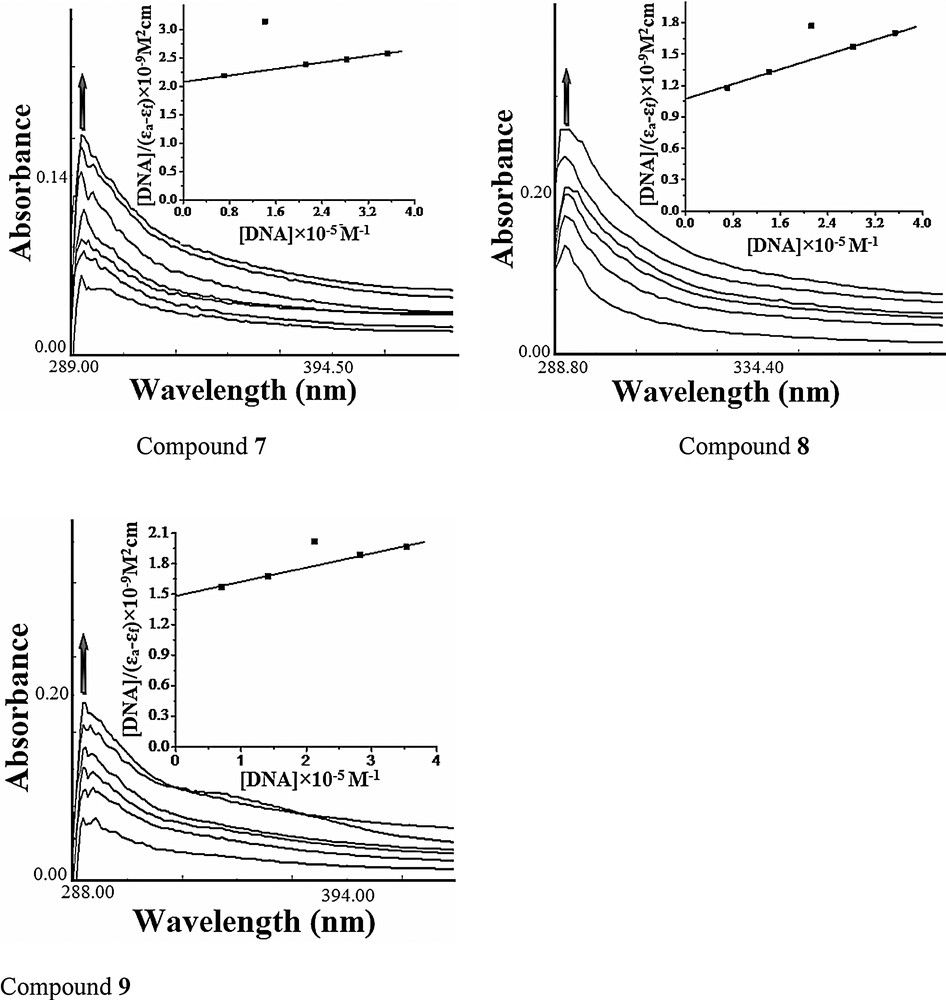
Absorption spectra of compounds 7–9 in Tris-HCl buffer upon addition of DNA. [Compound] = 6.67 × 10⁻⁶ M, [DNA] = (0.70–4.24) × 10−5 M. The arrow shows the change in intensity with increasing DNA concentration. Inset: plots of [DNA]/(ɛa–ɛf) versus [DNA] for the titration of DNA with the compound.
In order to further compare the binding strength of the compounds, their intrinsic binding constants (Kb) were determined from the following equation (1) [23].
| (1) |
The intrinsic binding constants for compounds 7–9 were found to be 6.56 × 10³ M−1, 1.54 × 10⁴ M−1 and 9.34 × 10³ M−1 respectively. The obtained results revealed that compound 8 binds more strongly with CT DNA as compared to the remaining compounds and that the binding affinity follows the order 8 > 9 > 7.
2.2.2 Fluorescence spectroscopy
The emission spectra of compounds 7–9 displayed an intense luminescence at 358 nm at room temperature in the absence of DNA when excited at 290 nm. On addition of increasing concentrations of DNA (0.70 × 10⁻⁵ to 4.24 × 10⁻⁵ M) to the fixed amount of compounds (1 × 10⁻⁴ M), the emission intensity appreciably increases, as shown in Fig. 2. The enhancement in the emission intensity is largely due to an environmental change around the compounds and is related to the extent to which the molecule is inserted into the hydrophobic environment of DNA minor and major grooves. Since DNA is a hydrophobic molecule, it reduces the accessibility of solvent molecules to the hydrophobic environment inside the DNA helix, and the mobility of the compound is restricted at the binding site, ultimately leading to a decrease in the vibrational mode of relaxation [21]. Furthermore, the binding of the compound to the DNA helix could decrease the frequency of the collisions between the solvent's molecules and the compound, leading to an enhancement of the emission of the compound. These results revealed that interaction between CT DNA and the compound occurs due to the hydrophobicity of both molecules.
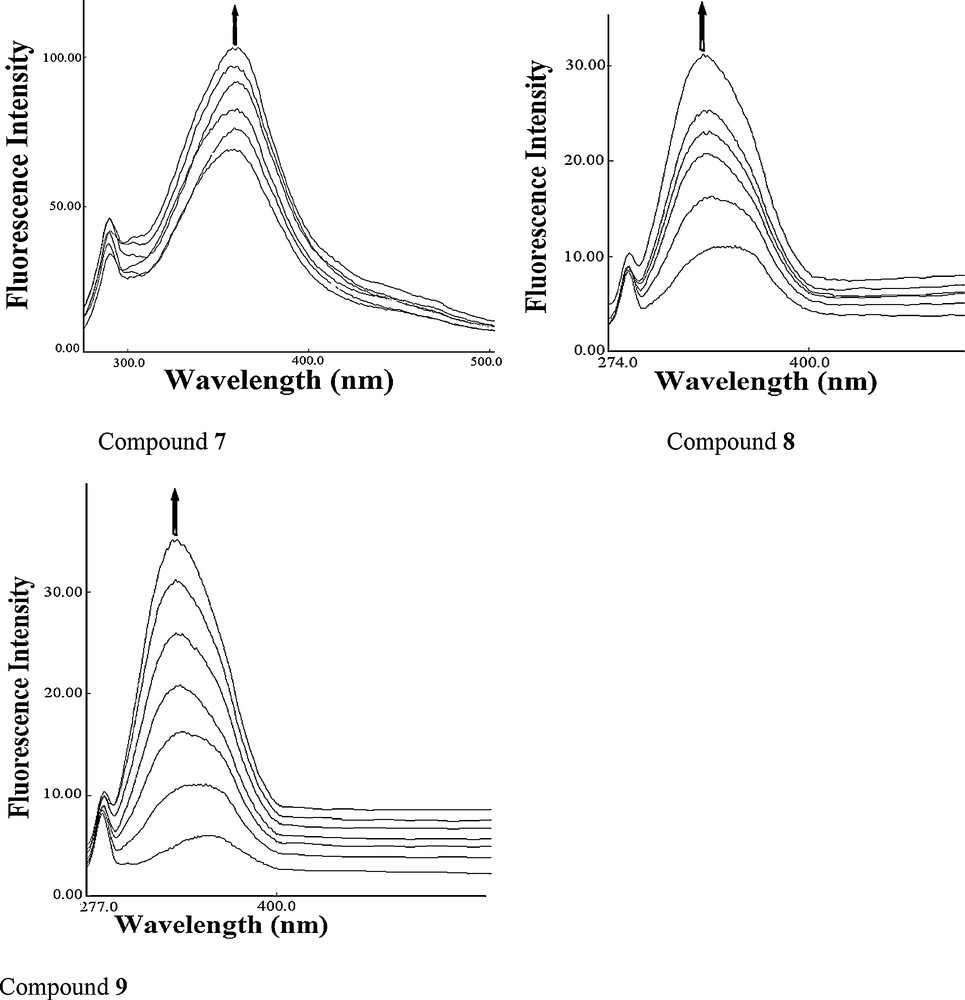
Emission spectra of compounds 7–9 in Tris-HCl buffer (pH 7.2) in the presence and absence of DNA at room temperature. The arrow shows changes in intensity with increasing DNA concentration.
To compare quantitatively the binding affinity of compounds to DNA, the binding constant K and binding sites’ number n were calculated by using Scatchard's equations (2) and (3) [24,25]:
| (2) |
| (3) |
The binding constants for compounds 7–9 were calculated to be 3.5 × 10³ M−1, 1.1 × 10⁴ M−1 and 4.6 × 10³ M−1, respectively. The number of binding sites n for compounds 7–9 was found to be 1.28, 1.46 and 1.34, respectively, indicating that compound 8 has a higher DNA binding propensity, which is in agreement with the electronic absorption titration experiment.
2.2.3 Nuclease activity
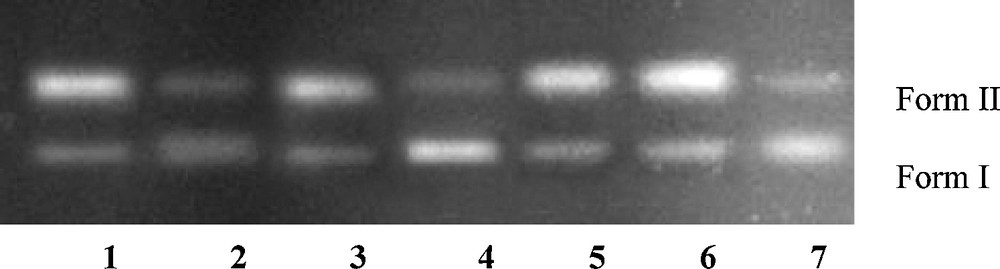
The DNA cleavage was controlled by the relaxation of supercoiled circular form of pBR322 DNA into the nicked and linear forms. When a circular plasmid DNA is subjected to agarose gel electrophoresis, the fastest migration will be observed for the supercoiled form (form I). If one strand is cleaved, the supercoils will relax to produce a slower moving open circular form (form II). If both strands are cleaved, a linear form (form III) will be generated, which migrates in between forms I and II. The DNA cleaving ability of compound 8 was investigated using pBR322 DNA. In the absence of any external additive, compound 8 cleaved double-stranded supercoiled plasmid DNA (SC form: form I) (300 ng) in 5 mM Tris–HCl/50 mM NaCl buffer into the nicked circular form (NC form: form II) after 1 h of incubation at physiological pH 7.2 and temperature 25 °C [26,27]. Keeping the DNA concentration constant (300 ng), the concentration of compound 8 was varied (1.0–5.0 μM), and the cleavage reaction was further monitored by gel electrophoresis. The results revealed a concentration-dependent electrophoretic cleavage, clearly showing the conversion of SC form (form I) to NC form (form II) with an increase in the concentration of compound 8.
At a 3 μM concentration, compound 8 exhibited efficient nuclease activity. At still higher concentrations, there was complete conversion of the SC form into the NC form, with the concurrent formation of the LC form. Presence of forms I, II, and III of pBR322 DNA indicated that compound 8 is involved in double-strand DNA cleavage (Fig. 3).
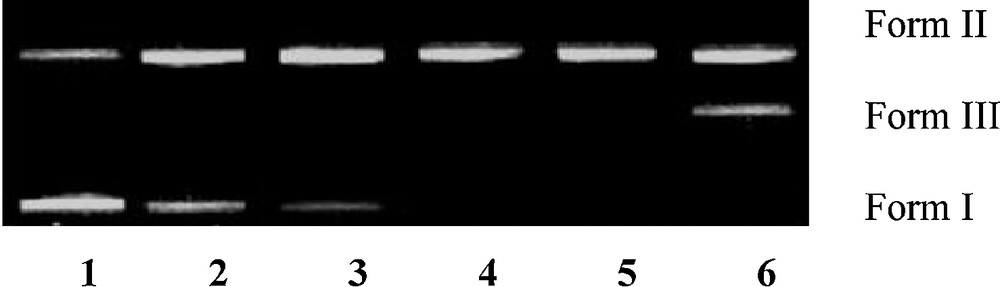
Agarose gel electrophoresis patterns of pBR322 plasmid DNA (300 ng) cleaved by compound 8 (1.0–5.0 μM), after 1 h of incubation (concentration dependent). Lane 1: control; lane 2: 1.0 μM 8 + DNA; lane 3: 2.0 μM 8 + DNA; lane 4: 3.0 μM 8 + DNA; lane 5: 4.0 μM 8 + DNA; lane 6: 5.0 μM 8 + DNA, in buffer (5 mM Tris-HCl/50 mM NaCl, pH 7.2 at 25 °C).
The nuclease activity in the presence of activators, viz. MPA, GSH, and H2O2, was also observed, and the results showed a significant enhancement in the cleavage activity. Their activating efficacy follows the order: GSH = H2O2 > MPA. To predict the mechanism of pBR322 plasmid DNA cleavage by compound 8, comparative experiments were carried out in the presence of various radical inhibitors or trappers, such as singlet oxygen scavenger sodium azide (NaN3), hydroxyl radical scavengers, viz. dimethylsulfoxide (DMSO), t-butyl alcohol (TBA), and superoxide dismutase (SOD) as superoxide anion inhibitor (Fig. 4). When the hydroxyl radical scavengers DMSO and TBA were added to the reaction mixture, the nuclease activity was not inhibited, excluding the role of the hydroxyl radical in the cleavage process. In the presence of radical scavengers like NaN3 and SOD, the cleavage was significantly inhibited under the present experimental conditions. Therefore, compound 8 seems to follow the mechanistic pathway involving the singlet oxygen and the superoxide anion to generate ROS, responsible for initiating DNA strand scission [16b].
Agarose gel electrophoresis pattern for the cleavage of pBR322 supercoiled DNA (300 ng) by compound 8 (2.0 μM) in the presence of different activating agents and radical scavengers. Lane 1: 8 + GSH + DNA; lane 2: 8 + MPA + DNA; lane 3: 8 + H2O2 + DNA; lane 4: 8 + NaN3 + DNA; lane 5: 8 + DMSO + DNA; lane 6: 8 + t-butyl alcohol + DNA; lane 7: 8 + SOD + DNA in buffer (5 mM Tris–HCl/50 mM NaCl, pH 7.2 at 25 °C).
2.2.4 Molecular docking
To understand steroidal pyrimidine–DNA interaction, the molecular docking technique is an attractive tool to get an insight into the mechanistic study, by placing a molecule into the binding site of the target specific region of the DNA. In our experiment, rigid molecular docking (two interacting molecules were treated as rigid bodies) studies were performed to predict the binding modes of compounds with a DNA duplex of sequence d(CGCAAATTTCGC)2 dodecamer (PDB ID: 1BNA), and provided energetically favourable docked structures (DNA–compounds 7–9 complexes shown in Fig. 5). Compound 7 is making one hydrogen bond with a binding energy of –275.27 kcal, compound 8 is making three hydrogen bonds with a binding energy of –266.90 kcal, while compound 9 is making one hydrogen bond with a binding energy of –266.22 kcal. The docking score of the compounds 7–9 are –5.9, –6.2 and –6.0, respectively, revealing the better docking for compound 8, with DNA among the three compounds. It is evident from the figure that these types of compounds get attached with DNA through electrostatic as well as hydrophobic interactions. The steroid moiety due to these stereochemical reasons remains far from the nucleotide base pairs, and hence it is the pyrimidine moiety with groups like –NH, –CO and –NH2 that shows an intercalation between the nucleotide base pairs of DNA through hydrogen bonding. Thus binding energy and docking score values are consistent with the high-binding constant obtained from spectroscopic values.
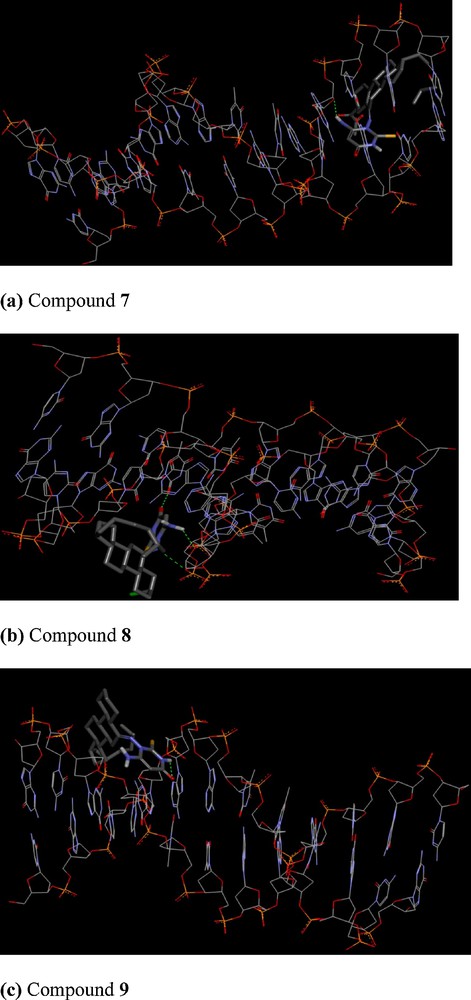
Cartoon representation of DNA with compounds 7–9, respectively, The N-, S- and O termini of the pyrimidine moiety of the compounds are shown as blue, yellow and red sticks, respectively. Fig. 5 (a–c) shows minimum energy poses of DNA-steroidal pyrimidines 7–9.
Thus, we can conclude that there is a mutual complement between spectroscopic techniques and molecular modelling, which can provide valuable information about the mode of interaction of the compounds with DNA and the conformation constraints for adduct formation.
2.3 In vitro cytotoxicity
The anticancer activity in vitro was measured using the MTT assay, during which the conversion of the soluble yellowish MTT to the insoluble purple formazan by active mitochondrial lactate dehydrogenase of living cells has been used to develop an assay system for cell proliferation measurement [28,29]. The data reported in Table 1 suggests that compounds 1–9 showed different levels of cytotoxicity, and it was found that starting ketones 1–3 were almost inactive against given cancer cells, as they depicted much higher IC50 values (≥ 50 μM L−1). Compounds 4–6 were found more active than compounds 1–3, as they showed lower inhibition count values, which reflects the fact they are more effective than the starting compounds 1–3, which is probably due to the incorporation of the thiosemicarbazide moiety, as most of the heterocyclic compounds adjoining the thiosemicarbazide moiety have been found potentially active against different cancer cells [30]. During the cytotoxic screening of steroidal pyrimidines 7–9, their potential behaviour against given cancer cells was depicted: compound 7 showed IC50 = 9.63 μmol L−1 (HT–29), 9.73 μmol L−1 (MCF–7), 11.45 μmol L−1 (A549). Compounds 8 also showed minimum IC50 value in the range of 12.79 μmol L−1 (HT-29) and 10.60 μmol L−1 (MCF-7), while compound 9 showed minimum IC50 = 9.11 μmol L−1 (A545) and 11.26 μmol L−1 (HepG2) cell lines. Cytotoxicity screening data also suggested that the appending of the pyrimidine scaffold to the steroid nucleus may be one of the factors responsible for the compounds’ cytotoxicity.
The IC50 values of compounds 1–9 against given cancer cell lines.
| IC50 (μM L−1) | ||||||||
| Compound | Lung | Breast | Cervical | Leukaemia | Colon | Hepatic | Colon | Lung |
| A545 | MCF-7 | HeLa | HL-60 | SW480 | HepG2 | HT-29 | A549 | |
| 1 | 43.31 | 39.15 | > 50 | 40.36 | 39.77 | > 50 | > 50 | 46.13 |
| 2 | > 50 | 40.37 | > 50 | > 50 | > 50 | 49.22 | > 50 | > 50 |
| 3 | 43.11 | 47.39 | > 50 | > 50 | 47.28 | > 50 | > 50 | 40.61 |
| 4 | 29.46 | 22.17 | 37.77 | 45.29 | 19.26 | 34.12 | 26.73 | 33.18 |
| 5 | 26.28 | 17.62 | 39.25 | 43.21 | > 50 | 30.51 | 35.97 | 41.32 |
| 6 | 18.23 | 34.58 | 33.68 | > 50 | 33.52 | 26.72 | 38.23 | 29.66 |
| 7 | 13.45 | 9.73 | 11.72 | 20.17 | 12.81 | 11.78 | 9.63 | 11.45 |
| 8 | 16.53 | 10.60 | 17.37 | 28.34 | >50 | 24.37 | 12.79 | 20.64 |
| 9 | 9.11 | 27.39 | 15.13 | > 50 | 26.11 | 11.26 | 17.12 | 16.31 |
| Cisplatin | 8.9 | 9.3 | 9.43 | 7.83 | 3.52 | 9.80 | 7.24 | 12.0 |
| 5-FU | 15.4 | 15.3 | 16.32 | > 50 | 15.71 | > 50 | 9.79 | 12.8 |
From Table 1, it is clear that the IC50 value for compound 7 against A549 cell line, which was found to be 11.45, is very close to that of Cisplatin 12.0 against the same cell line [31]. IC50 for compound 7 against the HeLa cell line was found to be 11.72, which is also close to the IC50 of Cisplatin 9.43 against the same cell line [32]. Similarly, IC50 for compound 9 against HepG2 was found to be 11.26, which is also close to the IC50 of Cisplatin 9.8 against the same cell line [31]. It can be concluded that compounds 7 and 9 display better in vitro cytotoxicities against A549, HeLa, HepG2 and A545 cell lines by showing IC50 values close to that of Cisplatin; thus they can be considered as better cytotoxic agents. Compounds 7–9 also show a better cytotoxicity against HL-60 and HepG2 cell lines by showing IC50 values lower than that of the standard drug, 5–fluorouracil. Further modifications and derivatization may lead to the development of more active cytotoxic agents.
To confirm our cytotoxicity results, compounds 7–9 were tested with some known non-cancerous cell lines 184B5 (breast), MCF10A (breast), NL–20 (lung), HPC (pulp) and HPLF (periodontal); none of the synthesized compounds was found toxic, and all compounds exhibited GI50 > 60. This also suggests that steroid pyrimidines derivatives can be used specifically for the treatment of cancerous cells without showing any toxicity against normal cells. The GI50 values shown by compounds 7–9 and Cisplatin are given in Table 2.
The GI50 values shown by compounds (7-9), cisplatin and 5-flororuracil (5-FU) against non-cancerous cells.
| GI50 (μM) | |||||
| Breast | Breast | Lung | Pulp | Periodontal | |
| Compounds | 184B5 | MCF10A | NL-20 | HPC | HPLF |
| 7 | 66.13 | 92.19 | 85.13 | > 100 | 83.25 |
| 8 | 71.25 | > 100 | 66.15 | 73.21 | > 100 |
| 9 | > 100 | 63.62 | 97.13 | 64.26 | 71.13 |
| Cisplatin | 26.17 | 51.25 | 63.35 | 61.17 | 73.95 |
| 5-FU | > 100 | 83.54 | 73.62 | > 100 | 96.51 |
2.4 Comet assay
In the comet assay, the images of cells treated with compounds 7–9 showed the formation of comets. No comet pattern was observed in the control cells. There was a dose-dependent increase in tail length when treated with compound 7 (Fig. 6). Compound 7 presented maximum apoptotic DNA damage among the three steroidal pyrimidines studied, which is in accordance with its maximum cytotoxicity, as seen in MTT assay. The quantified increase in DNA damage suggested that the pyrimidine derivative 7 induced a dose-dependent fragmentation of chromosomal DNA, leading to apoptosis. The images of comet assay for control, cells treated with 7 (50 μg/mL), 8 (50 μg/mL), and 9 (50 μg/mL) are depicted in Fig. 6. The slides were analysed for parameters like tail length (TL) using image analyser CASP software version 1.2.2. The results of the tail-length assay are reported in Fig. 7.
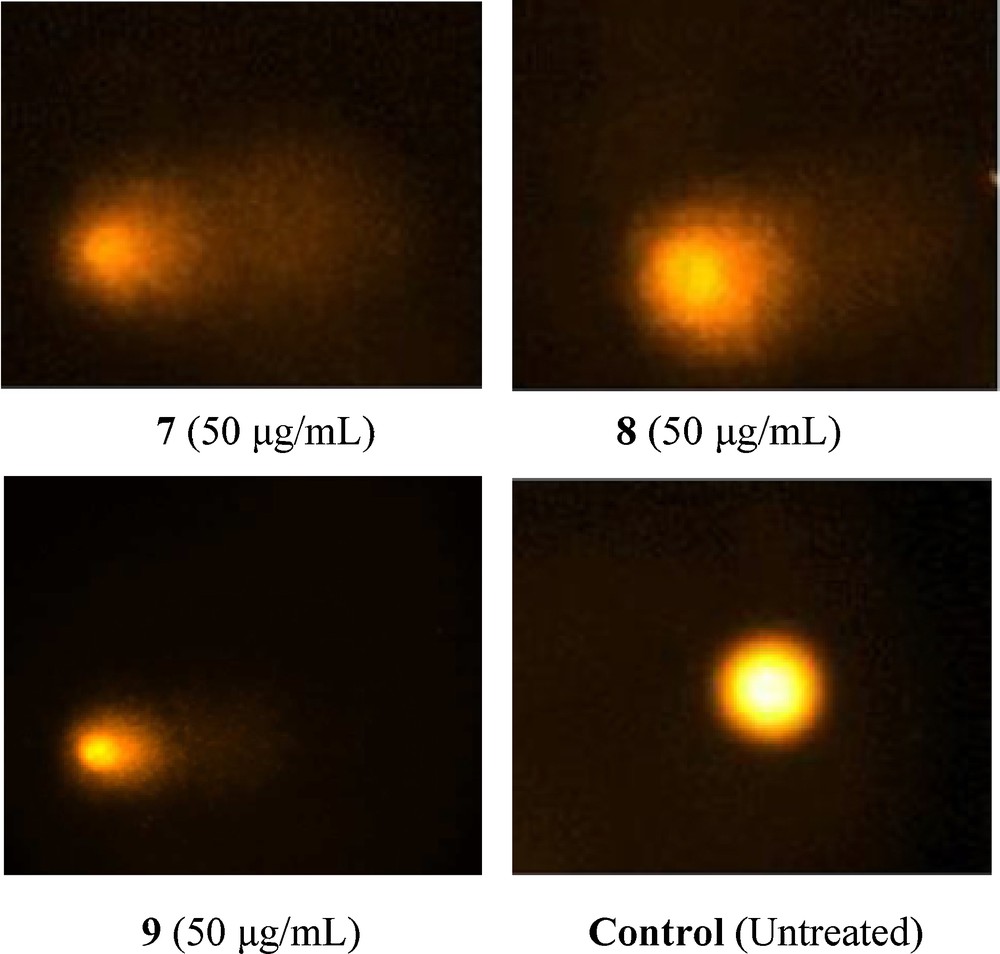
Detection of DNA damage in MCF-7 cells. Treated cells (24 h) were layered over agarose gel, lysed, electrophoresed in alkaline buffer and stained with propidium iodide. Control cells were treated with DMSO alone. DNA fragmentation results in the appearance of shapes resembling comets in cells treated with compounds 7–9.
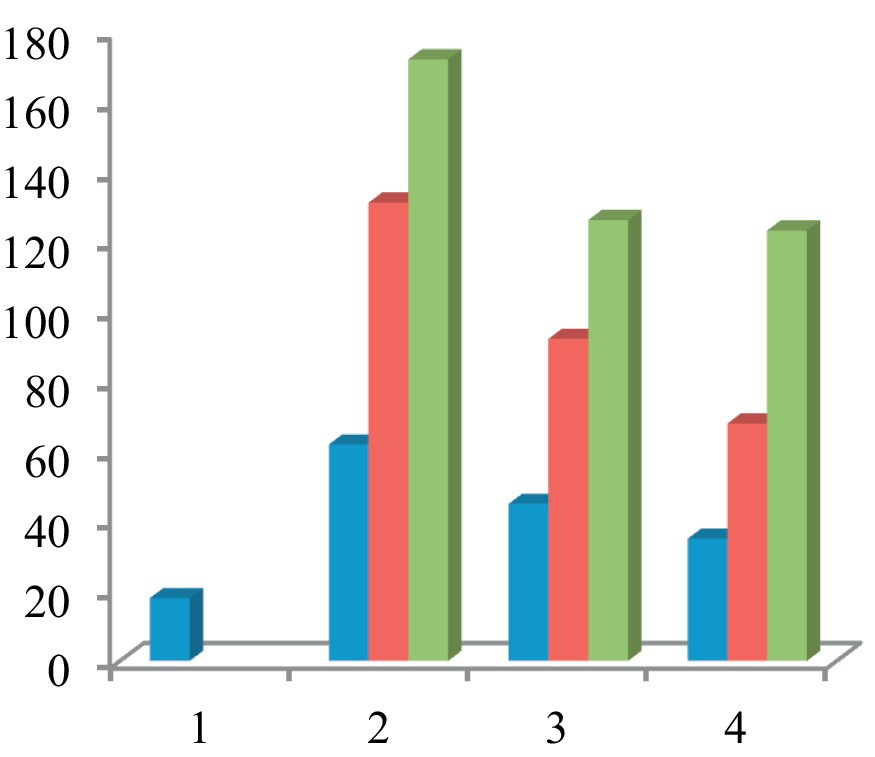
Graph comparing the effect of steroidal pyrimidines on the tail length in comet assay. There was a concentration-dependent increase in the apoptotic DNA fragmentation, and hence an increase in tail length in all three pyrimidine derivatives. Compound 7 caused maximum DNA damage in the comet assay. 1 = control (untreated); 2 = blue (10 μg/mL), red (25 μg/mL), green (50 μg/mL) 7, 3 = blue (10 μg/mL); red (25 μg/mL), green (50 μg/mL) 8; 4 = blue (10 μg/mL), red (25 μg/mL), green (50 μg/mL) 9.
3 Experimental
3.1 Instrumentation and materials
Synthesis-grade chemicals were purchased from Merck and Sigma-Aldrich and used without further purification. Melting points were recorded in degrees Celsius on a Kofler apparatus. IR spectra were recorded on KBr pellets with a Pye Unicam SP3-100 spectrophotometer and values are given in cm−1. 1H and 13C NMR spectra were run in CDCl3 on a JEOL Eclipse (400 MHz) instrument with TMS as internal standard and values are given in ppm (δ). Mass spectra were recorded on a Jeol SX 102/DA-6000 mass spectrometer. Thin-layer chromatography (TLC) plates were coated with silica gel G and exposed to iodine vapours to check the homogeneity as well as the progress of the reaction. Sodium sulphate (anhydrous) was used as a drying agent. Super-coiled pBR322 DNA was purchased from GeNei (India), while double-stranded calf thymus DNA, purchased from Sigma, was dissolved in a 0.1 M Tris buffer. The purity of DNA was verified by monitoring its absorbance ratio at 260 nm to that at 280 nm, which was in the range 1.8–1.9. DNA concentration was determined spectrophotometrically using ɛ260 = 6600 M−1 cm−1. The human cancer cell lines used for the test were A545, MCF-7, HeLa, HL-60, SW480, HepG2, HT-29, and A549, and were obtained from the National Cancer Institute (NCI), biological testing branch, Federick Research and Development Centre, USA.
3.2 General method for the synthesis of steroidal thiosemicarbazones (4–6)
The known steroidal thiosemicarbazones (4–6) were synthesized by a literature method [33] that involves the refluxing of an equimolar solution of steroidal ketones 1–3 and thiosemicarbazide in ethanol in the presence of a few drops of HCl for 5 h. After cooling, the compounds were filtered out and recrystallized from methanol.
3.3 General method for the synthesis of steroidal pyrimidines (7–9)
To a solution of steroidal thiosemicarbazone 4–6 (1.5 mmol) in 1,4-dioxane (20 mL), an equimolar amount of ethyl cyanoacetate was added. The reaction mixture was refluxed for 11–15 h. The progress and completion of the reaction was monitored by TLC. After completion of the reaction, the excess solvent was removed to three fourths of the original volume under reduced pressure. The reaction mixture was then taken in diethyl ether, washed with water and dried over anhydrous sodium sulphate. Evaporation of solvents and recrystallization from methanol afforded the respective products 7–9.
3.3.1 3β–Acetoxy [6′–amino–2′–thioxo–4′–oxo dihydro–1H–pyrimidin–1–yl]6–imino–5α–cholestane (7)
Yellow powder; yield: 80%. m.p. 154–155 °C; Anal. Calcd for C33H52N4O3S: C, 67.69, H, 8.84, N, 9.49 found: C, 67.80, H, 8.90, N, 9.53; IR (KBr) ν cm−1: 3345, 3290 (NH, NH2), 1714 (OCOCH3), 1671 (CO), 1645 (CN), 1622 (CC), 1269 (CS), 1080 (C–O), 1025 (C–N); 1H NMR (400 MHz, CDCl3, ppm): δ 8.2 (s, 1H, NH, exchangeable with D2O), 5.7 (s, 1H, C5’H), 4.7 (m, 1H, C3 α–H, W½ = 15 Hz), 2.9 (s, 2H, NH2, exchangeable with D2O), 2.03 (s, 3H, OCOCH3), 1.18 (s, 3H, C10–CH3), 0.70 (s, 3H, C13–CH3), 0.97 and 0.83 (other methyl protons) 13C NMR (100 MHz, CDCl3, ppm): δ 185, 173.2, 171.6, 168.3, 155.3, 85.8, 70, 46, 44, 42, 39, 35, 26, 24, 22, 20, 17; ESI MS: m/z 584 [M+.].
3.3.2 3β–Chloro [6′–amino–2′–thioxo–4′–oxo dihydro–1H–pyrimidin–1–yl]6–imino–5α–cholestane (8)
White powder; yield: 75%, m.p. 138–139 °C; Anal. Calcd for C31H49ClN4OS: C, 66.34, H, 8.64, N, 9.87 found: C, 66.42, H, 8.75, N, 9.9; IR (KBr) ν cm−1: 3353, 3286 (NH, NH2), 1669 (CO), 1654 (CN), 1618 (CC), 1251 (CS), 1019 (C–N), 742 (C–Cl); 1H NMR (400 MHz, CDCl3, ppm): δ 7.6 (s, 1H, NH, exchangeable with D2O), 5.5 (s, 1H, C5′H), 3.9 (m, 1H, C3 α–H, W ½ = 17 Hz), 3.1 (s, 2H, NH2, exchangeable with D2O) 1.17 (s, 3H, C10–CH3), 0.72 (s, 3H, C13–CH3), 0.96 and 0.84 (other methyl protons) 13C NMR (100 MHz, CDCl3, ppm): δ 183, 171.6, 168.3, 155.3, 79.8, 59.6, 42.2, 39, 35, 26, 24, 22, 20,17; ESI MS: m/z 560/562 [M+.].
3.3.3 [6′–amino–2′–thioxo–4′–oxo dihydro–1H–pyrimidin–1–yl]6–imino–5α–cholestane (9)
White powder; yield: 70%, m.p. 123–124 °C; Anal. Calcd for C31H50N4OS: C, 70.57, H, 9.39, N, 10.58 found: C, 70.66, H, 9.45, N, 10.61; IR (KBr) ν cm−1: 3349, 3284 (NH, NH2), 1670 (CO), 1653 (CN), 1620 (CC), 1246 (CS), 1027 (C–N); 1H NMR (400 MHz, CDCl3, ppm): δ 7.8 (s, 1H, NH, exchangeable with D2O), 5.6 (s, 1H, C5′H), 3.2 (s, 2H, NH2, exchangeable with D2O) 1.17 (s, 3H, C10–CH3), 0.72 (s, 3H, C13–CH3), 0.94 and 0.84 (other methyl protons) 13C NMR (100 MHz, CDCl3, ppm): δ 185, 173.6, 167.3, 154.3, 81.4, 39, 35, 26, 24, 22, 20,17; ESI MS: m/z 526 [M+.].
3.4 DNA-binding experiments
3.4.1 Electronic absorption and fluorescence spectroscopy
DNA-binding experiments, including absorption spectral traces and emission spectroscopy, conformed to the standard methods and practices reported in the literature [34–36]. While measuring the absorption spectra, an equal amount of DNA was added to both the compound solution and the reference solution to eliminate the absorbance of the DNA itself, Tris buffer was subtracted through base line correction.
3.4.2 Nuclease activity
Cleavage experiments were performed with Axygen agarose for electrophoresis connected to a Genei 50–500-V power supply, visualized and photographed by the Vilber–INFINITY gel documentation system. Cleavage experiments of supercoiled pBR322 DNA (300 ng) by compound 8 (1.0–5.0 μM) in a 5 mM Tris–HCl/50 mM NaCl buffer at pH 7.2 were carried out and the reaction followed by agarose gel electrophoresis. The sample was incubated for 1 h at 37 °C. A loading buffer, containing 25% bromophenol blue, 0.25% xylene cyanol and 30% glycerol, was added and electrophoresis was carried out at 60 V for 1 h in a Tris–HCl buffer using a 1% agarose gel containing 1.0 μg/mL of ethidium bromide. The reaction was also monitored upon addition of various radical inhibitors and/or activators such as DMSO, tert-butyl alcohol (TBA), sodium azide (NaN3), superoxide dismutase (SOD), mercaptopropionic acid (MPA), glutathione (GSH), and H2O2.
3.4.3 Molecular docking
The rigid molecular docking studies were performed using AutoDock 4 software. A library of compounds 7–9 was taken for the following docking study. The crystal structure of the B–DNA dodecamer d(CGCAAATTTCGC)2 (PDB ID: 1BNA) was downloaded from the protein data bank. All calculations were carried out on an Intel CORE i5, 3.1 GHz-based machine running MS Windows XP as the operating system. Visualization of the docked pose has been done using PyMol molecular graphics program.
3.5 In vitro cytotoxicity (MTT assay)
3.5.1 Cell lines and culture conditions
Human cancer cell lines A545 (lung carcinoma cells)/ATCC (CRL-2579), MCF-7 (breast cancer cells)/ATCC (HTB-22), HeLa (cervical cancer cells)/ATCC (CCL-2), HL-60 (leukaemia cells)/ATCC (CCL-240), SW480 (colon adenocarcinoma cells)/ATCC (CCL-228), HepG2 (hepatic carcinoma cells)/ATCC (CRL-8065), HT-29 (colon cancer cells)/ATCC (HTB-38), and A549 (lung carcinoma cells)/ATCC (CCL-185) were taken for the study. SW480, A549, A545, HL60, HT29 and HepG2 cells were grown in RPMI 1640 supplemented with 10% of foetal bovine serum (FBS), 10 U of penicillin and 100 μg/ml of streptomycin at 37 °C with 5% of CO2 in a humidified atmosphere. HeLa and MCF-7 cells were grown in Dulbecco's modified Eagle's medium (DMEM) supplanted with FCS and antibiotics, as described above for RPMI 1640. 184B5 and MCF10A immortalized breast cells were maintained in mammary epithelial basal medium supplemented with an MEGM mammary epithelial SingleQuot Kit® (Cambrex). NL-20 (normal lung cells), HPC (normal pulp cells), HPLF (periodontal ligament fibroblasts) were grown at 37 °C with 5% of CO2, 95% of air under humidified conditions. Fresh medium was given every second day and on the day before the experiments were done. Cells were passaged at preconfluent densities, using a solution containing 0.05% of trypsin and 0.5 mM of EDTA.
3.5.2 Cell viability assay (MTT)
The in vitro cytotoxicity was measured using the MTT assay. The assay was carried out according to a known protocol [28,29]. Exponentially growing cells were harvested and plated in 96-well plates at a concentration of 1 × 10⁴ cells/well. After 24 h of incubation at 37 °C under a humidified 5% CO2 atmosphere to allow cell attachment, the cells in the wells were treated with target compounds at various concentrations for 48 h. DMSO concentration was always kept below 1.25%, which was found to be non-toxic to the cells. A solution of 3-(4,5-dimethylthiazo1-2-yl)-2,5-diphenyltetrazolium bromide (MTT), was prepared at 5 mg/mL in a saline phosphate buffer (PBS; 1.5 mM KH2PO4, 6.5 mM Na2HPO4, 137 mM NaCl, 2.7 mM KCl; pH 7.4) and 20 μl of this solution were added to each well. After incubation for 4 h at 37 °C in a humidified incubator with 5% of CO2, the medium/MTT mixtures were removed and the formazan crystals formed by the mitochondrial dehydrogenase activity of vital cells were dissolved in 100 μl of DMSO per well. The absorbance of the wells was read with a microplate reader (Bio-Rad Instruments) at 570 nm. The effects of the drug cell viability were calculated using cells treated with DMSO as controls.
3.5.3 Data analysis
The cell survival was calculated using the formula: survival (%) = [(absorbance of treated cells – absorbance of culture medium)/(absorbance of untreated cells – absorbance of culture medium)] × 100 [37,38]. The experiments were done thrice and the inhibitory concentration (IC) values were calculated from a dose response curve. IC50 is the concentration (in μM) required for 50% inhibition of cell growth as compared to that of control. IC50 values (shown in Table 1) were determined from the linear portion of the curve by calculating the concentration of agent that reduced absorbance in treated cells, compared to control cells, by 50%. Evaluation is based on mean values from three independent experiments, each comprising at least six microcultures per concentration level.
3.6 Comet assay (Single cell gel electrophoresis)
The comet assay [39] was performed to evaluate the genotoxic effect of the steroidal pyrimidines in MCF-7 cells (7–9). MCF-7 (1 × 10⁶) cells were treated with three different concentrations, 10, 25 and 50 μg/mL of steroidal pyrimidines 7–9 for 24 h. The cells were then washed and 200 μL of cell suspension in low melting agarose (LMA) were layered onto the labelled slides precoated with agarose (1.5%). The slides were placed on ice for 10 min and submerged in a lysis buffer (2.5% NaCl, 100 mM EDTA, 10 mM Tris, 10% DMSO and 1% Troton X–100) at 4 °C at pH 10 for more than 1 h. The slides were then equilibrated in an alkaline buffer (30 mM NaOH, 1 mM EDTA) at pH 13 at 4 °C, electrophoresed at 0.86 V/cm at 4 °C, neutralized, washed, and dried. At the time of capturing the images, the slides were stained with ethidium bromide (EtBr, 150 μL 1X) and cover slips were placed over them. For visualization of DNA damage, EtBr-stained slides were observed under 209 objectives of a fluorescent microscope (Olympus BX-51, Japan). The images of 50–100 randomly selected cells were captured per slide using a CCD camera.
4 Conclusion
In summary, we have developed a facile and convenient approach for the synthesis of new steroidal pyrimidine derivatives. The synthesized compounds were subjected to in vitro DNA binding studies by using various biophysical techniques to determine its effect on the DNA binding propensity. The results revealed that compounds bind to DNA via the electrostatic interaction preferentially with the phosphate backbone of DNA helix in addition to hydrophobic interaction. The docking studies reveal that the extent of the intercalation between the compounds and DNA is due to the pyrimidine moiety in the steroidal molecule, which creates the hydrogen bonding efficiency of the respective compounds with the nucleotide base pairs of DNA. Moreover, compound 8 exhibited efficient nuclease activity, revealing the double-strand cleavage; in the presence of different activators, it seems to follow the oxidative pathway involving the singlet oxygen and superoxide anion to generate ROS, responsible for initiating DNA strand scission. During cytotoxic evaluation, compounds 7 and 9 showed minimum IC50 values, indicating that the compounds were active towards various cancer cell lines. In conclusion, this protocol provides a convenient strategy to annelate steroid nucleus with widespread bioactive pyrimidines there by extending the categories of heterosteroids. This strategy may also provide valuable information for the further design and development of more active cytotoxic agents through various modifications and derivatizations.
Acknowledgements
The authors thank the Chairman, Department of Chemistry, A.M.U. Aligarh, for providing the necessary research facilities, the UGC for a research fellowship (AMD), SAP (DRS-I) for research support. ICGEB, New Delhi, is also gratefully acknowledged for docking studies.