

1 Introduction
The use of NMR as analytical strategy is more and more widespread in quality control or adulteration control in sectors such as food, pharmaceutical, detergents or petrochemical industries [1]. In this paper, we focus our study on the analysis of surfactants. These amphiphilic molecules act as emulsifiers, dispersant, wetting or foaming agents… and are mainly used in detergent and personal care products. Due to the nature of their polar head, surfactants may be classified into anionic, cationic, non-ionic and amphoteric surfactants.
NMR is a powerful technique to analyze complex mixtures without prior chromatographic separation. Nevertheless very few surfactant NMR studies can be found in the literature. The first paper about NMR quantitative analysis of surfactants was proposed by Flanagan et al. in 1963 [2]. The integration of 1H NMR spectra gave the average value of the alkyl chain length and polyethoxylated part in the case of non-ionic surfactants. 13C NMR assignment of anionic, cationic and non-ionic surfactants were proposed by Carminati et al. [3] as a preliminary screening for the analysis of manufactured products. Fournial et al. [4] proposed a 1H and 13C study of polyethoxylated alcohol mixtures to determine the distribution of alkyl chain and the ethoxylated moiety. The methodology was developed on known mixture of monodisperse polyethoxylated alcohols and on a commercial surfactant.
NMR spectra of complex mixtures present peaks superposition, which makes interpretation difficult. However, NMR spectroscopy is a powerful technique, which combines many advantages: it provides structural and quantitative information of simple or complex mixtures with minimal sample preparation and no sample degradation. To overcome the superposition issue, many NMR techniques have been developed including relaxation filters and diffusion methods [5]. In this paper, diffusion method was chosen. In particular, DOSY experiment using pulsed field gradient solves peaks superposition [6,7]. Using Inverse Laplace Transform (ILT), all chemical shifts in the direct dimension are dispersed along the second dimension in relation to diffusion coefficient. This approach does not make any assumption about the number of exponential components. Influence of polymer molecular mass distributions through NMR diffusion experiments has been widely described in literature [8–11]. Politi et al. have used for the first time NMR DOSY experiment to directly analyze commercial herbal tinctures [12]. 2D DOSY and 3D COSY-DOSY experiments have been used to check natural herbal drugs adulteration with synthetic phosphodiesterase-5 (PDE-5) inhibitors [13] or to distinguish fake formulations of Viagra [14]. 3D BEST-DOSY was implemented to circumvent severe overlap problems in 2D DOSY experiments. Shukla and Dorai [15] have proposed this method as an alternative to 3D HMQC-DOSY experiments, which is more time consuming. Different kinds of components over a large range of molecular mass have been studied: amino acids mixture, small molecules with similar molecular mass mixtures (geraniol/camphene/quinine) and commercial gasoline. Rogerson et al. [16] used the property of lanthanide dispersing chemical shift (LSR = lanthanide shift reagents) to enhance chemical shift resolution in a mixture of n-hexane, hexan-1-ol and n-heptanal. In the second dimension, the LSR allows a better separation of the diffusion constants. In the case of isomers, it is impossible to use DOSY experiments to discriminate two isomers of same molecular mass except if a Matrix-assisted DOSY is employed, as observed by Tormena et al. [17]. Indeed, the separation in relation to diffusion constants is reliable using a co-solute such as a surfactant (sodium dodecyl sulfate, SDS), which interacts with only one isomer. In the literature, most DOSY experiments use 1H nucleus because of its high sensitivity. But, some authors prefer the use of less sensitive nucleus such as 13C due to its large spectral width leading to less overlapping signals. As example, Botana et al. [18] have proposed a 13C DEPTSE DOSY experiment to discriminate the diffusion constants of three components (1-propanol, 1-butanol, 2-pentanol and 3-methyl-3-pentanol).
For our study, 1H NMR DOSY was the most suitable technique because small amount of each compound was necessary to prevent micelle formation. To qualitatively discriminate the different component of complex mixtures, the diffusion constants have to be correlated to a physical parameter of each component. Starting from the Einstein diffusion equation:
| (1) |
| (2) |
| (3) |
2 Experimental
2.1 Samples
Detergent formulations were mainly composed of anionic or non-ionic surfactants. Our study aims at discriminate these two different families in a simple mixture. For this purpose, we recorded 1D 1H NMR and 2D DOSY NMR spectra of 18 pure surfactants (7 anionic, 11 non-ionic from Sigma Aldrich). To test our method, DOSY spectra were recorded for industrial raw materials (supplied by different companies) and for one simple mixture of three components.
2.2 NMR analysis
1H NMR spectra were recorded on a Bruker Avance III HD 400 MHz spectrometer equipped with a 5-mm QNP probe with z-gradients. Each sample was prepared as follows: 1–2 mg of product were dissolved into 600 μL of DMSO-d6. DOSY experiments were recorded using stimulated echo employing bipolar gradients and a longitudinal eddy current delay [22]. The different parameters were: Δ = 150 ms; δ = 1.5 ms; ns = 64; 65536 × 16 data points; T = 303 K; recycle delay = 2 s. The gradient strength was linearly incremented from 0.963 to 45.743 G·cm−1. Data were processed with the maximum entropy algorithm [23] (software NMRNoteBook including the DOSY module).
3 Results and discussion
3.1 Calibration curve: surfactant molecular mass extracted by DOSY
The aim of the method is to separate by NMR different surfactant of a complex mixture. Between1 and 2 mg of each sample were dissolved in 600 μL of DMSO-d6 to limit surfactant concentration below the critical micellar concentration thus avoiding micelle formation. To analyze a complex mixture by NMR, DOSY experiment is the most suitable experiment [24]: 1H channel is used to record experiments so there is no problem of sensitivity because of a small amount of sample required; the second dimension of DOSY experiment separates compounds by their diffusion coefficient; and according to the Flory's law, the diffusion coefficient depends on the molecular mass [8,9,20]. The relation, derived from eq. (3) is given by:
| (4) |
DOSY experiments were processed with NMRNotebook. It is not possible to recalculate the molecular mass of compound dissolved in DMSO with the software compiled macro. Eighteen samples of pure polyethoxylated alcohols, polyethoxylated lauryl ether sulfates (LES) and polysorbates were dissolved in DMSO-d6 (Table 1). DOSY experiments were recorded three times for each sample to calculate K (= Cr) and α parameters in the case of surfactants. The mean value of each sample diffusion coefficient is presented in Table 1. To determinate the molecular mass of our product, the DMSO signal was chosen as reference and equation (4) should be written as:
| (5) |
List of pure surfactant diffusion coefficients used to fit the empirical equation (3).
| Name | Molecular mass (g·mol−1) | Diffusion coefficient (μm2·s−1) |
| Anionic surfactant | ||
Lauryl sulfates | Lauryl ether sulfates (LES) CiEj–OSO3Na | |
| SDS | 288.4 | 393 ± 13 |
| Sodium tetradecyl sulfate | 316.4 | 373 ± 22 |
| C12E2–OSO3Na | 376.7 | 330 ± 18 |
| C12E4–OSO3Na | 464.7 | 304 ± 34 |
| C12E6–OSO3Na | 552.7 | 267 ± 9 |
| C14E4–OSO3Na | 492.7 | 304 ± 34 |
| C14E6–OSO3Na | 580.7 | 262 ± 8 |
| Non-ionic surfactant | ||
Polyethoxylated alcohols CiEj–OH | Polysorbate | |
| Dodecanol | 186.3 | 486 ± 27 |
| 1–Tetradecanol | 214.4 | 460 ± 26 |
| Butoxyethanol | 118.2 | 619 ± 53 |
| C12E2–OH | 274.4 | 396 ± 13 |
| C12E4–OH | 362.5 | 339 ± 37 |
| C12E6–OH | 450.7 | 306 ± 27 |
| C14E4–OH | 390.7 | 319 ± 55 |
| C14E6–OH | 478.7 | 306 ± 27 |
| Polysorbate 80 | 1310.0 | 161 ± 40 |
| Polysorbate 60 | 1311.7 | 144 ± 14 |
| Polysorbate 40 | 1283.8 | 190 ± 29 |
Fig. 1 presents the correlation between the diffusion constant and the molecular mass for the 18 samples. To estimate the diffusion precision, experiments have been recorded three times. Error bars have been calculated with a standard deviation of 2σ for each surfactant. Data were fitted according to eq. (5) allowing the determination of K = Cr = 5.18 ± 0.70, a shape factor α = 0.45 ± 0.02. The molecular family fractal dimension constant δF was fitted using:
| (6) |
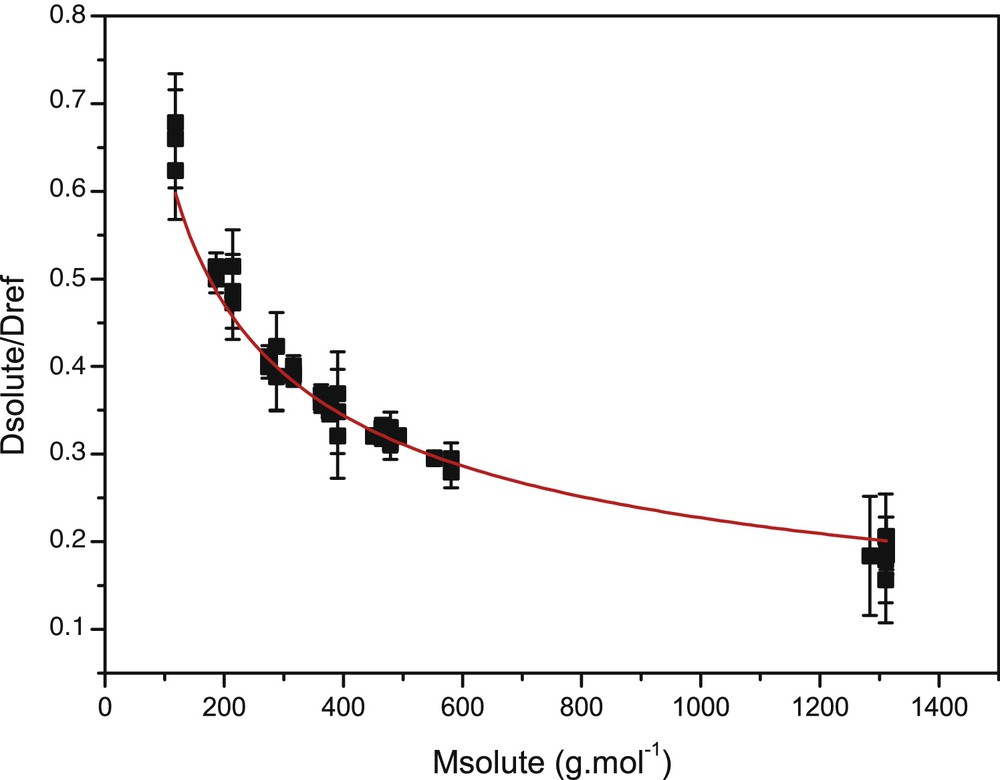
(Color online). A correlation between diffusion coefficients and molecular masses for each pure surfactant is represented. The error bars were calculated using a standard deviation 2σ for each surfactant obtained from the three repetitions of each experiment. Data fitting is represented by the bold curve.
We obtained δF = 2.21 ± 0.11. The δF value is in good agreement with previously published results (from 2.56 to 1.41) [8]. The adjusted R2 value is 0.984. This equation was validated for the range of molecular mass between 118 and 1350 g·mol−1.
The developed equation was then used to estimate the molecular mass of industrial raw materials, which often are surfactant mixtures, made of different alkyl chains lengths and/or ethoxylated moieties number. First example was a polyethoxylated lauryl ether sulfate (TAN12012), which also contains SDS. Through the integration of 1D 1H NMR spectrum, it was possible to calculate the mean chemical formula and determine SDS proportion. Here, TAN12012 has a mean composition of C12.4E1.9 and contains 22% of SDS. DOSY experiment was carried out on this sample and three diffusion constants were extracted (Table 2). From these three values, we determined a molecular mass of 220 ± 100 g·mol−1 for SDS and 370 ± 163 g·mol−1 for TAN12012. Those values were consistent with SDS molecular mass (288 g·mol−1) and pure LES C12E2, which is 376.5 g·mol−1.
Comparison of theoretical and experimental molecular masses calculated both from each raw material and from the mixture analysis.
| Name | D (μm2·s−1) | Mtheoretical (g·mol−1) | Mexp−product (g·mol−1) |
| Raw materials | |||
| TAN12012 (C12.4E1.9) | 330 ± 33 | 376,5 (C12E2) | 220 ± 100 |
| Including SDS | 412 ± 41 | 288 | 370 ± 163 |
| TNI12015 (C12.3E3.7) | 321 ± 32 | 363 (C12E4) | 390 ± 173 |
| TNI12029 | 358 ± 36 | 363 (C12E4) | 290 ± 128 |
| TAM12002 | 447 ± 45 | 117 | 165 ± 74 |
| SDS | 400 ± 40 | 288 | 300 ± 136 |
| TAN12007 (C11.9E2.7) | 303 ± 30 | ∼ 402 | 370 ± 163 |
| TNI12018 | 161 ± 16 | 1310 | 1747 ± 787 |
| Mixture | |||
| TAM12002 | 497 ± 50 | 117 | 136 ± 61 |
| SDS | 358 ± 36 | 288 | 240 ± 106 |
| TAN12007 | 269 ± 27 | 402 | 530 ± 236 |
| TNI12018 | 145 ± 15 | 1310 | 2060 ± 931 |
Second example was a polyethoxylated alcohol (TNI12015, C12.3E3.7). As described by the previous example, TNI 12015 is composed of polyethoxylated alcohol of different alkyl chains lengths and/or ethoxylated moieties number. No SDS was found in this sample. DOSY experiment allowed determining two diffusion constants (Table 2). Calculations gave a molecular mass of 390 ± 173 g·mol−1 for TNI12015. This value was consistent with pure polyethoxylated alcohol C12E4 molecular mass that is 363 g·mol−1.
Third example was a polyethoxylated alcohol (TNI12029, C12.5E3.4) for which we obtained two diffusion constants (Table 2). Calculations gave MTNI12029 = 290 ± 128 g·mol−1. This value is consistent with pure polyethoxylated alcohol C12E4 molecular mass that is 363 g·mol−1.
The fitted parameters, K and α, were optimized for pure surfactants and tested successfully on simple raw materials.
3.2 Analysis of complex mixtures
The fitted equation was then tested on a complex mixture composed of three commercial raw surfactants: 0.4 mg betaine (TAM12002, M = 117 g·mol−1), 0.4 mg LES (TAN12007 ∼ C11.9E2.7, M ∼ 402 g·mol−1) and 0.4 mg polysorbate 80 (TNI12018, M = 1310 g·mol−1) dissolved in 600 μL of DMSO-d6 containing 0.05% TMS. This mixture corresponds to a classical mixture found in commercial detergent products. Fig. 2A shows 1D 1H spectra of each component and the mixture. Fig. 2B shows mixture 2D DOSY spectrum. Five diffusion coefficients were discriminated (vertical lines on the spectrum, see Table 2). Those results lead to molecular mass determination: MTAM12002 = 157 ± 61 g·mol−1, MSDS = 256 ± 99 g·mol−1, MTAN12007 = 520 ± 200 g·mol−1, and MTNI12018 = 1690 ± 658 g·mol−1.
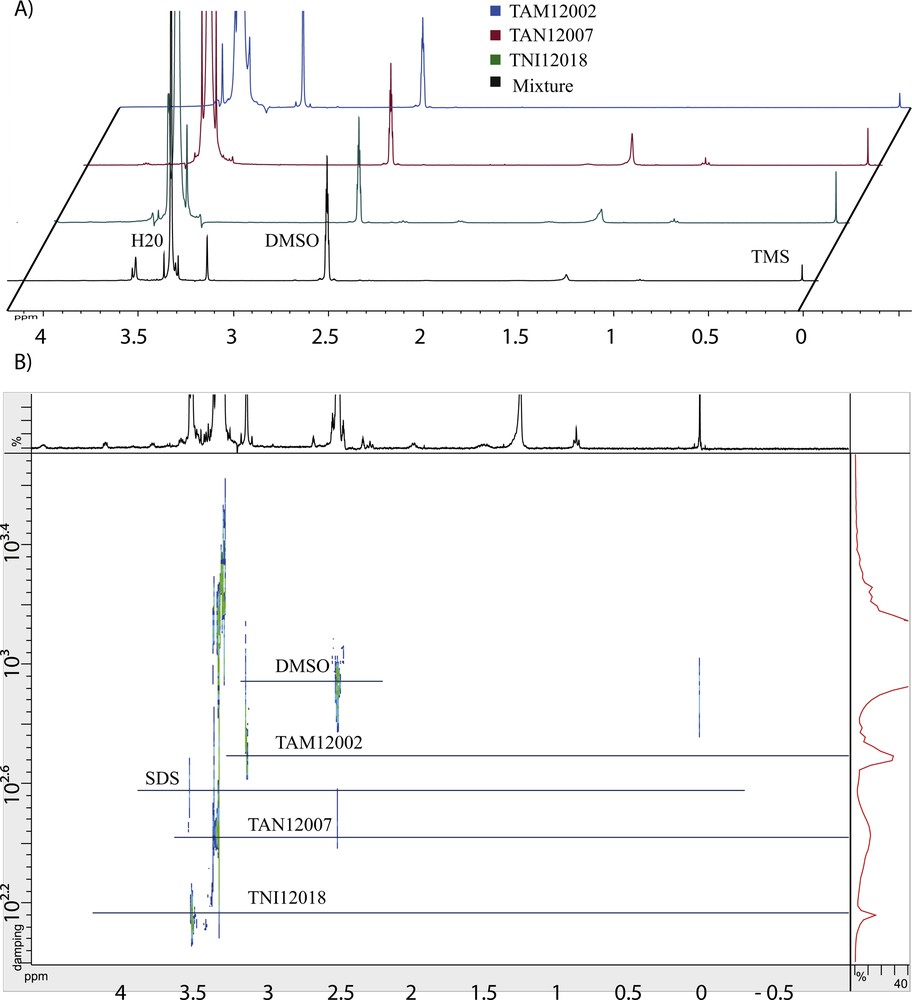
(Color online). A. 1D 1H NMR spectra of each component and the mixture dissolved in DMSO-d6. B. 2D DOSY spectrum of a complex mixture. This mixture was composed of 0.4 mg of betaine (TAM12002), 0.4 mg of LES (TAN12007 ∼ C11.9E2.7) and 0.4 mg of polysorbate 80 (TNI12018) dissolved in 600 μL of DMSO-d6 containing 0.05% TMS. The lines indicate the diffusion coefficient values of each compound.
To check that there was no interaction between the three surfactants, DOSY experiments were carried out for each compound alone. We obtained diffusion constant values leading to: MTAM12002 = 186 ± 72 g·mol−1, MTAN12007 = 370 ± 144 g·mol−1 (MSDS = 270 ± 105 g·mol−1) and MTNI12018 = 1434 ± 555 g·mol−1 (Table 2).
Direct 1D 1H NMR spectrum interpretation of mixture encountered two difficulties, which are the number and the family of each component. Indeed, TAN12007 and TNI12018 had similar 1D 1H spectra because of similar chemical functions. But recording 2D DOSY allowed obtaining two diffusion constants and hence two components of different molecular masses. The discrimination was hence possible. Moreover, it is possible to distinguish the SDS presence in the mixture through the characteristic peak at 3.6 ppm corresponding to CH2-OSO3Na group signal. TAM12002 was the only component which has a specific peak at 3.14 ppm. Molecular mass determination confirmed the quaternary amine size.
Carminati et al. [3] have presented the first NMR application to surfactants identification using 13C NMR spectra. Combining a NMR sample database of non-ionic, cationic, anionic or amphoteric surfactants and the advantage of the large 13C spectral width, they propose a preliminary screening method for surfactants analysis in commercial products. In the same manner, Fournial et al. [4] proposed a new methodology focusing on polyethoxylated alcohol family to discriminate the alkyl chain length and the polyethoxylated moiety. 1D 1H and 13C NMR spectra direct analysis of monodisperse surfactants of increasing complexity permitted the determination of the mean composition as well as the distribution of the alkyl chain up to 16 and the polyethoxylated moiety up to 8. These two NMR studies allowed the determination of a mixture composition only recording 1D NMR spectra without chromatographic pretreatment. Nevertheless, these two methods cannot distinguish each species individually. Our study proposes a new significant improvement in deformulating complex mixtures. Indeed, recording 2D DOSY experiment of mixture samples give direct information about components number and 1D spectra extraction give information on each component family. Moreover, using our new calibration curve, it is possible to estimate quite satisfactorily the range of molecular mass (between 118 and 1350 g·mol−1).
4 Conclusion
A new correlation was obtained between surfactant diffusion coefficients and molecular masses dissolved in DMSO-d6. The fitted parameters could be implemented in the NMRNotebook DOSY module (MW.py) to estimate the molecular mass with uncertainties from the diffusion coefficient.
The validity of this equation has been checked for pure surfactants, raw materials and in the case of simple mixture in DMSO solvent. Nowadays, we could propose to use it in the case of more complex mixtures, such as commercial detergent products. The extraction of the different diffusion coefficients could discriminate the molecular mass range and 1D spectra extraction of each product could give information about surfactant classes (anionic, non-ionic…) without sample pretreatment.
Acknowledgments
We would like to thank the French “Ministère de la Recherche et de l’Enseignement supérieur” for the fellowship of Alexandra Gaubert.