

1 Introduction
The biomass valorisation is essential in the energy production field and its gasification is known as the most promising way among all its thermochemical conversion processes [1–3]. The syngas produced can be hydrogen enriched by the use of steam as the gasification oxidant agent [3] and by the Water–Gas Shift (WGS) reaction occurring in the gasifier or enhanced in a downstream catalytic fixed bed reactor.
The catalytic phases efficient in WGS are well known because of the age of the studies on this reaction: the high-temperature catalysts (around 300–500 °C) and the low-temperature catalysts (around 200–300 °C) [4–7]. Typically, the metal used for the high-temperature reaction is iron as alpha-Fe2O3, which is in situ reduced to the active phase Fe3O4. The loss of stability of iron catalysts is due to rapid thermal sintering of Fe3O4 crystallites [8]. Iron catalysts can be combined with a promoter as Cr2O3 to increase its stability. Other less toxic metal oxides (Ce, Ca, Zr, Cu, Al oxides) have increasingly replaced Cr2O3 with variables activities and stabilities [4–11]. To increase the catalyst's stability, the creation of metal/support interaction and the dispersion of metal were needed. Ceria is a promising choice as washcoat and as promoter thanks to its high surface area [12–17]. A high specific surface area should improve the iron phase dispersion on the support that limits the metal sintering under reactivity conditions and then the catalyst deactivation by carbon fouling.
Another reason for iron catalyst deactivation is the over-reduction of iron oxide leading to metallic iron and iron carbide formation. Metallic iron species are active phases for methanation and Fischer–Tropsch reactions [8], particularly undesirable in the WGS process. Moreover, even with a relatively low over-reduction, iron catalysts in pellet form can undergo weakening and physical damage with pellet degradation resulting in a significant pressure drop across the reactor [8].
The addition of a CeO2 washcoat can also increase the catalytic efficiency of iron in the Water–Gas Shift reaction [12,13]. In fact, CeO2 is well known to enhance the oxidative role of the catalyst thanks to its high mobility of bulk oxygen species [12–18] and the easy transition between the oxidized and the reduced forms of Ce4+/Ce3+.
In this study, the syngas was produced by a circulating bubbling fluidized bed gasifier using steam as the oxidative agent and working at atmospheric pressure. The hydrogen enriching by the WGS reaction is processed by a Pressure Swing Adsorption (PSA) system to obtain a continuous process for pure hydrogen production from biomass (European Collaborative Project: UNIQUE gasifier for Hydrogen production “UNIfHY”). The gasification conditions leave very little room for the cleaning section in terms of allowable pressure drop. The use of a ceramic foam as the WGS catalyst support limits the pressure drop usually induced by the WGS catalyst fixed bed [19,20]. This configuration of the WGS catalyst supported on ceramic foam represents the innovative part of the study. The great influence of operating parameters, such as H2O/CO ratio and reaction temperature on sintering and coke formation during high-temperature Water–Gas Shift catalysts is reported in the literature [21,22]. The different iron/CeO2/foam catalysts’ efficiency and stability were studied versus preparation (iron and ceria contents) and operating parameters. The range of the operating parameters are defined and limited by the European project framework and the conditions at the gasifier outlet.
2 Experimental and methods
2.1 Catalyst preparation
Alumina-based ceramic foams, provided by Pall Filtersystems GmbH, were used as supports for Water–Gas Shift catalysts deposition. The cylinder foams have an outer diameter of 20 mm, a length of 20 mm and have 45 pores per inch (ppi).
2.1.1 Washcoat impregnation
The foams were dipped for 1 h into an aqueous solution of cerium nitrate. The concentration of the cerium nitrate solution was varied (from 0.44 mol·L−1 to 1.73 mol·L−1) to modify the amount of washcoat deposited (from 4.5 to 16 wt%). The impregnated foams were dried over a rotary instrument under a hot air stream at 100 °C then calcined for 4 h at 400 °C (rate 3 °C·min−1). If the desired amount of washcoat was not reached, the impregnation, drying and calcination steps could be performed again under the same conditions for 1 or 2 times.
2.1.2 Catalyst impregnation
The washcoated foams (CeO2/foam with 45 ppi) were dipped for 1 h into an aqueous solution of iron nitrate. The concentration of the solution was varied (from 1.5 mol·L−1 to 2.1 mol·L−1) to modify the amount of deposited metal (from 5 to 10 wt%) depending on the amount of ceria washcoat. The impregnated washcoated foams were dried over a rotary instrument under a hot air stream at 100 °C then calcined for 4 h at 450 °C (rate 3 °C·min−1). If the desired catalyst amount was not reached, the impregnation, drying and calcination steps could be performed again, 1 or 2 more times.
2.2 Characterization techniques
2.2.1 Optical microscopy
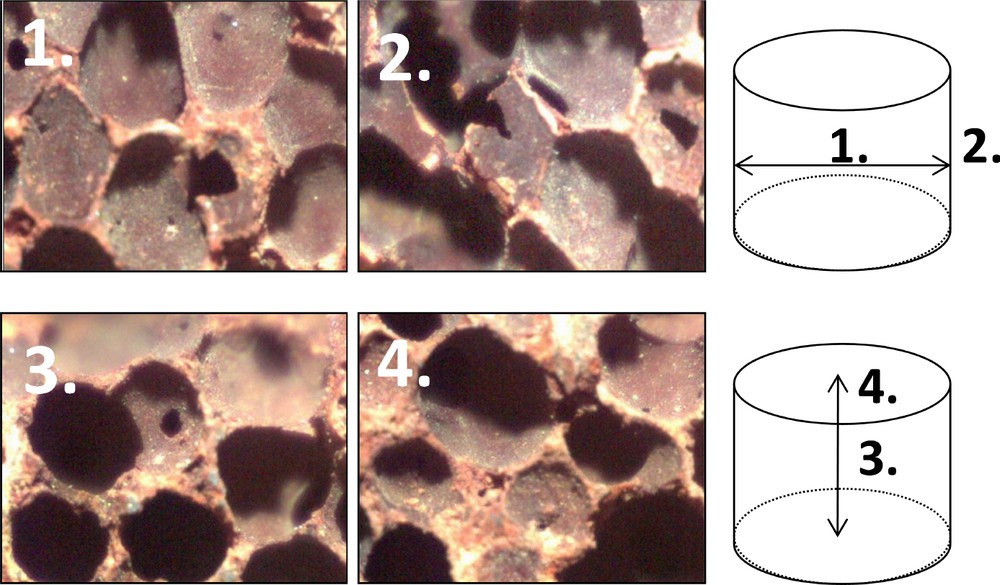
The washcoat and catalytic phase deposition homogeneity was studied by optical microscopy on a Digital Blue Q × 5 microscope. It was determined by comparison of the external faces and the cutting sections in the height and in the diameter directions of the foam (Fig. 1).

Sections compared for the evaluation of the depositions homogeneity of the washcoat and catalytic phase.
2.2.2 Deposited amounts and anchoring tests
The amount deposited was evaluated by weighing the samples and calculating the mass of washcoat and catalyst deposited on the foam.
The anchoring tests were performed to verify the anchorage of the washcoat and the catalytic phase on the foam. They consisted of two steps of sonication in water during 5 min, then in n-heptane during 5 min. The weight loss (washcoat or catalyst) was calculated after each exposition to ultrasounds.
2.2.3 X-Ray diffraction
X-ray diffraction patterns were acquired with a Bruker AXS-D8 Advanced using Cu Kα radiation (λ = 1.5406 Å) to identify the crystalline phases (step = 0.06°, time per step = 2 s) in a 2θ range between 20° and 70°. The diffraction spectra have been indexed by comparison with the JCPDS files (Joint Committee on Powder Diffraction Standards). The washcoat and catalyst particle sizes were determined using the Debye–Scherrer equation from X-ray line width broadening taken through the full width at maximum half-height (FWMH) of the most intense on no overlapping ray with almost 6% of uncertainty. The lattice parameter (a) was calculated by Eq. (1), characteristic of a cubic phase, with d: the inter-reticular distance and hkl the Miller indexes.
| (1) |
2.2.4 BET surface area
The BET surface area of washcoated and catalytically activated foams was obtained by means of nitrogen adsorption at 77 K using a Micromeritics ASAP 2420 instrument. Before each measurement, the samples were degassed overnight under vacuum at 250 °C.
2.2.5 Temperature programmed reduction
Temperature programmed reduction was performed on 150 to 500 mg of sample, under 10%H2/Ar with a total gas flow of 50 mL·min−1. The temperature was increased from room temperature to 900 °C at a rate of 15 °C·min−1, and the hydrogen consumption of the samples was followed by a thermal conductivity detector until the return to the baseline.
2.3 Reactivity tests
Fig. 2 presents the experimental set-up. The gas mixture at the gasifier outlet was reproduced by mass flowmeters. Steam was produced in the vaporization room (100 °C), then carried to the reactor by the flow of gas mixture. At the reactor outlet, water was trapped by condensation in an ice bath.

(Color online.) Diagram of bench scale apparatus for catalytic activity tests.
Gaseous products were analyzed online by a micro-gas chromatograph (Hewlett Packard Quad Series Micro GC Model G2891A, SRA instruments) equipped with TCD and permitting N2 + CO, CH4 and CO2 separation on a PoraPLOT U column and H2, N2, CH4 and CO on a molecular sieve MS5A column.
Pressure drop measurements were performed with a PD-41X (KELLER instrument, 0–30 mbar), at 25 °C under 450 mL·min−1 of air, to evaluate if the pores’ filling would be detrimental, or not, to any further application.
Reactivity tests were performed by using a fresh catalyst for each test and under a gas mixture corresponding to that obtained at the gasifier outlet (dry composition: 47% H2, 27% CO, 19% CO2, 2% CH4 and 5% N2). Different amounts of water were added to this mixture to study the H2O/CO ratio effect (from 0.65 to 2). The total flow rate varied from 310 NmL·min−1 to 510 NmL·min−1 to adjust the residence time to a constant value of 0.38 s (imposed by the reactor size at the pilot scale) at different reaction temperatures (between 300 and 600 °C). The influence of preparation parameters as the catalysts’ composition (different amounts of CeO2 and Fe2O3) was also studied.
The results of reactivity in Water–Gas Shift reaction are given in terms of CO conversion, which was calculated as the fraction of CO consumed to CO in the inlet feed [Eq. (2)]
| (2) |
The results of reactivity in the Water–Gas Shift reaction are also given in terms of H2 content which was calculated as the molar H2 percentage at the reactor outlet in the dry gaseous mixture and compared to the molar H2 percentage at the reactor inlet (47%).
The values of CO conversion and H2 content were always compared to the thermodynamic values calculated under the same conditions (Prosim software).
Carbon balance (CB) is determined by the following equation (Eq. (3))
| (3) |
3 Results and discussion
3.1 Catalysts characterization
3.1.1 Optical microscopy
Firstly, washcoated foams were compared to the reference foam (non-impregnated foam) to observe the ceria deposition (Fig. 3). Depending on the synthesis conditions, the homogeneity or heterogeneity of the deposition was evaluated by the difference in color. The wet impregnation by a single step with an aqueous cerium nitrate solution led to a homogeneous deposition of the washcoat (Fig. 4) unlike wet impregnation by multiple steps. This homogeneity was obtained for all the washcoated foams used for the following step (catalyst impregnation).
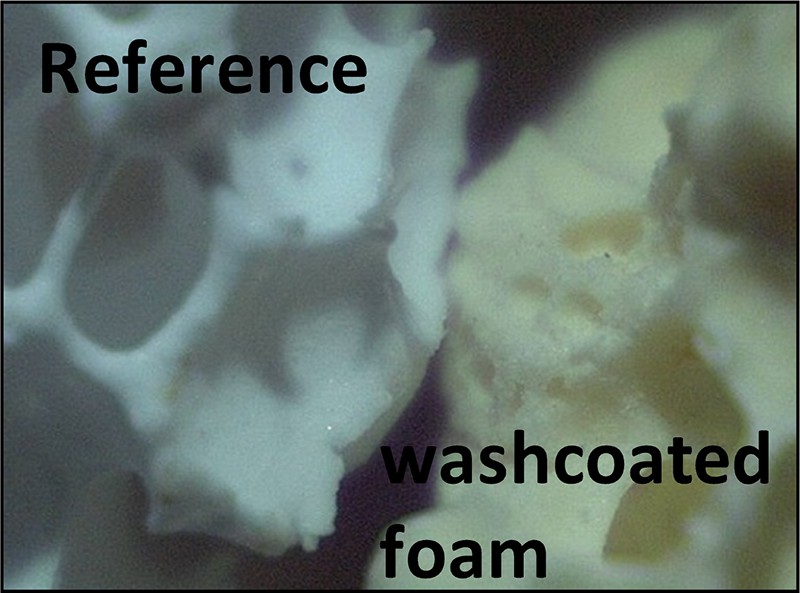
(Color online.) Comparison between a non-impregnated foam and a washcoated foam by optical microscopy.

(Color online.) Optical microscopy of the internal diameter and the internal height, 3.7 wt%CeO2/foam.
The catalytically activated foams were compared to the reference foam (non-impregnated foam) to observe the iron oxide deposition (Fig. 5). The wet impregnation with an aqueous iron nitrate solution by a single step (2.1 mol·L−1) or by two or three steps (1.5 mol·L−1) led to a homogeneous deposition of the catalytic phase (Fig. 6). This homogeneity was obtained for all the catalytically activated foams used for further study of characterizations or reactivity tests.

(Color online.) Comparison between a non-impregnated foam and a catalytically activated foam by optical microscopy.
(Color online.) Optical microscopy of the internal diameter and the internal height, 6.7 wt%Fe/6.6 wt%CeO2/foam.
3.1.2 Deposited amounts and anchoring tests
The anchoring tests led to the determination of the washcoat or the catalyst anchorage on the foam. The obtained catalysts with ceria and iron loadings on the catalytically activated foams are presented in Table 1.
Ceria and iron loadings on the catalytically activated foams.
| Washcoat loading (wt%) | Iron solution concentration (mol·L−1) | Step(s) for iron deposition | Iron loading (wt%) |
| 4.8 | 2.1 | 1 | 5.7 |
| 6.6 | 2.1 | 1 | 6.7 |
| 8.8 | 2.1 | 1 | 6.2 |
| 10.0 | 2.1 | 2 | 10.0 |
| 16.8 | 2.1 | 2 | 7.5 |
| 15.5 | 2.1 | 3 | 10.6 |
| 6.8 | 2.1 | 1 | 4.4 |
| 17.1 | 1.5 | 2 | 10.1 |
The amount of deposited catalyst depends on the concentration of the iron nitrate solution and on the amount of washcoat. A large increase in the amount of ceria on the foams led to a decrease in iron loading, leading to the re-impregnating of the foam.
All the catalysts used for further characterizations or reactivity tests presented a loss of weight lower than 6 wt% of washcoat and of catalyst.
3.1.3 X-Ray diffraction
The X-ray diffraction patterns on the foams after impregnation with an iron nitrate aqueous solution (catalytically activated foam) were compared (Fig. 7) to the patterns of the fresh foam and the washcoated foam, previously presented. The phases observed are corundum syn Al2O3 (JCPDS: 10-0173), ceria CeO2 (JCPDS: 65-5923) and hematite α-Fe2O3 (JCPDS: 33-0664). No cerium/iron mixed oxide was detected.
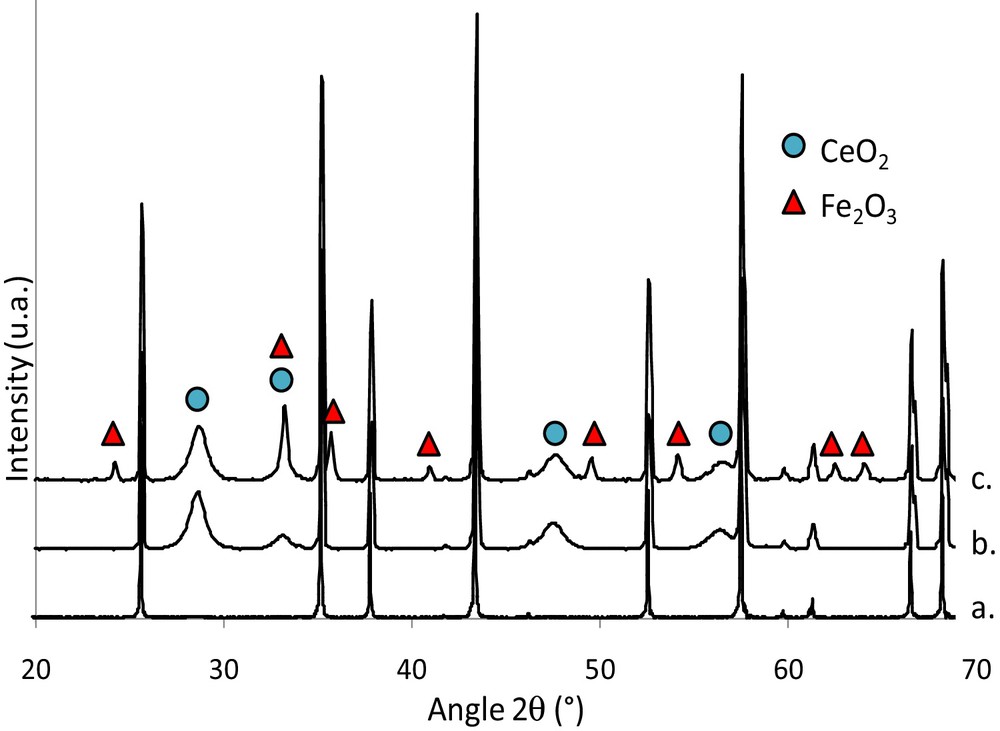
(Color online.) X-ray diffraction patterns of fresh foam, washcoated foam and catalytically activated foams. a: foam; b: CeO2/foam; c: Fe2O3/CeO2/foam.
X-ray diffraction was also used to determine the particle sizes of ceria and iron oxide and the lattice parameter of ceria after impregnation with an iron nitrate aqueous solution (Table 2). The particle size of ceria deposited on foams is unchanged (about 10 nm) compared to the washcoated foams. The lattice parameter of ceria structure after iron impregnation is within an average of 5.39 Å compared to 5.41 Å before impregnation. A part of the iron can be incorporated into the ceria lattice by the substitution of some Ce4+ ions by Fe3+ ions [23], but the XRD analysis did not permit the observation of this phenomenon.
Particles size of CeO2 and Fe2O3 and lattice parameter of CeO2.
| Washcoated foams | Catalytically activated foams | |||||
| Wt% CeO2 | CeO2 particles size (nm) | CeO2 lattice parameter (Å) | Wt% Fe | α-Fe2O3 particles size (nm) | CeO2 particles size (nm) | CeO2 lattice parameter (Å) |
| 4.8 | 12 | 5.40 | 5.7 | 28 | 9 | 5.39 |
| 6.6 | 11 | 5.41 | 6.7 | 38 | 9 | 5.40 |
| 8.8 | 12 | 5.41 | 6.2 | 36 | 10 | 5.40 |
| 10.0 | 12 | 5.41 | 10.0 | 29 | 9 | 5.39 |
| 15.5 | 11 | 5.41 | 10.6 | 30 | 10 | 5.39 |
| 16.8 | 11 | 5.41 | 7.5 | 32 | 10 | 5.39 |
The lowest iron oxide particle sizes (within an average of 28–32 nm) are associated with the lowest CeO2 lattice parameter (5.39 Å) and the highest particle sizes (within an average of 36–38 nm) to the highest CeO2 lattice parameter (5.40 Å). The integration of a part of the iron into the ceria lattice seems to lead to a decrease in the size of α-Fe2O3 particles.
3.1.4 BET Surface area
The impregnation of the washcoat and the catalyst led to an increase in the BET surface area compared to the foam value (< 1 m2·g−1) (Table 3). The expected role of ceria was then verified.
BET surface area of washcoated foams and catalytically activated foams.
| Washcoated foams | Catalytically activated foams | ||
| Wt% CeO2 | BET surface area (m2·g−1) | Wt% Fe | BET surface area (m2·g−1) |
| 4.8 | 4.4 | 5.7 | 7.0 |
| 6.6 | 7.1 | 6.7 | 8.3 |
| 8.8 | 9.0 | 6.2 | 6.8 |
| 10.0 | 9.0 | 10.0 | 8.1 |
| 15.5 | 13.7 | 10.6 | 9.4 |
| 16.8 | 14.6 | 7.5 | 10.3 |
The catalytically activated foams were also compared to the corresponding washcoated foams (Table 3). The addition of iron oxide via impregnation and calcination did not significantly modify the surface area of washcoated foams, which was still approximately from 7 to 10 m2·g−1.
3.1.5 Temperature programmed reduction
The iron oxide called magnetite (Fe3O4) is well known to be the active phase in the Water–Gas Shift reaction. Temperature-programmed reduction (TPR) indicates the temperature required for the reduction of the hematite (α-Fe2O3) phase (initially present on the foams) into the desired magnetite phase. The reduction of the hematite phase into the magnetite phase was observed between 350 °C and 500 °C and the following reduction steps into iron oxide (FeO) and metallic iron (Fe0) appeared between 500 °C and 900 °C. For the catalysts impregnated with 5.7 to 6.7 wt% Fe (Fig. 8), the maximum reduction rate takes place at 365 °C. The mean size of α-Fe2O3 particles seems to have no influence on this temperature (Table 2) while the 6.7% Fe/6.6% CeO2/45 ppi and the 5.7% Fe/4.8% CeO2/45 ppi samples owned α-Fe2O3 particles size of 38 nm and 28 nm, respectively.
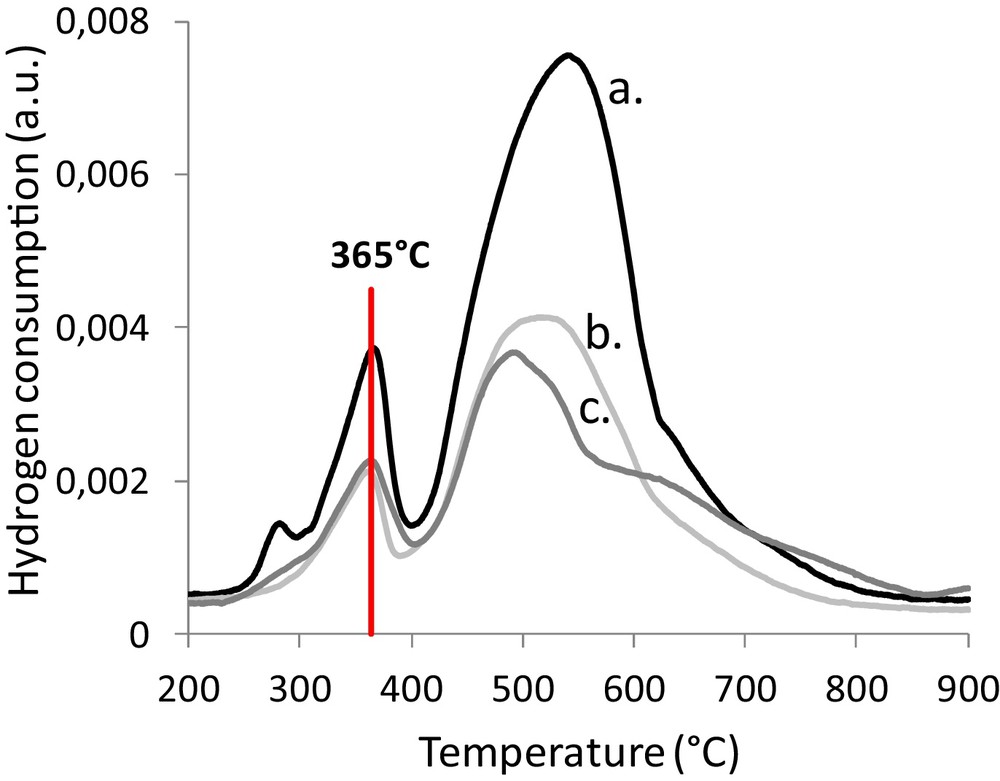
(Color online.) Temperature programmed reduction of catalytically activated foams. a: 6.7% Fe/6.6% CeO2/foam; b: 5.7% Fe/4.8% CeO2/foam; c: 6.2% Fe/8.8% CeO2/foam.
For the catalysts impregnated with an iron amount higher than 7 wt% (Fig. 9), a shift of the hematite-to-magnetite reduction temperature to higher temperatures was observed without significant modification of the size of α-Fe2O3 particles (Table 2).
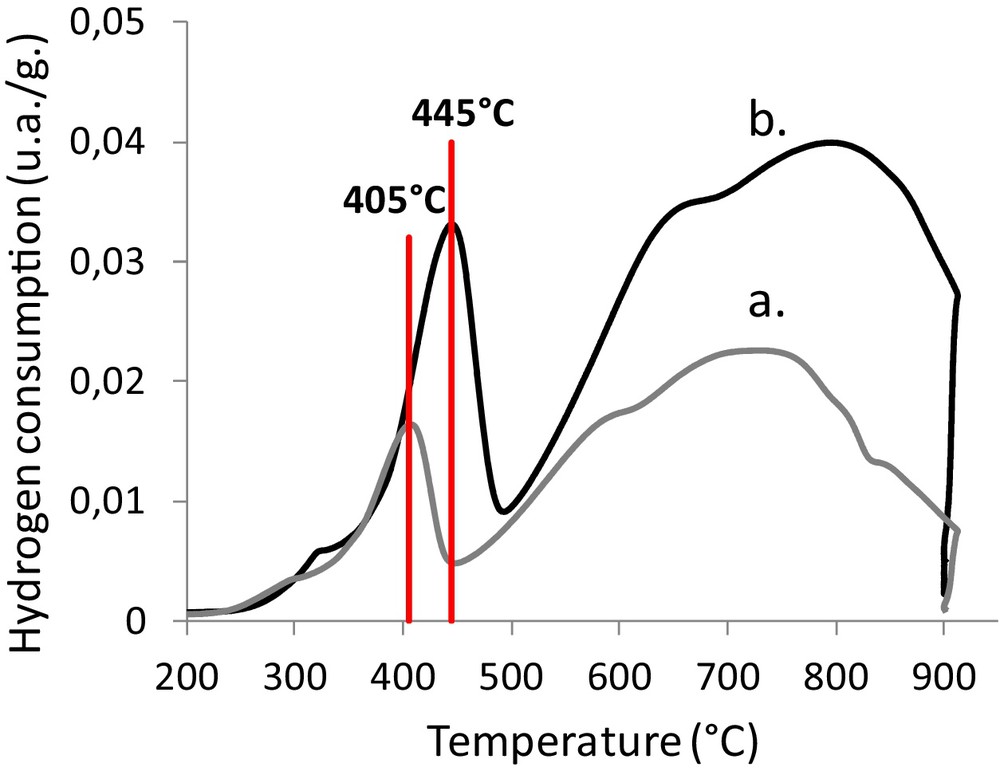
(Color online.) Temperature programmed reduction of catalytically activated foams. a: 7.5% Fe/16.8% CeO2/foam; b: 10.6% Fe/15.5% CeO2/foam.
The catalysts impregnated with high amounts of iron are more difficult to reduce, which could be explained by the formation of an interaction between iron oxide and ceria. The substitution of Ce4+ ions by Fe3+ ions in the network of ceria or iron binding to the ceria surface are the two main hypotheses encountered in the literature [23–29].
Another explanation could be an increase in the thickness of the iron oxide layer leading to less accessibility to a part of the iron oxide by hydrogen.
3.2 Reactivity
Pressure drop measurements (Table 4) showed that an increase in the amounts of ceria and iron oxide led to an increase in pressure drop values. However, even with high amounts of ceria and iron oxide, the measured pressure drop was lower than 0.1 mbar. That would not be detrimental to the use of the foam downstream the biomass gasifier.
Pressure drop measurements on foam catalysts.
| Foam | Wt% CeO2 | Wt% Fe | ΔP (mbar) |
| Reference 45 ppi | Ø | Ø | 0.040 |
| 45 ppi | 4.5 | 6.0 | 0.040 |
| 45 ppi | 17.0 | 7.5 | 0.080 |
| 45 ppi | 16.3 | 10.6 | 0.080 |
3.2.1 Influence of H2O/CO ratio
Table 5 presents the influence of the H2O/CO ratio from 0.65, corresponding to the gas composition at the gasifier outlet, to 2, recommended in the literature [21].
Influence of the H2O/CO ratio. Temperature = 450 °C.
| Catalyst | H2O/CO ratio | Carbon balance (%) | CO conversion (%) | H2 content in dry gas (%) | Thermodynamic CO conversion (%) | Thermodynamic H2 content in dry gas (%) |
| 5.9% Fe/4.8% CeO2/foam | 0.65 | 96 | 17 | 47 | 29 | 51 |
| 5.7% Fe/4.7% CeO2/foam | 1.45 | 95 | 21 | 49 | 57 | 54 |
| 6.0% Fe/4.6% CeO2/foam | 2 | 94 | 24 | 49 | 67 | 55 |
The H2O/CO ratio of 0.65 (Table 5) led to a poor CO conversion, CH4 rather than hydrogen production and a wide carbon formation in the foam pores leading to a breaking of the foam. The methanation reaction is well known on iron catalysts with a low H2O/CO ratio [21,30]. By increasing the H2O/CO ratio to 1.45 and 2, CO conversion reached 21% and 24%, respectively, and H2 production slightly increased. No CH4 formation was observed and the carbon formed on the foam (carbon balance lower than 100%) was probably oxidized by the excess of water permitting a 4-h duration test. These results are in accordance with those obtained by Lee et al. [31] who observed an increase in CO conversion with an increase in the H2O/CO ratio.
The results obtained are not close to the thermodynamic values due to the very low residence time imposed by the reactor size at the pilot scale. However, these reactivity tests determined that, in the aforementioned conditions, the higher H2O/CO ratio (equal to 2) led to the most satisfactory results. This ratio was used for the next reactivity tests.
3.2.2 Influence of the reaction temperature
Table 6 presents the influence of the reaction temperature between 300 °C and 600 °C with the H2O/CO ratio of 2.
Influence of the reaction temperature. H2O/CO ratio = 2.
| Catalyst | Temperature (°C) | Carbon balance (%) | CO conversion (%) | H2 content in dry gas (%) | Thermodynamic CO conversion (%) | Thermodynamic H2 content in dry gas (%) |
| 5.7% Fe/4.8% CeO2/foam | 300 | 98 | 0 | 47 | 91 | 57 |
| 5.7% Fe/4.5% CeO2/foam | 400 | 98 | 9 | 47 | 76 | 56 |
| 6.0% Fe/4.6% CeO2/foam | 450 | 94 | 24 | 49 | 67 | 55 |
| 6.0% Fe/4.6% CeO2/foam | 500 | 93 | 32 | 48 | 59 | 54 |
| 5.8% Fe/4.4% CeO2/foam | 550 | 91 | 40 | 49 | 50 | 53 |
| 5.4% Fe/4.6% CeO2/foam | 600 | 92 | 32 | 51 | 43 | 53 |
A temperature of 300 °C was not sufficient to allow the Water–Gas Shift reaction. In fact, temperature-programmed reduction showed (TPR curves Fig. 8) that the reduction of hematite in magnetite takes place at around 360 °C. The catalyst was not active at 300 °C because this temperature was not sufficient to obtain the active iron phase (magnetite).
An increase in the temperature to 400 or 550 °C led to higher CO conversions and H2 contents. At 550 °C, a CO conversion of 40% and a H2 content of 49% close to the thermodynamic values (CO conversion 50% and H2 content 53%) were obtained. Some differences were observed between these values and those reported in the literature. This can be explained by the use of different operating conditions. The reduction factor (R) permits the evaluation of the reductive nature of reactant gases in WGS reaction and can be calculated as [31]. Kahn et al. [32] defined an optimal R factor of 1.4 to reach a CO conversion of 79% at 550 °C (thermodynamic CO conversion 93%). In this study, the R factor is equal to 1 and is not optimized because of the constraints linked to the gas composition at the gasifier outlet. Even if the goal of this work was not to obtain a better catalyst than those already developed, a comparison with the work by Pereira et al. [33] in comparable conditions (R factor = 1) indicates similar CO conversion at 400 °C.
A temperature of 600 °C was too high and probably led to the deactivation of the catalyst. At this reaction temperature, the H2 content reaches the thermodynamic value.
Finally, the most satisfactory CO conversion was obtained at 550 °C, but at a temperature higher than 450 °C, the hot spots created by the exothermicity of the Water–Gas Shift reaction could damage the catalyst by premature aging. Then, for the following tests, the reaction temperature was fixed at 450 °C.
3.2.3 Influence of the catalyst composition
Table 7 presents the influence of the washcoat content at 450 °C with the H2O/CO ratio of 2 for similar iron contents.
Influence of the washcoat content. Temperature = 450 °C, H2O/CO ratio = 2.
| Catalyst | Carbon balance (%) | CO conversion (%) | H2 content in dry gas (%) | Thermodynamic CO conversion (%) | Thermodynamic H2 content in dry gas (%) | ΔP (mbar) |
| 10.0% Fe/8.6% CeO2/foam | 98 | 21 | 51 | 67 | 55 | 0.05 |
| 10.6% Fe/16.3% CeO2/foam | 95 | 17 | 48 | 67 | 55 | 0.08 |
By increasing the amounts of ceria, CO conversion and H2 content decrease. That can be explained by the fact that the pressure drop increases with an increase in the amount of washcoat. The most satisfactory results were obtained with the catalysts washcoated with 8–9 wt% of cerium oxide.
Table 8 presents the influence of the iron content at 450 °C with the H2O/CO ratio of 2 for similar ceria contents.
Influence of the iron content. Temperature = 450 °C, H2O/CO ratio = 2.
| Catalyst | Carbon balance (%) | CO conversion (%) | H2 content in dry gas (%) | Thermodynamic CO conversion (%) | Thermodynamic H2 content in dry gas (%) | ΔP (mbar) |
| 4.4% Fe/8.4% CeO2/foam | 95 | 23 | 49 | 67 | 55 | 0.04 |
| 10.0% Fe/8.6% CeO2/foam | 98 | 21 | 51 | 67 | 55 | 0.05 |
By increasing the amounts of iron, CO conversion did not increase. That can be explained by the pressure drop increasing with the increase in the catalyst content. Another explanation is linked to the higher reduction temperature (see TPR profiles Figs. 8 and 9) associated with the increase in the amount of iron, leading to less accessibility to iron species. The most satisfactory CO conversion was obtained with the catalysts impregnated with 4.4 to 6.0 wt% of iron, a higher iron content leading to a higher H2 content.
3.2.4 After test characterizations
After test characterizations performed by X-Ray diffraction permitted the determination of the phases present on the catalysts (Fig. 10) and the calculation of the size of the corresponding particles.

(Color online.) X-ray diffraction of (a) fresh catalyst and (b) tested catalyst.
The only iron phase observed was magnetite (JCPDS: 65-3107), which corresponds to the active phase in Water–Gas Shift reaction. The conditions used to perform the reactivity tests led to the reduction of the whole hematite into magnetite, with no over-reduction into FeO or metallic iron. With the reactivity test conditions being as close as possible to the actual conditions at the gasifier outlet, the catalyst's activation would take place in situ.
To compare the size of the particles between a fresh catalyst and a catalyst after the reactivity test (Table 9), a piece of tested catalyst was re-calcined for 4 h at 450 °C to obtain the Fe2O3 phase. A piece of fresh catalyst was also re-calcined under the same conditions to evaluate the influence of this second calcination on the size of the particles.
CeO2 and Fe2O3 particles sizes after re-calcination, compared to a fresh catalyst.
| Catalyst | Conditions | CeO2 particles size (nm) | Fe2O3 particles size (nm) |
| 5.8% Fe/4.7%CeO2/foam | Fresh | 9 | 28 |
| 5.8% Fe/4.7% CeO2/foam | Fresh re-calcined 4 h at 450 °C | 9 | 33 |
| 6.0% Fe/4.6% CeO2/foam | Tested re-calcined 4 h at 450 °C | 15 | 44 |
A small increase in the size of the CeO2 particles (from 9 to 15 nm) and an increase in the size of the Fe2O3 particles (on average from 30 to 45 nm) after the catalytic test were observed and were deemed to be due to the test conditions and not to the re-calcination step.
The size of the magnetite particles can be compared (Table 10) as a function of the different operating parameters (H2O/CO ratio: 0.65 to 2 and temperature: 450 to 600 °C) and preparation parameters (catalyst composition).
CeO2 and Fe3O4 particles sizes as a function of operating and preparation parameters.
| Catalyst | H2O/CO ratio | Temperature (°C) | CeO2 particles size (nm) | Fe3O4 particles size (nm) | Fe/CeO2 wt ratio |
| 5.9% Fe/4.8% CeO2/foam | 0.65 | 450 | 12 | 43 | 1.2 |
| 5.7% Fe/4.7% CeO2/foam | 1.45 | 450 | 15 | 49 | 1.2 |
| 6.0% Fe/4.6% CeO2/foam | 2 | 450 | 15 | 50 | 1.3 |
| 5.4% Fe/4.6% CeO2/foam | 2 | 600 | 15 | 50 | 1.2 |
| 10.6% Fe/16.3% CeO2/foam | 2 | 450 | 15 | 39 | 0.7 |
An increase in the H2O/CO ratio led to a slight increase in the size of the ceria and Fe3O4 particles. The presence of iron carbide (JCPDS: 44-1290) was also observed on the catalyst tested with a H2O/CO ratio = 0.65 that confirms the reason of the slight catalyst deactivation.
Variation of the reaction temperature did not lead to an increase in the size of the CeO2 and Fe3O4 particles.
Otherwise the catalyst composition seems to have an effect on the size of the Fe3O4 particles since the only catalyst having a Fe/CeO2 weight ratio lower than 1 (10.6% Fe/16.3% CeO2/foam) presents the lowest size of the Fe3O4 particles. In fact, a partial integration of iron in the ceria matrix (Table 2) and the highest ceria BET surface area (Table 3) was observed for this catalyst leading to a better iron dispersion and then avoiding iron oxide sintering.
4 Conclusion
The method used for the washcoat and the catalyst deposition allowed the obtaining of a homogeneous deposition of ceria and iron oxide on the foam, with a good adherence for the samples prepared by a single impregnation of the cerium solution and with a concentration of the iron oxide solution lower than 2.1 mol·L−1, respectively. The average particle size of ceria was of 10 nm and the average particle size of iron oxide was of 35 nm. The CeO2 layer led to an increase in the specific surface area of the foam, permitting a good dispersion of the iron phase. It also permitted oxygen storage and the reduction of coke formation during the catalytic tests. The reduction temperature of the catalysts was found to be between 365 °C and 445 °C as a function of the quantity of iron deposited on the foam.
Catalytic tests were performed (1) to study different operating parameters – the H2O/CO ratio (0.65 to 2) and the temperature (300 °C to 600 °C) – and (2) to study the preparation parameter: the catalyst composition i.e. the different amounts of ceria and iron oxide. By adjusting the operating conditions in the range limited by the actual conditions at the gasifier outlet (T ≤ 550 °C, H2O/CO ratio ≤ 2, RT = 0.38 s), it was possible to obtain a CO conversion rate and a H2 content at 550 °C not so far from the thermodynamic values. These values can be improved by a higher residence time.
The use of 45 ppi catalysts allowed us to have a low-pressure drop in the system (0.04 to 0.08 mbar). After-test characterizations showed that the only iron phase is magnetite, which is the active phase in Water–Gas Shift reaction. The catalyst was activated under the aforementioned conditions and no over-reduction was observed. The variation of the different operating parameters did not lead to a variation of ceria or iron oxide particles size. However, the preparation parameter and more especially the Fe/CeO2 ratio permitted the verification of the expected positive role of ceria on iron oxide dispersion.
Acknowledgements
This work was carried out under EC Project (Contract UNIfHY ID 299732–Program PF7–2012/2015). The authors thank the European Commission for its financial support.