

1 Introduction
Methanol is an important basic chemical that is produced industrially from synthesis gas mixtures (CO2/CO/H2) on Cu/ZnO/Al2O3 catalysts. Until the 1980s, research efforts were primarily focused on methanol production from CO/H2. Meanwhile, methanol synthesis from CO2/H2, as a way to reduce anthropogenic greenhouse gas emissions through the valorization of CO2, has been gaining interest in the last decades and is at the centre of ongoing research [1,2].
In principle, three reactions have to be considered in methanol synthesis: hydrogenation of CO2 to methanol (1), hydrogenation of CO to methanol (2) and reverse water–gas shift (RWGS) (3).
| (1) |
| (2) |
| (3) |
However, isotopic labelling experiments established that the carbon source for methanol from CO2-containing feeds on Cu/ZnO/Al2O3 catalysts is predominantly CO2 and not CO, while it still can be questioned to which extent CO produced by RWGS contributes to methanol formation in pure CO2/H2 feeds [3,4]. On the contrary, on a binary ZnO/Al2O3 catalyst, methanol formation was attributed to occur from CO [5].
Although considerable knowledge about methanol synthesis has been accumulated since the beginnings in the first half of the 20th century, some key points of the reaction mechanism on heterogeneous catalysts are still under debate [6]: what are the surface species relevant to the reaction, which surface species are involved in the rate-determining step and how do the active sites look like under reaction conditions [7]? Several surface species have been observed on methanol synthesis catalysts and were integrated into proposed mechanisms in the literature: (hydrogeno)carbonate, formate and methoxy species. Among these, formates are often assumed to be the key intermediate, the hydrogenation of which is considered the rate-limiting step because of their comparatively high stability [8–12]. Generally, the presented pathway is the following: adsorption of the reactants, creation of formates from CO2 and H2, subsequent hydrogenation of formates via dioxomethylene and formaldehyde-type species to methoxy and a last hydrogenation to form the product methanol [13]. From results of DFT calculations, adsorbed formic acid or carboxylic species have also been proposed as possible intermediates [6,14]. Stepped Cu defect sites surrounded by ZnOx, substantiating the idea of the Cu–ZnO interface suggested before in the literature, have been described as a graphic image for the active site [15–17].
Despite the prevalence of Cu/ZnO/Al3O3 catalysts in industrial methanol synthesis and further progress in preparation methods, catalysts with modified supports have emerged as their possible successors [18,19]. The effect of the acid-base properties of the support for activity and selectivity tuning has been highlighted [20]. Zirconia-supported catalysts have been developed and a mechanism proposed, which involves carbon dioxide adsorbed on the support and hydrogen adsorbed on Cu [10,21,22]. Ceria, known for its high CO2 binding capacity in the form of carbonates, has also been used as a support [23–25].
A useful method for catalyst surface characterization is the adsorption of probe molecules observed by IR spectroscopy, as spectra of adsorbed species can give information about their surface chemistry [26]. With respect to the implication of formates in the methanol synthesis mechanism, formic acid should be a suitable probe molecule, as its dissociative adsorption on surfaces leads to surface formates [27].
In this study, different catalysts and the corresponding supports were assessed, using diffuse reflectance Fourier transform infrared spectroscopy (DRIFTS) regarding their reactivity towards formic acid and the evolution of the adsorbed species under thermal treatment. As methanol synthesis and RWGS reaction occur simultaneously on copper-based catalysts, it is important, besides operating conditions, to know more about the mechanisms driving the conversion and selectivity of WGS and methanol-optimized catalysts in order to improve the latter. The comparative experiments were done in order to try to identify the surface properties of an efficient catalyst for methanol synthesis from CO2/H2.
2 Experimental
Gas bottles of hydrogen (99.9999%), helium (99.9999%), carbon dioxide (99.998%) for infrared experiments were purchased from Air Liquide. Formic acid (98%, Sigma–Aldrich) for vapor adsorption was used as received. KBr used for IR background spectra and sample dilution was FT–IR grade (Sigma–Aldrich).
Methanol synthesis catalysts and the corresponding supports were prepared by co-precipitation from nitrate solutions of the respective metals [28]. Industrial water–gas shift catalysts and laboratory-synthesized methanol synthesis catalysts were tested in a fixed-bed reactor without recycle at GHSV 10,000 h−1 (STP) at a 50-bar total pressure, 260 °C and a H2/CO2 ratio of 3.9. The experimental setup is described in [28]. Thermodynamic equilibrium data in the conditions used for these activity tests was calculated with ProSim Plus software.
IR experiments were carried out using a dedicated gas flow setup. Gases were introduced by Brooks SLA 5850S mass flow controllers connected by 1/8′′ stainless steel tubing to the in situ DRIFTS cell. The Harrick high-temperature DRIFTS chamber, equipped with a high-pressure dome fitted with ZnSe windows, was located inside Harrick's Praying Mantis DRIFTS optics in the sample compartment of a Bruker Vertex 70 FTIR spectrometer. The cell outlet was connected to a Pfeiffer ThermoStar mass spectrometer for gas-phase observation. Infrared spectra were taken at a resolution of 4 cm−1 and 64 scans using a DTGS room temperature detector during reduction and using a liquid-nitrogen-cooled MCT detector for a better signal/noise ratio during adsorption/desorption experiments. The intensity scale used to display the spectra is absorbance-like, i.e. log10(1/R) = log10(I0/I) is used on the vertical axis, R being defined as the sample reflectance, I0 the intensity measured with the catalyst in reference state, I the intensity measured during adsorption/reaction. This scale was chosen as it gives a more linear representation of adsorbate bands in a highly absorbing matrix than the Kubelka–Munk function [29,30]. Although the experiments were performed in reflectance mode, the term absorbance will be used for the intensity scale throughout this paper for reasons of brevity.
For each experiment, about 160 mg of diluted sample (10% by weight in KBr) were loaded into the DRIFTS cell as a finely ground powder. The sample was reduced under an H2 flow (6 mL·min−1) at 280 °C (ramp 1 °C·min−1, isotherm 12 h), then flushed with He (3 mL·min−1) and cooled down to 100 °C. At this temperature, the adsorption of the probe molecule was carried out. Formic acid vapor was introduced by making a He flow bubble through a saturator at room temperature. Adsorption was stopped when no more change in the IR spectra was observed (after 20 min). The cell was purged under a He flow for at least 1 h. Then, temperature-programmed desorption under an He flow (3 mL·min−1) was initiated by a heating ramp of 5 °C min−1 up to 400 °C.
3 Results
3.1 Selection of samples for adsorption experiments
Before the IR experiments, different catalysts were screened for their catalytic behavior in methanol synthesis from CO2/H2 feed. They were tested in a fixed-bed reactor without recycle at GHSV 10,000 h−1 (STP) at 50 bar total pressure and a H2/CO2 ratio of 3.9. Comparison of their performance was made at a common reaction temperature of 260 °C (Table 1). Thermodynamic conversions and selectivities with respect to CO2 are also included in Table 1 for comparison. A laboratory-synthesized catalyst (CuZA) of classical composition Cu/ZnO/Al2O3 with high CO2 conversion (16%) and good selectivity for methanol synthesis (42%) was chosen and compared to two industrial water–gas shift catalysts: catalyst A with high conversion (12%) but low methanol selectivity (25%), and catalyst B with low conversion (3%), but high methanol selectivity (87%). Furthermore, two laboratory-synthesized catalysts with modified supports were included: Cu/ZnO/CeO2 catalyst (CuZC) showing moderate CO2 conversion (7%) and good methanol selectivity (46%), and a Cu/ZnO/ZrO2 catalyst (CuZZ) with lower methanol selectivity (35%), but better CO2 conversion (17%). Experimental conversions obtained are far from equilibrium conversions, even at the highest values for CO2 with CuZZ (56% of equilibrium conversion) and for H2 with CuZA (39% of equilibrium conversion). The corresponding supports ZnO/Al2O3 (ZA), ZnO/CeO2 (ZC) and ZnO/ZrO2 (ZZ) were analyzed in IR experiments, too.
Catalytic properties of the examined catalysts at 260 °C reaction temperature, 50 bar total pressure, H2/CO2 ratio of 3.9, GHSV 10,000 h−1.
| Catalyst code | Cu content (wt%) | Composition | Conversion (%) | C selectivity (%) | Methanol productivity (gMeOH·kgcata−1·h−1) | ||
| H2 | CO2 | MeOH | CO | ||||
| A | 12–16 | – | 4 | 12 | 25 | 75 | 63 |
| B | 37–47 | – | 3 | 3 | 87 | 13 | 66 |
| CuZA | 30 | Cu/ZnO/Al2O3 | 7 | 16 | 42 | 58 | 277 |
| CuZC | 30 | Cu/ZnO/CeO2 | 3 | 7 | 46 | 54 | 143 |
| CuZZ | 30 | Cu/ZnO/ZrO2 | 6 | 17 | 35 | 65 | 260 |
| thermodynamic equilibrium | – | – | 18 | 31 | 64 | 36 | – |
3.2 Reduced samples
The same experimental procedure was applied to all catalysts and supports to enable comparison. Samples were diluted in KBr to enable detection of the IR signal on the reduced catalysts, as it was strongly attenuated by absorption originating from electrons in the conduction band of ZnO and likely due to the presence of Cu0 [31,32]. The reduction temperature was fixed at 280 °C according to preliminary temperature-programmed reduction experiments (not shown) to ensure CuO reduction.
The spectra of the reduced samples in the He flow after cooling to 100 °C are shown in Fig. 1. Broad hydroxyl absorption bands can be seen around 3500 cm−1 on A, ZA, ZZ and ZC. Some residual bulk carbonates remain, which have not been decomposed during the reduction step. They appear as weak broad features around 1530–1540 cm−1, 1420 cm−1 and 1330 cm−1 on classical catalysts and ZA support [33]. On ZZ support and CuZZ catalyst, carbonates are evidenced by bands around 1540–1550 and 1380–1410 cm−1. On ZC support and CuZC catalyst, bands around 1530–1540/1570 cm−1, 1340-60 cm−1 and 856–859 cm−1 are identified as carbonates [34]. Additionally, the very sharp band of the nitrate ion is observed at 1383 cm−1 (marked with an asterisk in Fig. 1). Nitrates may be left over from synthesis by co-precipitation from metal nitrate solution and were only observed on ceria-containing samples [35].

DRIFTS spectra of the reduced samples under a He flow at 100 °C. (a) A, (b) B, (c) CuZA, (d) ZA support, (e) CuZZ, (f) ZZ support, (g) CuZC, (h) ZC support. The band marked with an asterisk (*) corresponds to 1383 cm−1 (nitrate). The unusually strong CO2 band in spectrum b is caused by a change of the atmosphere in the beam path of the spectrometer during the experiment.
3.3 Formic acid adsorption
An adsorption temperature of 100 °C was chosen because it is situated above the desorption temperature of physisorbed formic acid, but lower than the decomposition temperature of chemisorbed formate species [36]. The catalyst surface was saturated with formic acid during adsorption and a subsequent He purge for at least 1 h allowed for removal of gas-phase formic acid and equilibration of the surface species. The precise determination of the band positions of adsorbed species, however, was complicated by band broadening and overlapping in the fingerprint region of carbonates and formates, so tentative assignments will be made. Band positions were determined both by direct picking of the maxima and by using the second derivative of the spectrum in case of shouldering.
3.3.1 Blank experiment with KBr
A blank experiment using only KBr was performed to check that no significant adsorption bands are caused by KBr dilution (Fig. 2). The spectrum obtained after formic acid adsorption and purge following the same experimental procedure and the same spectral treatment as for the “real” samples is shown in Fig. 2b. The spectrum observed during formic acid adsorption with formic acid vapor in the gas phase is depicted in Fig. 2a. In comparison to this spectrum, the intensity observed with KBr in Fig. 2b is very low and the baseline almost flat. Only by magnifying the spectrum 10 times on the absorbance scale, some bands can be discerned (Fig. 2c). Some residual formic acid vapor is detected at 1790, 1775, 1119, 1107, 1093 cm−1. Some adsorbed water is present, as indicated by the band at 1630 cm−1 [37,38]. The bands at 1714, 1698, 1600, 1322 cm−1 do not correspond to any band usually observed from formic acid vapor (Fig. 2a) nor potassium formate that could be formed upon reaction with KBr [39,40]. They may originate from condensed formic acid on KBr. A hydrocarbon impurity (2919, 2850 cm−1), present also in the absence of formic acid, and a nitrate impurity (sharp band at 1383 cm−1) are observed. To summarize, there are inevitably some minor contributions due to the presence of KBr, which are largely overwhelmed by bands from the samples themselves, as can be seen from Figs. 3 and 4.
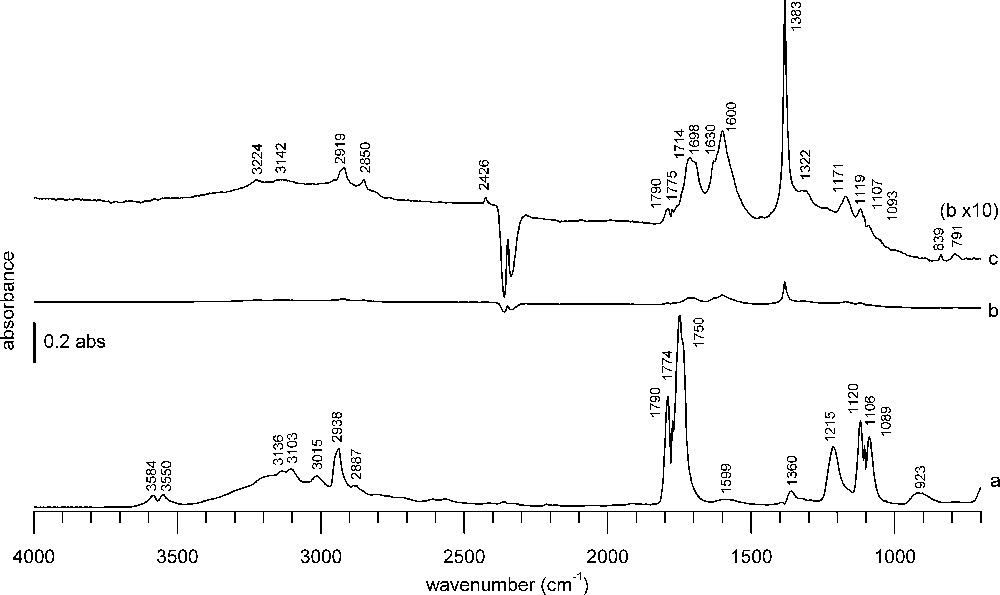
DRIFTS KBr blank spectra (a) during formic acid adsorption, (b) 1 h after formic acid adsorption and purge under He flow, (c) spectrum b with 10 times magnified absorbance scale.
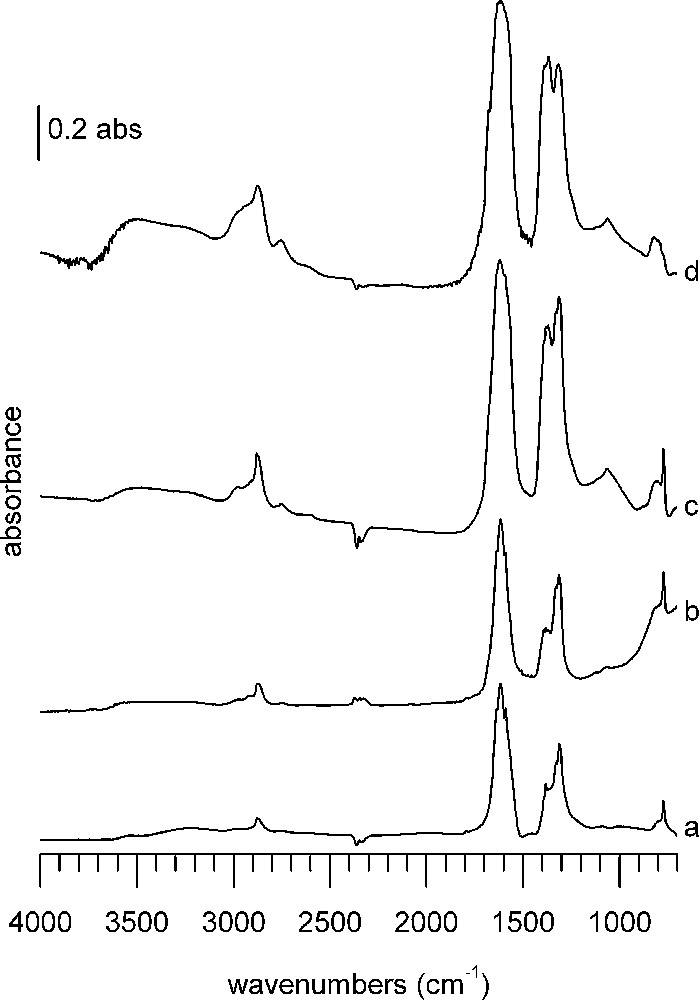
DRIFTS spectra 1 h after formic acid adsorption at 100 °C on (a) A catalyst, (b) B catalyst, (c) CuZA catalyst, (d) ZA support. In each case, the spectrum of the reduced sample has been subtracted.
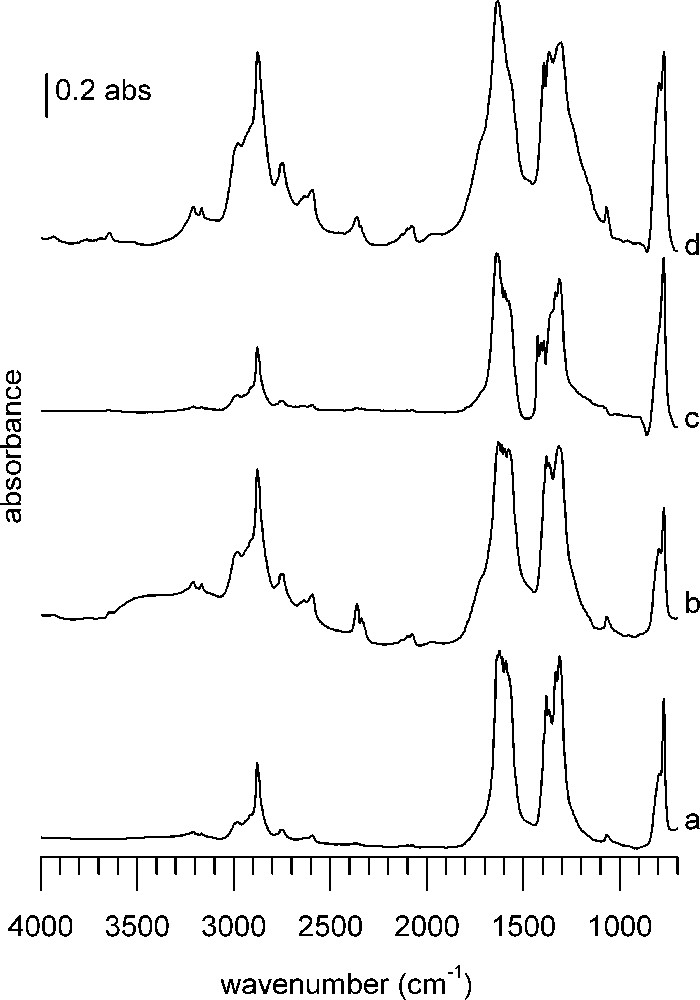
DRIFTS spectra 1 h after formic acid adsorption at 100 °C on (a) CuZZ catalyst, (b) ZZ support, (c) CuZC catalyst, (d) ZC support. In each case, the spectrum of the reduced sample has been subtracted.
3.3.2 Classical catalysts
The first sample group consists of WGS catalysts A and B as well as CuZA methanol synthesis catalyst and ZA support (Fig. 3). Without even knowing about their catalytic behavior, already by inspection of the infrared spectra, the four samples can be divided into two groups: water–gas shift catalysts A and B (Fig. 3a and b) and CuZA catalyst/ZA support (Fig. 3c and d). The bands observed on WGS catalysts are lower in intensity and differently distributed than those of CuZA catalyst and ZA support (Table 2).
IR absorption bands of adsorbed species at 100 °C.
| Sample | ν(O–H) | ν(C–H) | ν(CO) | δ(C–H), μ(CO) | ν(C–O) | δ(OCO) | ||||||||||
| A | 2980 | vw | 1636 | vs | 1382 | s | n.d. | ≈800 | vw | 772 | ms | |||||
| 2916 | sh | 1617 | vs | 1330 | vs | |||||||||||
| 2878 | w | 1588 | vs | 1312 | vs | |||||||||||
| 2866 | w | 1565 | sh | |||||||||||||
| 2745 | vw | |||||||||||||||
| B | 2967 | vw | 1636 | vs | 1394 | s | 1068 | vw | ≈821 | vw | 772 | ms | ||||
| 2918 | sh | 1617 | vs | 1382 | s | ≈800 | vw | |||||||||
| 2877 | w | 1590 | vs | 1371 | s | |||||||||||
| 2868 | w | 1330 | vs | |||||||||||||
| 2748 | vw | 1314 | vs | |||||||||||||
| CuZA catalyst | (3000) | br | 1680 | br | 1398 | sh | 1066 | w | ≈811 | w | 772 | ms | ||||
| 2980 | w | 1641 | sh | 1380 | vs | ≈803 | w | |||||||||
| (2940) | br | 1621 | vs | 1370 | vs | |||||||||||
| 2916 | sh | 1590 | vs | 1330 | vs | |||||||||||
| 2879 | ms | 1564 | sh | 1314 | vs | |||||||||||
| 2866 | sh | 1303 | sh | |||||||||||||
| 2755 | w | |||||||||||||||
| 2744 | w | |||||||||||||||
| ZA support | 2994 | br | 1682 | sh | 1390 | vs | 1063 | w | ≈823 | w | n.d. | |||||
| 2944 | br | 1640 | vs | 1368 | vs | ≈800 | w | |||||||||
| 2874 | w | (1621) | vs | 1316 | vs | |||||||||||
| 2754 | vw | (1613) | vs | |||||||||||||
| 1566 | sh | |||||||||||||||
| ZZ support | 3209 | w | 2983 | ms | 2130 | w | (1644) | sh | (1395) | sh | 1070 | w | 797 | ms | 772 | s |
| 3166 | w | (2940) | sh | 2100 | w | 1630 | vs | 1381 | vs | |||||||
| (2915) | sh | 2076 | w | 1611 | vs | 1366 | vs | |||||||||
| 2879 | s | ≈1970 | br | 1597 | vs | 1318 | vs | |||||||||
| (2778) | sh | 1575 | vs | (1300) | sh | |||||||||||
| 2757 | w | (1560) | sh | |||||||||||||
| 2746 | w | |||||||||||||||
| (2656) | sh | |||||||||||||||
| 2635 | w | |||||||||||||||
| 2592 | w | |||||||||||||||
| CuZZ catalyst | 3210 | vw | 2981 | w | (2129) | vw | 1639 | vs | 1396 | s | 1070 | w | 796 | ms | 772 | s |
| 3167 | vw | (2938) | sh | 2100 | vw | 1623 | vs | 1381 | s | |||||||
| (2914) | sh | 2075 | vw | 1610 | vs | 1366 | s | |||||||||
| 2879 | ms | 1590 | vs | 1332 | vs | |||||||||||
| (2779) | sh | (1560) | sh | 1313 | vs | |||||||||||
| 2758 | w | 1303 | sh | |||||||||||||
| 2746 | w | |||||||||||||||
| (2656) | sh | |||||||||||||||
| 2635 | w | |||||||||||||||
| 2592 | w | |||||||||||||||
| ZC support | 3209 | w | 2977 | ms | 2129 | w | 1645 | vs | 1393 | vs | 1070 | w | 796 | vs | 771 | vs |
| 3166 | w | (2937) | sh | 2100 | w | 1626 | sh | 1366 | vs | 1063 | sh | |||||
| (2914) | sh | 2076 | w | 1611 | sh | 1321 | sh | |||||||||
| 2878 | s | ≈1969 | w | 1596 | sh | 1304 | vs | |||||||||
| 2747 | w | 1555 | sh | |||||||||||||
| (2656) | sh | 1534 | sh | |||||||||||||
| 2634 | w | |||||||||||||||
| 2593 | w | |||||||||||||||
| CuZC catalyst | 3208 | vw | 2980 | w | 2102 | vw | 1643 | vs | 1426 | s | n.d. | ≈800 | sh | 773 | vs | |
| 3165 | vw | (2945) | sh | 2075 | vw | 1625 | sh | 1409 | s | |||||||
| (2914) | sh | 1610 | vs | 1394 | s | |||||||||||
| 2879 | ms | 1595 | vs | (1377) | sh | |||||||||||
| 2778 | vw | 1575 | vs | 1365–55 | sh | |||||||||||
| 2757 | w | 1559 | sh | 1334 | vs | |||||||||||
| 2747 | w | 1314 | vs | |||||||||||||
| 2592 | w | 1304 | sh |
Most bands are located in the C–H stretching (3000–2800 cm−1) and CO stretching (1700–1200 cm−1) regions. Very strong bands appear in the CO stretching region. On WGS catalysts, the most prominent bands are at 1617 and 1314 cm−1. Both catalysts have more features at 1636 and 1590 cm−1, as well as at 1382 and 1330 cm−1. Additional sharp bands are found on B at 1394 and 1371 cm−1. Bands in the C–H stretching region of WGS catalysts are weaker than on methanol synthesis catalysts. The main band in this region on both WGS catalysts is a double band located at 2878 and 2866 cm−1, accompanied by weaker absorptions around 2745 and 2980 cm−1. Both catalysts have a band at 772 cm−1, but only on B a band at 1068 cm−1 is detected.
The band shapes of ZA support and CuZA catalyst are less sharp than those of the WGS catalysts and bands on ZA support are generally broader than on CuZA catalyst. Some of the previously mentioned bands are found again, so only differences will be pointed out.
ZA support and CuZA catalyst show C–H stretching bands around 3000 cm−1 and 2755 cm−1 in addition to the bands described earlier. In the CO stretching range, they have an additional broad shoulder at 1680 cm−1, whereas only on ZA support the band at 1590 cm−1 is missing. The 1400–1300-cm−1 band massive of the CuZA catalyst is topped by small sharp features at 1380, 1370, 1330, 1314 cm−1 framed by broad shoulders at 1398 and 1303 cm−1, whereas on ZA support only three bands can be discerned (1390, 1368, 1316 cm−1). C–O stretching is found at 1063 cm−1 on the ZA support and at 1066 cm−1 on the CuZA catalyst. The band at 772 cm−1 is not detected on the ZA support.
The bands around 2875 cm−1 can be assigned to C–H stretching, those at 2980 and 2740 to combination bands of the asymmetric/symmetric O–C–O stretching and C–H bending of formate [41]. The bands around 1570, 1380 and 1370 cm−1 are assigned respectively to asymmetric O–C–O stretching, C–H bending, and symmetric O–C–O stretching modes of formates on the support (ZnO) [42–44]. Another type of formate is associated with the bands at around 1640 and 1320–1314 cm−1 [33]. The band at 772 cm−1 corresponds to the O–C–O deformation of the formate ion [39,40].
The band found around 1066–1062 cm−1 is close to the C–O stretch of methoxy species that were identified on ZnO of an Au/ZnO catalyst [43]. The assignment of methoxy species is not unambiguous, as other values given for methoxy on ZnO are 1080 cm−1, or 1076 cm−1 with shoulders at 1058 and 1040 cm−1 indicating the presence of different methoxy species, whereas methoxy species on ZnAl2O4 were observed around 1095 cm−1 [33,45]. Additional evidence may be obtained from a broad band around 2600 cm−1, which is present on ZA and CuZA. It has been identified as a combination band from the methyl rock and deformation modes of adsorbed methoxy species on alumina [46]. The asymmetric C–H stretch at 2940 cm−1 is difficult to observe, but can be noticed as a shoulder on ZA and CuZA. The symmetric 2820 cm−1 stretch is not observed directly and is likely to be masked by strong formate C–H absorption. On the other hand, Cu methoxy species would be expected to show C–H bands at 2901, 2861, 2787 cm−1 and a C–O band at a wavenumber as low as 990 cm−1; they have not been observed on our samples after adsorption [33]. Furthermore, because of close resemblance between the spectrum of CuZA catalyst and the ZA support, it is concluded that formic acid adsorption takes place preferentially on the support.
The presence of carbonate signals in the clump of bands cannot be excluded, but due to the number of other bands present, assignment would be doubtful. No hydrogenocarbonates are observed, as the characteristic sharp δ(O–H) band around 1200 cm−1 is absent [47].
3.3.3 Catalysts with modified supports
Samples containing ZrO2 or CeO2 show more bands with stronger intensity and sharper silhouette than the classical catalysts and supports (Fig. 4). Especially the bands in the C–H region are more pronounced compared to the bands in the CO fingerprint region than on the classical catalysts. Although quantitative information of DRIFT spectra is limited and interpretation has to be done with care, a strong band intensity may indicate stronger adsorption of the probe molecule, whereas the band shape suggests better-defined adsorption sites than on classical samples.
Within this group, supports ZZ (Fig. 4b) and ZC (Fig. 4d) show stronger and more numerous bands than the corresponding catalysts containing copper, CuZZ (Fig. 4a), and CuZC (Fig. 4c). This indicates enhanced reactivity thanks to the presence of copper, which has induced a transformation of the adsorbed species. Although the spectra globally look quite similar, they differ in intensity and in details upon close inspection.
Common to all modified supports and catalysts are two small bands above 3000 cm−1, located at 3210 and 3166 cm−1, which are more or less pronounced depending on the sample. In the C–H stretching region, bands found on the first four samples are present again. Additional bands are found around 2779 and 2757 cm−1, as well as at 2656, 2634 and 2592 cm−1. A notable difference with the classical supports/catalysts is a set of bands around 2100 cm−1 (2130, 2100, 2076 cm−1), again more or less visible depending on the sample. Only on CuZZ and CuZC catalysts a broad absorption around 1970 cm−1 is detected. The majority of absorptions in the band massive of the C = O stretching region (1700–1200 cm−1) of classical samples are also present on the modified catalysts. However, as already said, there are visible differences concerning band shape, intensity and position. An additional band at 1575 cm−1 is found on ZZ support and CuZC, whereas only on CuZC additional sharp bands at 1426 and 1409 cm−1 are visible. As it was the case before, the bands at 1590, 1381 and 1332 cm−1 are only found on copper-containing samples. All samples, except CuZC, feature a weak band at 1070 cm−1, with a small shoulder at 1063 cm−1 on the ZC support. A strong to very strong, sharp absorption band at 772 cm−1 is present on all samples, shouldered by a poorly separated broad band around 800 cm−1.
In the spectra of all four samples of Fig. 4, the sharp band at 772 cm−1 (previously assigned to the O–C–O deformation of formate) is found again, with a shoulder at 797 cm−1. A common feature, except for CuZC (Fig. 4c), is also the band at 1070 cm−1. In the case of ZrO2-containing samples, this band has been assigned to the C–O stretching mode of methoxy species on Zr4+ [48]. A shoulder at 1063 cm−1 can be distinguished, corresponding to methoxy on ZnO, as described before. The band at 2359 cm−1 originates from adsorbed CO2 [49]. In the region above 3000 cm−1, two sharp bands at 3209 and 3166 cm−1 are remarkable. Edwards et al. observed a band at 3250 cm−1 on CuO/ZnO catalysts and assigned it to the O–H stretch [42]. The rather well-defined band shape would suggest that there is no hydrogen bonding, therefore they can be characterized as isolated hydroxyl groups.
The band onsets are broadened by additional shoulders, but it is difficult to assign precise wavenumbers to these unresolved features. Shoulders are located around 1720 and 1230 cm−1 on ZZ support, 1710 and 1240 cm−1 on ZC support and may be explained by the formation of organic-like carbonates [50].
The bands at 2879, 1577, 1394, 1366 cm−1 are assigned, as before, to the corresponding formate bands on ZnO. The remaining bands are more difficult to assign. Based on the sharp band outline and the proximity of the wavenumbers, it is reasonable to assume that there are formates present on several adsorption sites with enough differences in their surroundings to give rise to shifted bands. The bands at 1555 and 1300 cm−1 were assigned to bidentate carbonates on ZrO2, maybe with some small contribution to the 1063 cm−1 band [50].
The origin of the bands between 2170 and 2070 cm−1 is unclear. In the wavenumber region around 2100 cm−1, usually adsorbed CO on reduced metals is found. But as these bands are present also on the non-Cu-containing samples, they cannot signify CO adsorption on this metal, which would cause bands between 2115 and 2060 cm−1 for the molecule bound linearly to the surface [51,52]. They could correspond to a C–O stretch overtone of methoxy species [53].
3.4 Thermal desorption
After adsorption of formic acid, samples were purged at 100 °C under flowing He until disappearance of the characteristic bands of molecular gas phase formic acid. Subsequently, they were heated under a He flow from 100 °C up to 400 °C with a ramp of 5 °C min−1. The IR spectra of the classical catalysts are presented in Fig. 5, those of the modified catalysts in Fig. 6.
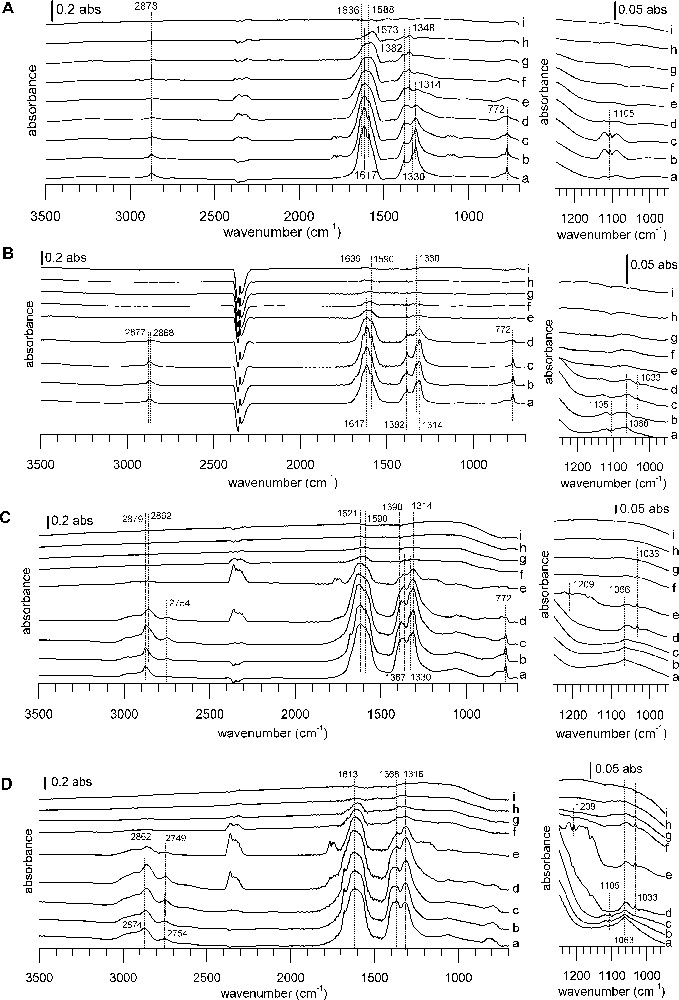
DRIFTS spectra of TPD from 100 to 400 °C under a He flow after formic acid adsorption. Samples: (A) A catalyst, (B) B catalyst, (C) CuZA catalyst, (D) ZA support. Temperatures: (a) 100 °C, (b) 150 °C, (c) 200 °C, (d) 225 °C, (e) 250 °C, (f) 275 °C, (g) 300 °C, (h) 350 °C, (i) 400 °C. The right-hand side of the figure shows a zoom into the 1250–900 °cm−1 region of the full spectrum on the left. In each case, the spectrum of the reduced sample has been subtracted.
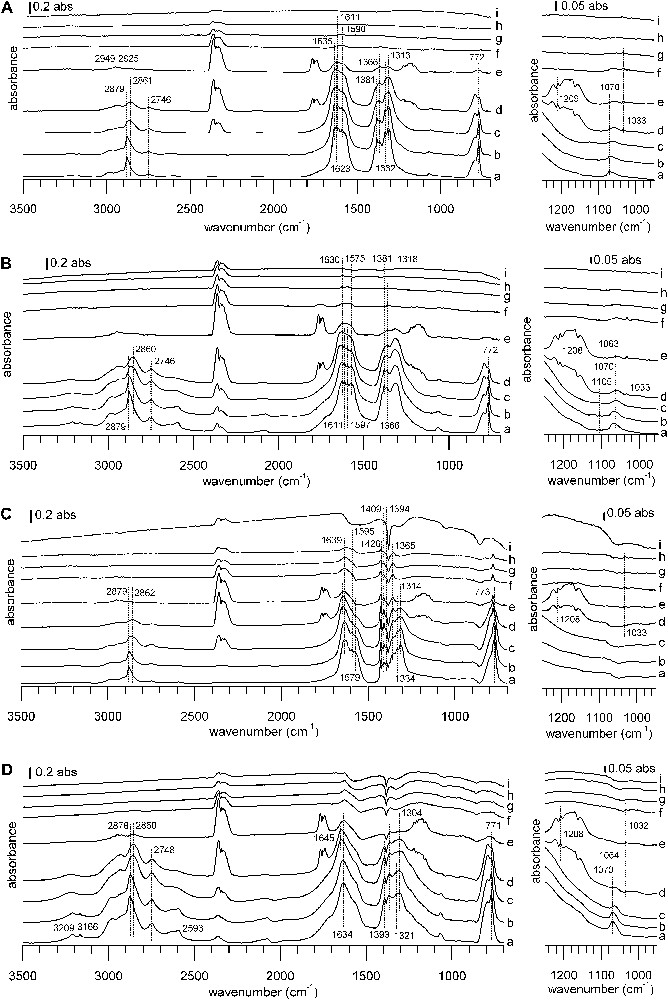
DRIFTS spectra of TPD from 100 to 400 °C under a He flow after formic acid adsorption. Samples: (A) CuZZ catalyst, (B) ZZ support, (C) CuZZ catalyst, (D) ZC support. Temperatures: (a) 100 °C, (b) 150 °C, (c) 200 °C, (d) 225 °C, (e) 250 °C, (f) 275 °C, (g) 300 °C, (h) 350 °C, (i) 400 °C. The right-hand side of the figure shows a zoom into the 1250–900 °cm−1 region of the full spectrum on the left. In each case, the spectrum of the reduced sample has been subtracted.
Observed gaseous desorption products have been identified even in small quantities by IR using characteristic wavenumbers of their strongest bands: methanol (1059, 1033, 1009 cm−1), carbon monoxide (P and R branches around center frequency of 2145 cm−1), carbon dioxide (2360, 2345 cm−1), formic acid (1790, 1775, 1752, 1119, 1105, 1089 cm−1) and methyl formate (1768, 1753, 1742, 1221, 1209, 1193, 1184, 1171, 1156 cm−1) [27,54,55]. Desorption temperatures taken from the IR spectra are tabulated for different products in Table 3.
Desorbed species and desorption temperatures as extracted from IR data.
| Desorption temperature (°C) | ||||||||||||
| Formic acid | Methanol | Methyl formate | CO2 | |||||||||
| Sample | From | Max. | Until | From | Max. | Until | From | Max. | Until | From | Max. | Until |
| A | 100 | 180 | 210 | n.d. | n.d. | 140 | 230 | 320 | ||||
| B | 100 | 130 | 190 | 190 | 220 | 240 | n.d. | 150 | 240 | 300 | ||
| ZA | 100 | 125/200 | 210 | 210 | 240 | 320 | 220 | 240 | 280 | 190 | 240 | 300 |
| CuZA | 150 | 200 | 220 | 210 | 230 | 280 | 220 | 240 | 270 | 170 | 250 | 300 |
| ZZ | 120 | 170 | 200 | 210 | 270 | 310 | 200 | 240 | 280 | 170 | 245 | 300 |
| CuZZ | 100 | 160–200 | 205 | 210 | 260 | 290 | 205 | 240 | 280 | 160 | 240 | 330 |
| ZC | n.d. | 220 | 250–270 | 280 | 200 | 240 | 280 | 160 | 240 | 310 | ||
| CuZC | n.d. | 220 | (broad) | 280 | 215 | 240 | 280 | 160 | 240 | 300 |
While there are differences in detail, the IR spectra series during the thermal desorption ramp resemble each other, with one notable exception: the behavior of WGS catalyst A during the heating ramp is markedly different from that of all other catalysts. For catalyst A, thermal desorption begins at a temperature just above 100 °C, but the bands of adsorbed species decrease only slowly (Fig. 5A). For the other samples, bands of adsorbed species are stable until some critical temperature and then disappear in a narrow temperature range (Figs. 5B–D and Fig. 6).
On WGS catalyst A, the only thermal desorption products observed by IR are formic acid first, and then CO2 and some CO. During the heating ramp, bands of the initially formed formates decrease and a band shift occurs, indicating the intermediate formation of copper formate (1566, 1380, 1352 cm−1) [56,57]. WGS catalyst B shows only weak desorption signals. First, some formic acid desorbs, later followed by CO2, CO and methanol desorption. On ZA support and CuZA catalyst, formate species remain virtually unchanged during the apparition of formic acid. Subsequently, there is CO2, methyl formate and methanol evolution. CO2 evolution reaches its maximum when the disappearance rate of formates is the highest and this coincides with the simultaneous evolution of methanol, methyl formate and CO. Finally, all surface and gas bands decrease, letting behind a free surface. It should be pointed out that no methyl formate has been detected during TPD on WGS catalysts A and B.
On ZZ and ZC supports, the decomposition of formates leads to nearly simultaneous evolutions of CO2 and methyl formate, whereas methanol desorbs at a slightly higher temperature. A similar behavior is observed on the Cu-containing catalysts, with ongoing CO evolution at higher temperatures. No formic acid desorption is observed on ZC and CuZC. In the case of CuZC, methanol and carbon monoxide are barely detected, due to bad signal/noise ratio and a highly changing baseline during the ramp. More pronounced than for the zirconia-containing samples, negative bands of carbonates appear at the end of the heating ramp near 400 °C for ceria-containing samples, indicating the decomposition of bulk carbonates that have not been eliminated during the pre-treatment at 280 °C. Peak desorption temperatures from IR experiments lie in a narrow range around 240 °C for methyl formate and CO2, whereas the peak maximum is shifted to higher temperature on zirconia and ceria-containing samples.
The evolution of the gas phase followed by mass spectrometry (MS) is shown in Fig. 7. MS allowed mainly the gases CO2 (m/z 44) and CO (m/z 28) to be detected, as well as H2 (m/z 2), which cannot be detected by IR. Note that the peak temperatures observed by MS are not identical to those observed by IR: as the IR beam detects at the inlet of the catalytic bed, whereas MS sees reaction products at the cell outlet and is connected to it via some additional tubing, this difference is to be expected. Fig. 7 highlights the difference between WGS catalyst A (Fig. 7a) and the other samples (Fig. 7b–h). For catalyst A, the mass spectra show one main peak indicating the decomposition of surface formates by simultaneous evolution of CO2 (m/z 44 and 28) and H2 (m/z 2). Peak temperature for m/z 28 does not exactly coincide with m/z 44 peak temperature; it is slightly shifted to a higher temperature, indicating the contribution of CO to the m/z 28 signal. The lowest peak decomposition temperature of 230 °C is observed on WGS catalyst B (Fig. 7b), whereas on WGS catalyst A the peak decomposition temperature is 245 °C, but with a larger peak width (Fig. 7a). Higher peak decomposition temperatures are observed on the classical methanol synthesis catalyst CuZA (250 °C, Fig. 7c) and ZA support (255 °C, Fig. 7d), the presence of Cu slightly lowering the decomposition temperature. The highest thermal stability of formates is observed with zirconia- and ceria-supported samples. The peak decomposition temperature lies around 265–270 °C for all samples (Fig. 7e–h). The surface formate peak decomposition temperatures given in the literature are 230 °C for Al2O3, 246 °C for ZrO2, 261 °C for ZnO and 280 °C for CeO2 [36]. In comparison with this data, our values for the laboratory-synthesized catalysts lie near to the decomposition temperature on ZnO, with only small influence of the other oxides on the decomposition temperature.
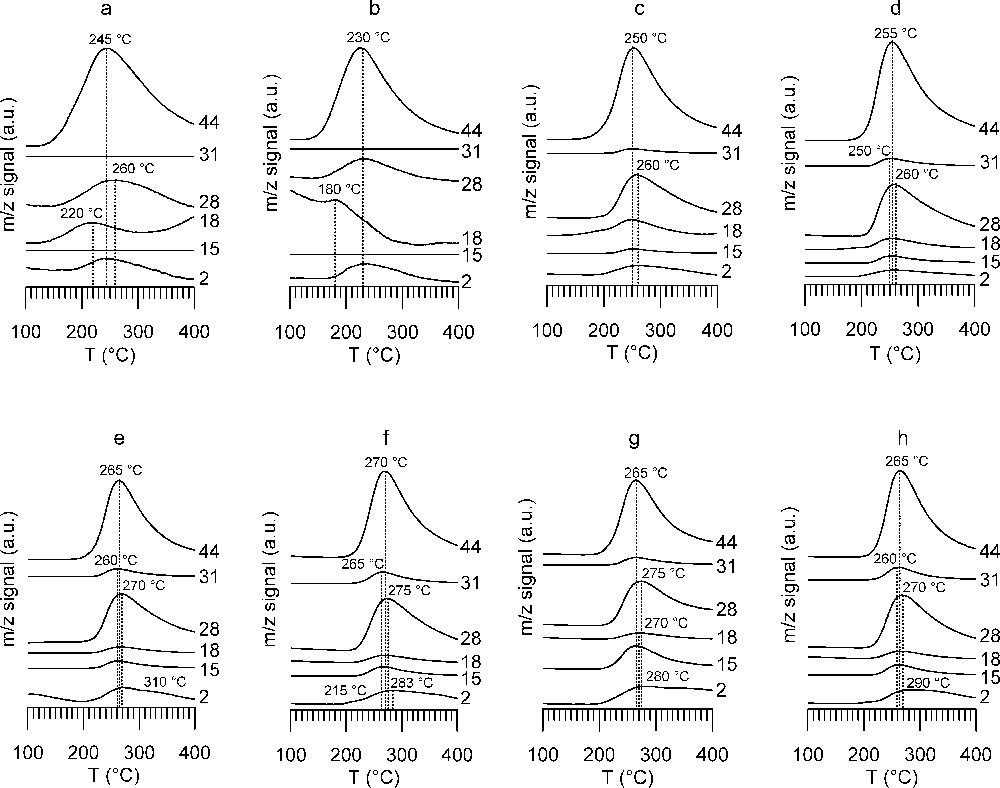
Mass spectrum traces of TPD from 100 to 400 °C under He flow after formic acid adsorption (a) A catalyst, (b) B catalyst, (c) CuZA catalyst, (d) ZA support, (e) CuZZ catalyst, (f) ZZ support, (g) CuZZ support, (h) ZC support. Followed m/z ratios and main contributions to the signal are: 2 hydrogen, 15 methyl group, 18 water, 28 carbon monoxide, 31 methanol, 44 carbon dioxide.
4 Discussion
Better catalytic productivity with catalysts optimized specifically for methanol synthesis from CO2/H2 feeds follows from an understanding of the reactivity of the surface species. There is an ongoing debate in the literature about the relevance of adsorption experiments to the mechanism during reaction conditions and whether observed species are intermediates or only spectator species. Real intermediates are hard to detect, because they will be consumed continuously during the reaction and the number of actual active centres may be small [58]. On the other hand, species that are present on a variety of surface sites can be located in regions of different reactivity depending on their distance to the active centres. The species located close to these centres can be transformed into active species [34,59]. Formates have been suggested by many authors to be important surface species during the reaction. For methanol synthesis under industrial conditions (50 bar total pressure), a surface formate coverage as high as 7% was calculated using a microkinetic model [60]. Surface formates were observed to convert to methanol and with methoxy species to methyl formate on ZnO and ZrO2 in the presence of hydrogen after CO2 adsorption [10,59]. ZnO is known to be active for methanol synthesis, since the first commercial catalysts were based on ZnO/Cr2O3, without copper [61].
We cannot provide from our experiments a direct proof that the species here observed are the true reaction intermediates for methanol synthesis; we rather attempt to relate the observations made during adsorption/desorption experiments to the performance of the tested catalysts. The purpose of our experiments is to serve as a characterization tool for the samples related to this discussion to reveal the differences observed between the samples with different catalytic activity after adsorption of formic acid and further during the desorption ramp.
Based on the adsorption/desorption experiments, an explanation is proposed for the observations made in this study. Upon adsorption of formic acid on the samples at 100 °C, surface formates are formed, as expected from equations (4) for metal and (5) for metal oxide surfaces, respectively [27,62].
| HCOOH + 2* → HCOO* + H* | (4) |
| HCOOH + * + O* → HCOO* + H–O* | (5) |
However, depending on the nature of the sample, further reactions occur already during equilibration of the surface under purge. Part of the formates recombine with adsorbed hydrogen to release carbon dioxide and hydrogen gas, both during formic acid adsorption and during heating (6). They can also decompose on a second pathway, releasing CO and leaving an oxygen atom on the surface (7). Depending on the catalyst composition, formates are transformed into methoxy species at a different temperature (8); the latter are subsequently hydrogenated into methanol (9). As the samples are heated under a He flow, the hydrogen consumed for hydrogenation is supplied from the adsorption of formic acid. Hence, there is not enough hydrogen available to convert all formate into methoxy species. Since formate and methoxy species are present on the surface at the same time during the temperature ramp, the mixed product methyl formate is obtained, too (10):
| HCOO* + H* → CO2 + H2 + 2* | (6) |
| HCOO* + H* → CO + H2 + O* + * | (7) |
| HCOO* + 2H* → H3CO* + 2* | (8) |
| H3CO* + H* → H3COH + 2* | (9) |
| HCOO* + H3CO* → HCOOCH3 + O* + * | (10) |
The WGS catalysts show few methoxy species at 100 °C and most of the methanol production occurs below 200 °C. This temperature is lower than the typical temperature of methanol synthesis (200–260 °C). The stability of the methoxy species as the immediate precursor of methanol on these catalysts seems to be too low to produce significant amounts of methanol at the typical reaction temperature, when the kinetics would be fast enough for this reaction. So, formates decompose before they can be converted into methoxy species [reactions (6) and (7)].
The better performance of methanol-synthesis catalyst CuZA compared to the WGS catalysts can be rationalized by a higher stability of methoxy species generated from formates on this type of catalyst. This leads to the simultaneous presence of formate and methoxy species in the interesting temperature range and to the mixed reaction product methyl formate. Copper formates are known to decompose around 170 °C [63,64]. The formates observed here are formed on the support. As their stability is higher than that of copper formates, then at the temperature at which the reaction occurs, copper formates, if formed, are likely to react quickly, so their surface concentration will be low and they cannot be observed.
On the modified supports, in addition to formates, the presence of carbonates can be observed, underlying the formate bands and broadening the band shape. They could be generated from the formates by “reverse reaction”, the net reaction being an exchange of a formate hydrogen for an oxygen atom (11):
| HCOO* + O* → CO3* + H* | (11) |
Reaction (11) should not be understood as the exact mechanism of this transformation, no speculations about it will be made here. However, it has been shown that already under adsorption conditions, some of the postulated intermediates can be observed and both reactant and product side of methanol synthesis can be reached, indicating low activation barriers for the transformations. Taking into account that under the conditions of the heating ramp, almost no molecular formic acid is desorbed, but instead formation of the mixed product methyl formate as well as of the desired product methanol is observed, the superior reactivity of the modified supports is demonstrated.
5 Conclusion
The study has given insight into some of the elements constituting an efficient methanol synthesis catalyst from a mechanistic point of view. Among the samples studied, WGS catalysts showed the least tendency to adsorb formic acid to stable surface species. Their surface formates showed inferior stability with respect to methanol synthesis catalysts and were not transformed into other stable intermediates. On the contrary, on CuZA catalyst and ZA support, methoxy surface species were formed already at the adsorption temperature and were still present near typical reaction temperatures, as evidenced by the evolution of methyl formate and methanol. Superior surface formate stability was also observed on CuZZ and ZZ, CuZC and ZC, and the additional presence of carbonate species showed an easily reversible transformation of the intermediates. The release of lesser amounts of molecular formic acid during thermal desorption indicated its better transformation into reaction products. To summarize, an efficient methanol synthesis catalyst shows medium stability of the surface species formate and methoxy, which are commonly included in the methanol synthesis mechanism, at the reaction temperature.
Acknowledgments
The authors thank ANR VItESSE2 for financial support. We wish to thank Corinne Petit for her help with IR experiments, as well as Junko Nomura and Sébastien Thomas for fruitful discussions.