

1 Introduction
Breast cancer is the most common cancer in Europe for females [1], and the most common cancer overall, with more than 464,000 new cases diagnosed in 2012 (29% of female cases and 13% of the total). Breast cancer begins in breast tissue, which is made up of glands for milk production, called lobules, and the ducts that connect the lobules to the nipple [2]. Some breast cancers are called in situ because they are confined within the ducts (ductal carcinoma in situ or DCIS) or lobules (lobular carcinoma in situ or LCIS) where they originated.
Mammographic mammary microcalcifications are routinely used for the early detection of breast cancer, however the mechanisms by which they form remain unclear [3] and for a long period of time they have been considered as a passive phenomenon [4]. Recently, observations of cell phenotype led M. Scimeca et al. [5] to hypothesize that under specific stimuli, mammary cells may acquire some mesenchymal characteristics transforming themselves into cells with an osteoblast-like phenotype and are able to contribute to the production of breast microcalcifications. At this point, we may recall that the presence of calcification may induce a significant modification of the cellular metabolism, an inflammation or a modification of the phenotype [6,7].
Breast calcifications defined as calcium deposits within breast tissue have thus been at the core of numerous publications [8–25]. One of the difficulties comes from the fact that breast calcifications can arise from a vast number of aetiologies. For example, diffuse or scattered distribution is typically seen in benign entities. At the opposite, approximately 95% of all DCIS, which represents 25–30% of all reported breast cancers are diagnosed because of mammographically detected microcalcifications.
As underlined by T. Oyama et al. [26], two types of calcifications have been described. Type I μcalcifications appear as colorless, birefringent crystals composed of weddellite or calcium oxalate dihydrate (CaC2O4–2H2O). They most often form in apocrine cysts and less commonly in other benign conditions. Type II μcalcifications, which consist of apatite, occur in both benign and malignant conditions [27,28]. Note that, calcium oxalate has three different crystalline forms: calcium oxalate monohydrate (whewellite – CaC2O4–H2O) [29–35], is the most stable [36], Calcium oxalate dihydrate [37–40] and finally calcium oxalate trihydrate (caoxite—CaC2O4–3H2O) which is rarely observed under physiological conditions [41]. From a chemical point of view, the fact that only calcium oxalate dihydrate, a species which normally leads to calcium oxalate monohydrate, seems to indicate that a particular stabilization process exists.
Regarding breast calcifications made of carbonated calcium phosphate apatite (CA), S.H. Poggi et al. [42] have described through Scanning Electron Microscopy (SEM) two morphologies, namely spherical entities and heavily mineralized deposits. These authors have also pointed out local composition variations. Finally, R. Baker et al. [43] have noticed that the carbonate content of breast CA μcalcifications was shown to be significantly different between benign and malignant disease. The importance of morphology and chemical nature has been underlined for other kinds of pathological calcifications such as kidney [31,32,44,45] or prostatic [46,47] calcifications.
Finally, let us note that the majority of microcalcifications are concretions of varying size composed of calcium phosphates largely in the form of Ca phosphate apatite. In ductal carcinoma in situ, calcifications are formed by deposition of calcium on nuclear debris or in secreted mucosubstances. The other type of microcalcifications, calcium oxalate crystals, is seen in microcysts, especially with apocrine epithelium. This association suggests that apocrine epithelium is able to synthetize or concentrate and secrete oxalic acid or calcium oxalate.
All these investigations demonstrate clearly that the establishment of a significant relationship between breast μcalcifications and their aetiology calls for a precise structural and chemical description of these biological entities [48,49]. In this study, we have selected a set of breast biopsies in which the presence of apatite calcifications have been already underlined through HES (Hematein–Eosin–Safran) staining procedures performed at the hospital. In order to describe their structural characteristics at the micrometer scale, observations with a Field Emission SEM (FE-SEM) have been done. On the very same samples, their chemical identification at the micrometer scale has been made through μFourier Transform Infra-Red (μFT-IR) spectroscopy [50–56]. Such precise description of these pathological calcifications may lead to a better understanding of their pathogenesis.
2 Experimental
A set of five breast biopsies (Samples A to E) was investigated in order to shed light on the complexity of the structural and chemical characteristics of ectopic calcifications in breast tissues (Tables 1 and 2). The second set of samples (Samples H to Q) is used to establish a possible relationship between the pathology and the structural and chemical parameters of breast calcifications. In the first step, we select benign calcifications and one related to DCIS. The biological samples came from Gustave Roussy Institute (Villejuif, France). Five micrometer sections of biopsies fixed in formalin and paraffin embedded were deposited on low-e microscope slides (MirrIR, Kevley Technologies, Tienta Sciences, Indianapolis). Ethical approval was obtained by the ethical committee of IGR for this study. Each sample was only named by a study number, without indicating the name of the patient or potential identification data.
Physiological and clinical data of the first set of samples.
| Sample | Age (years) | Disease |
| Sample A – 13H2480 | 65 | Normal breast (duct) |
| Sample B – 13H2606 | 60 | Fibroadenoma |
| Sample C – 13H2282 | 61 | Galactophoric cyst |
| Sample D – 13H2427 | 57 | Adenosis |
| Sample E −13H2281 | 62 | Ductal carcinoma in situ (DCIS) |
Physiological and clinical data of the second set of samples.
| Sample | Age (years) | Disease |
| Sample F – 13H3279 | 60 | DCIS |
| Sample G – 13H6529 | 55 | DCIS |
| Sample H – 13H2851 | 66 | DCIS |
| Sample I – 13H1096 | 70 | DCIS |
| Sample J – 13H8746 | 66 | DCIS |
| Sample K – 14H2554 | 37 | Benign |
| Sample L – 14H4540 | 50 | Benign |
| Sample M – 13H4111 | 63 | Benign |
A Zeiss SUPRA55-VP SEM was used for observation of microstructure. This field-effect “gun” microscope (FE-SEM) operates at 0.5–30 kV. High-resolution observations were obtained by 2 secondary electron detectors: an in-lens SE detector and an Everhart–Thornley SE detector. To maintain the integrity of the samples, measurements were taken at low voltage (between 0.5 and 2 kV) without the usual deposits of carbon at the surface of the sample [57,58].
IR microspectroscopy was performed on an IN10MX microscope (Thermo Scientific) for recording large maps. All spectra were collected in ultrafast mode using a 50 μm × 50 μm aperture. The spectra were collected in the 4000–700 cm−1 mid-IR range at a resolution of 8 cm−1 with one spectrum per pixel. Data analysis of IR spectra and chemical images was performed using OMNIC software (Thermo Scientific).
3 Results and discussion
From a crystallographic point of view, the apatite prototype structure was first determined by Naray-Szabo [59] and are conventionally regarded as conforming to the A5(BO4)3X general chemical formula (P63/m symmetry) [60]. At this point, we would like to recall that hydroxyapatite can be described as a hexagonal stacking of (PO4)3− groups with two kinds of tunnels parallel to the c axis. The first one coincides with the ternary axis of the structure and is occupied by Ca2+, noted as Ca(I) ions. The second one is linked by oxygen and other calcium ions, noted Ca(II), and is occupied by OH− ions. Ca(I) and Ca(II) are present in a 2/3 ratio [61–63].
Regarding biological samples, CA calcifications display generally a hierarchical structure at different scales [64–66]. Biological apatites result from the agglomeration of nanocrystals [67,68]. Their nanometer size with an anisotropy along the c axis [69] is combined with a high Ca and OH− deficiency [70,71]. carbonate groups [72] and trace elements [73] such as Mg2+ [74–76], Zn2+ [77–83] or Sr2+ [84–87] can be found inside or at their surface while an amorphous part (ACCP for amorphous carbonated calcium phosphate) [88] is located at the surface of the nanometer size crystal. carbonate anions substitute partially phosphate ions () (B-type) or hydroxide ions (OH−) (A-type). For the position of ions (A-type) six possibilities around the c axis are in fact possible for a same chemical composition [89]. Interestingly, a supplementary species of carbonate, i.e. a labile carbonate, has been underlined [90]. Thus biological apatites can be represented by the following formulae:
At the micrometer scale, different morphologies can be observed for CA calcifications. In a recent paper focused on kidney stones [91], CA particles appeared as spherules of 4.5 ± 3.0 μm in diameter and were significantly larger in females than in males. Note that spherical entities have been also identified in human cardiovascular tissue calcification [92]. Also, the description of the surface of CA particles may provide major clinical information regarding the infection process involved in CA formation as shown for kidney stones [93].
Investigations performed through vibrational spectroscopies, namely μFTIR and Raman spectroscopies, have been also used for studying biological CA [47,94–99]. Raman experiments may also play a major role regarding the guidance of stereotactic breast needle biopsies for microcalcifications [100]. I. Barman et al. [101] show the potential of Raman spectroscopy to concomitantly detect microcalcifications and diagnose associated lesions. Such an investigation provides real-time feedback to radiologists during such biopsy procedures, reducing non-diagnostic and false-negative biopsies. Quite recently, it was found from Raman spectroscopic analysis of CA μcalcifications that the carbonate content is greater in CA calcifications from benign than malignant breast tissue [102]. Also, a significant correlation was observed between carbonate concentrations and carcinoma-in-situ sub-grades [14]. Taking into account the small size of the crystallites, Raman spectroscopy seems to be even more effective than FTIR but this technique has several drawbacks. Some patients present extremely low quantities of ectopic calcification with fragile, organic, and micrometer-sized crystals; we have already observed that chemical characterization through Raman spectroscopy even at very low power induces significant alterations of their morphology. Moreover, even in the case of ectopic calcifications made of whewellite microcrystals, Raman spectroscopy can induce significant modifications. As a preliminary conclusion, all these studies underline the different structural parameters which have to be discussed in the case of CA calcifications [7].
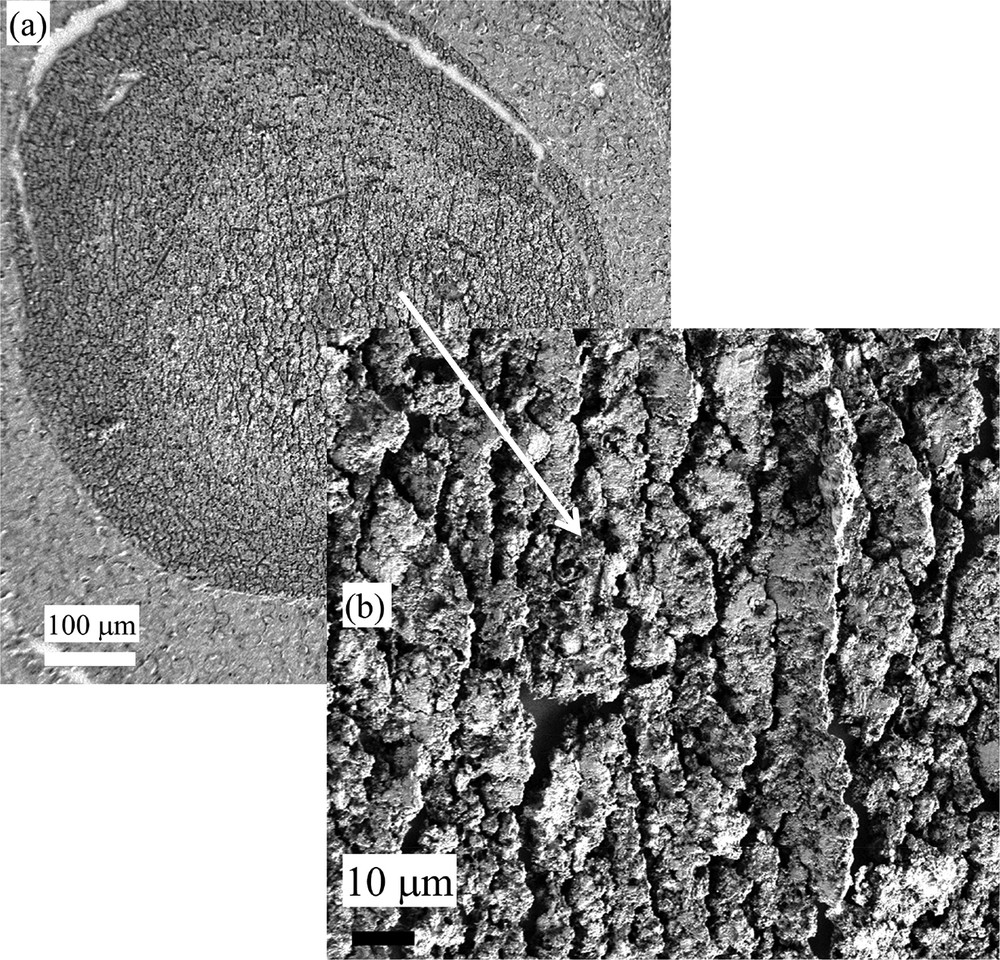
The starting point of this study is given by FE-SEM observations performed on benign calcifications (sample A-13H2480). On Fig. 1, a set of FE-SEM photographs at low and high magnifications has been gathered. As we can see, normal breast calcifications can be observed in detail.
FE-SEM observations of sample A (13H2480 – Normal breast) at low (a) and high (b,c,d, and e) magnifications. Different mineralized deposits at various magnifications can be visualized.
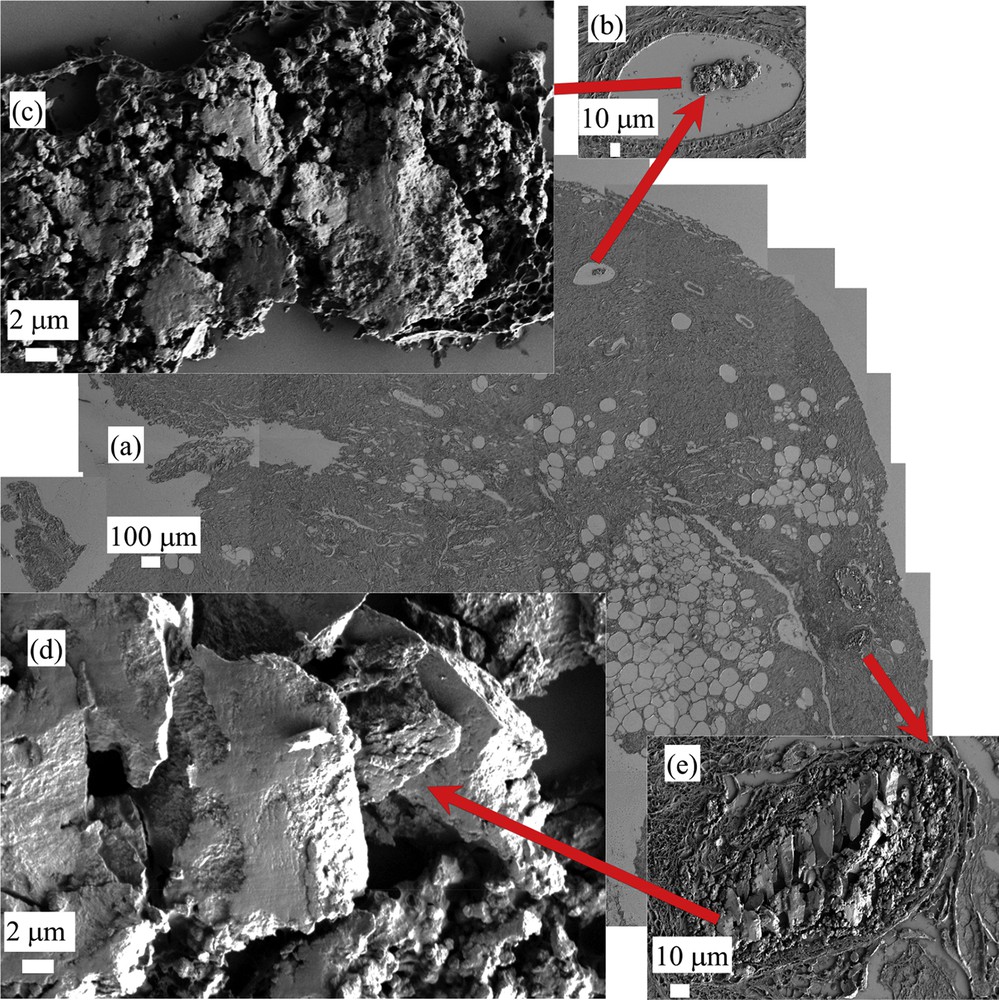
In Fig. 2, we have considered the sample B (13H2606) (which is related to fibroadenoma). In that case, heavily mineralized deposits (black arrows in Fig. 2a) as well as micrometer scale spherules at different magnifications (inside the black circle in Fig. 2a and then in Fig. 2b and c at higher magnifications) are shown.
(a) FE-SEM observations of sample B (13H2606- Fibroadenoma) showing heavily mineralized deposits and very small entities invisible at this magnification. (b) and (c) micrometer scale spherules corresponding to the black circle of Fig. 2a are visualized at higher magnifications.
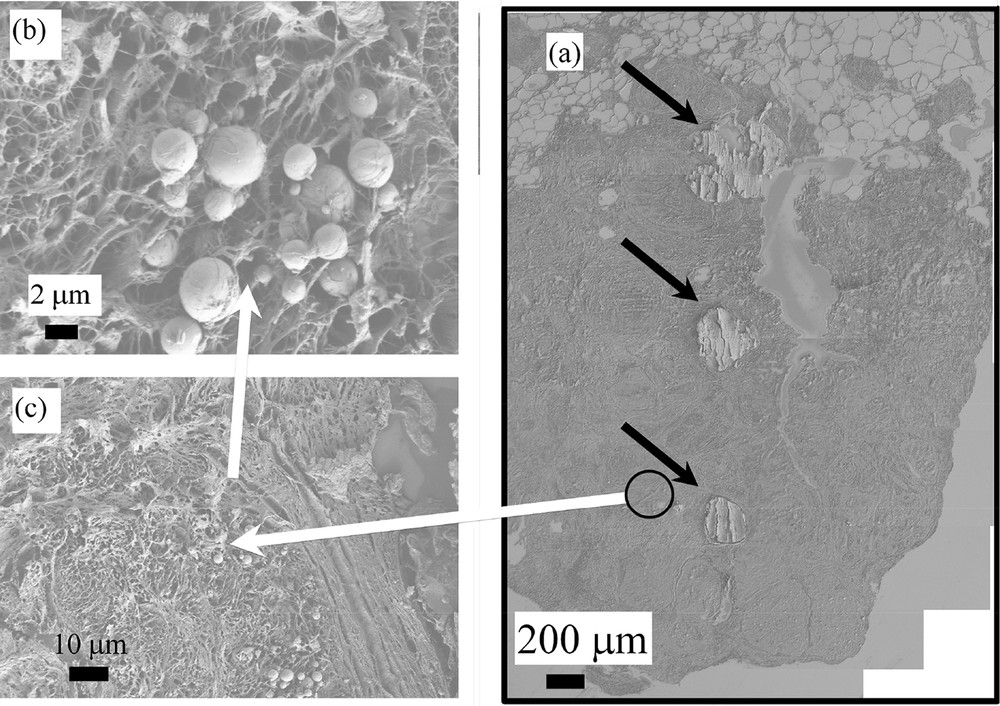
Such an observation is in line with previous measurements performed by S.H. Poggi et al. [42] which have already underlined the presence of two kinds of CA deposits. More interestingly, another set of SEM observations establish a possible link between these two kinds of CA deposits. As we can see in Fig. 3a–h, heavily mineralized deposits seem to be the result of the agglomeration of micrometer scale spherules. Such an structural evolution from micrometer scale spherules to “large” deposits is observed for very different pathologies including fibroadenoma (sample B), galactophoric cyst (sample C) and adenosis (sample D).
(a–h) All these SEM observations (Sample B: 13H2606- Fibroadenoma; Sample C: 13H2282 Galactophoric cyst; Sample D: 13H2427—Adenosis) show that some of the heavily mineralized deposits seem to be the result of the agglomeration of micrometer scale spherules.
Thanks to the development of the FE-SEM technology, it is possible now to get a more precise description of these spherules. The following set of SEM observations which have been collected on the same sample (sample B) demonstrates clearly that spherical entities may display very different internal structures (Fig. 4). Some of them are homogeneous (Fig. 4a) while for others, concentric layers are present at the surface of the spherules (Fig. 4b and c). Finally, some spherules seem to exhibit a radial structure (Fig. 4a and d).
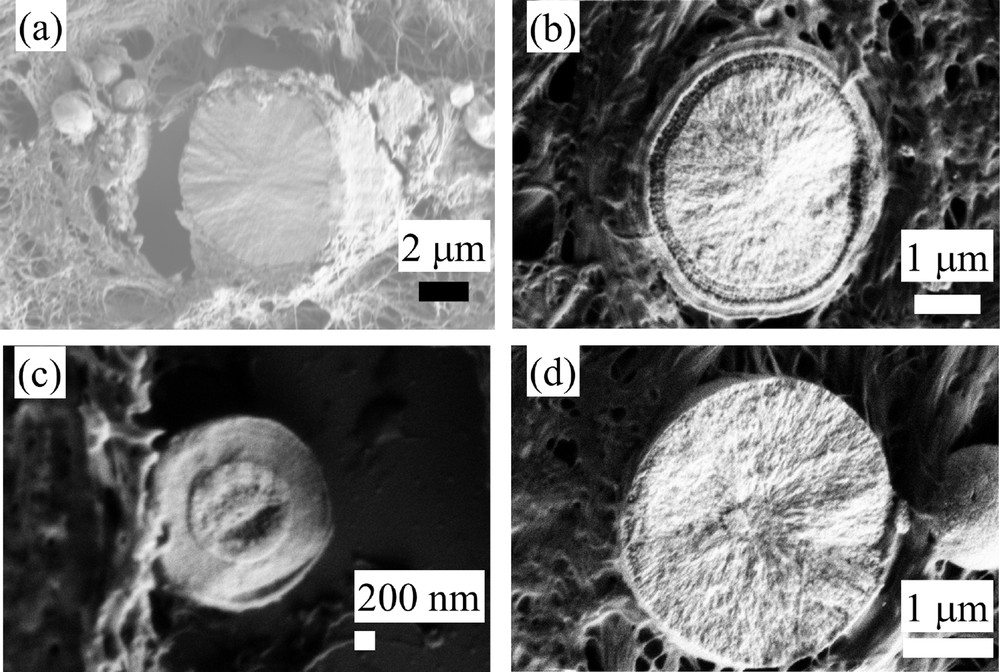
Sample B (13H2606- Fibroadenoma). Different internal structures of CA sphericules. (a) Radial structure; (b) and (c) concentric layers; (d) radial structure.
In order to determine precisely the chemical nature of these abnormal deposits, FTIR experiments have been performed (Fig. 5 for the sample E, Fig. 6 for the sample C) (13H2282- Galactophoric cyst). As we can see on Figs. 5 and 6, the last generation FTIR experimental device allows the acquisition of the large map in a short time (around 30 mn) with an excellent signal to noise ratio. Let’s just recall that F.T.-I.R. spectroscopy probes the vibrational modes of molecules, providing a spectrum that is structure-specific [103].
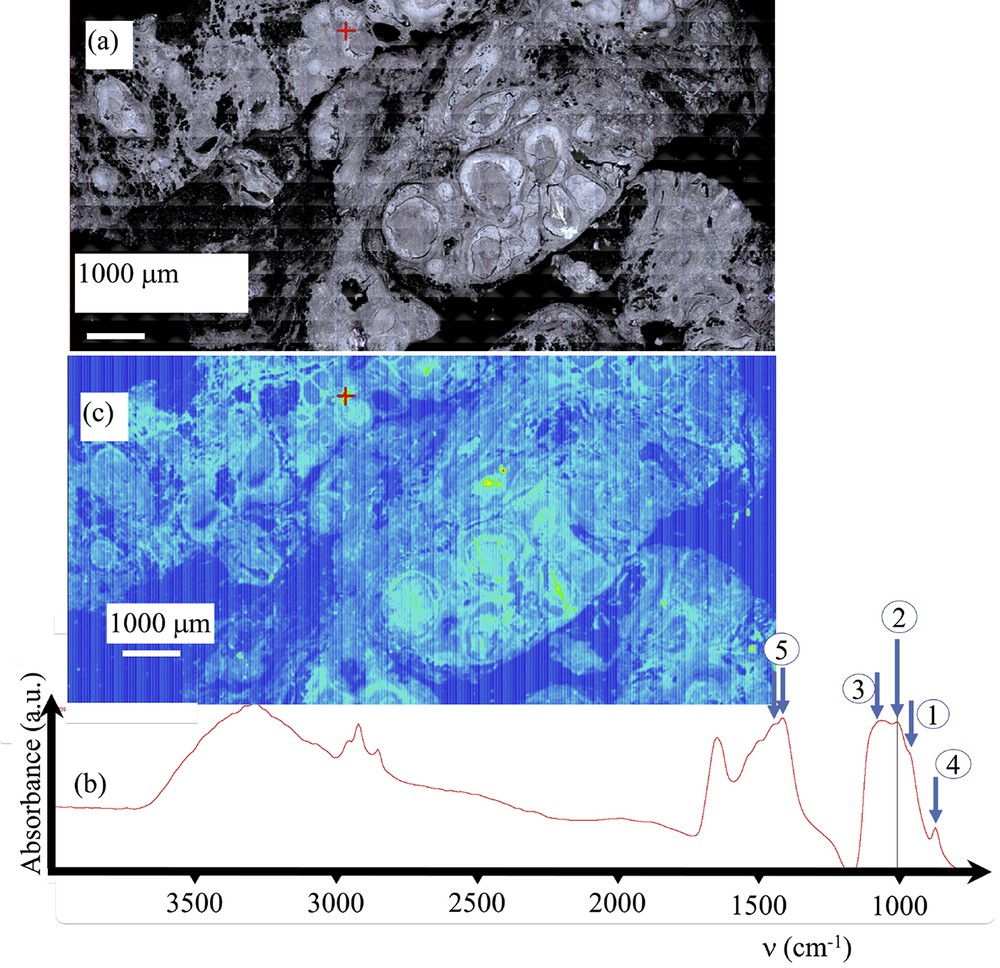
Sample E (13H2281 – Ductal carcinoma in situ) (a) Optical image collected by the FTIR spectrometer. (b) Typical infrared spectrum: (1) ν1 P–O stretching vibration modes are measured at 960–962 cm−1; (2) ν3 P–O stretching vibration modes are measured at 1035–1045 cm−1; (3) Particular attention has to be paid to the presence of a feature in the ν3 absorption band, which can be used as a fingerprint for the presence of ACCP; (4 and 5) absorption bands due to the presence of carbonate. (c) Spatial repartition of Ca phosphate apatite in the breast biopsy. Red cross marks in Fig. 5a and c correspond to the points of measurement.
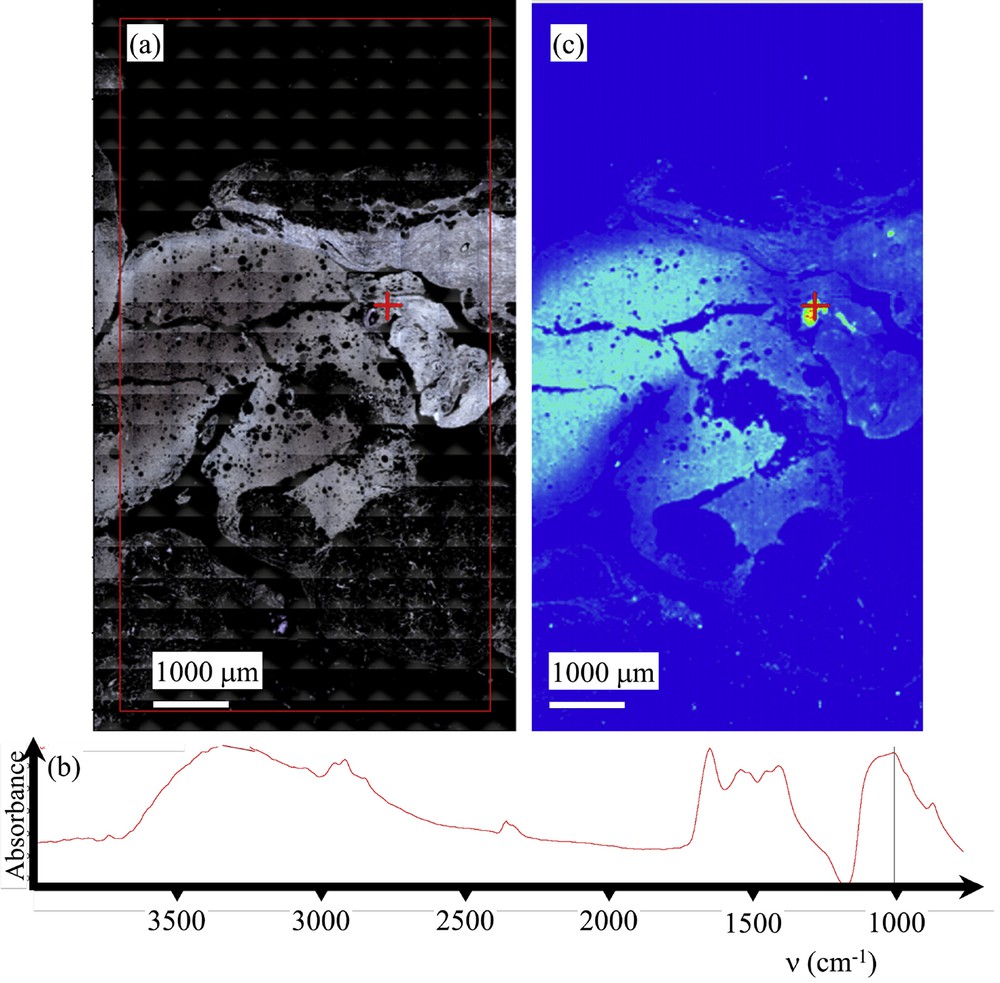
Sample C (13H2282- Galactophoric cyst) (a) Optical image collected by the FTIR spectrometer. (b) Typical infrared spectrum. (c) Spatial repartition of Ca phosphate apatite in the breast biopsy as given by the absorption bands at 1000 cm−1. Red cross marks in Fig. 6a and c correspond to the points of measurement.
On Fig. 5 (Sample E—13H2281— – Ductal carcinoma in situ), data collected on the FTIR experimental set up and on the FE-SEM device have been gathered. Fig. 5a shows the optical map obtained while in Fig. 5c a typical infrared spectrum is shown. The absorption bands measured at 960–962 cm−1 and 1035–1045 cm−1, correspond to ν1 and ν3 P–O stretching vibrations, respectively, while the ν4 O–P–O bending mode corresponds to the doublet at 602–563 cm−1 (Fig. 5b). The absorption band corresponding to the ν3 P-O 1030–1045 cm−1 is clearly visible while the doublets appearing at around 1410 cm−1 and 1450 cm−1 are due to the presence of carbonate inside the CA crystals. The spatial repartition of CA (Fig. 5c) can be estimated through a plot of the spatial repartition of the intensity of the absorption peak located at 1030 cm−1 (ν3 P-O). In the case of sample 1, this spatial repartition of CA (Fig. 7c) given with FTIR data is in line with the SEM map (Fig. 7d). Thus, we have for this breast biopsy a chemical imaging as well as the morphology of the different CA deposits.
Sample E (13H2281-Ductal carcinoma in situ): (a) and (b) SEM observations at two different magnifications. Note the absence of spherical entities.
Particular attention has to be paid to the presence of a shoulder in the ν3 absorption band, which can be used as a fingerprint for the presence of amorphous carbonated calcium phosphate (ACCP). Its disappearance can be considered as a marker for the presence of the ACCP compound, the ν3 P-O peak of which being shifted at around 1060 cm−1. For the three samples (F, C and G) which correspond respectively to ductal carcinoma in situ, galactophoric cyst and sclerosis adenosis; FT-IR spectroscopy underlines the presence of ACCP. To our knowledge, such a chemical phase has never been identified in breast calcification.
Finally, we would like to discuss the sample E (13H2281-Ductal carcinoma in situ), for which we compare different FTIR spectra collected for a same calcification. In Fig. 7, SEM images of this structure which correspond to duct carcinoma in situ at two different magnifications are shown (Fig. 7a and b). Note that it was not possible to visualize spherical entities.
Then, for this feature, we collect FTIR spectra from the core to the surface (Fig. 8a–c). It is crystal clear that these three spectra show clearly a significant chemical heterogeneity inside the calcification. As underlined previously, the presence of a shoulder in the ν3 absorption band is directly related to the presence of CA and its disappearance to ACCP and a comparison between the two IR spectra plotted in Fig. 8a and b is significantly different. Moreover, for this feature, a major variation of the / ratio is observed.
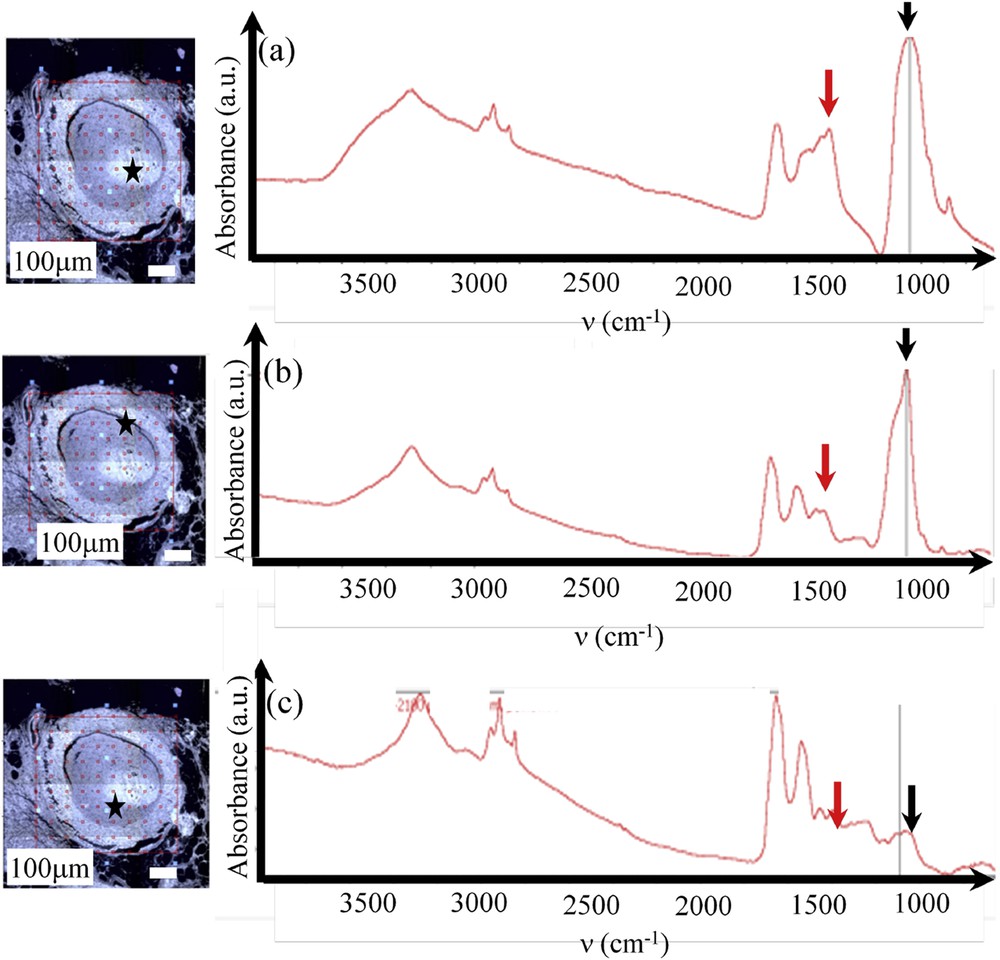
Sample E (13H2281-Ductal carcinoma in situ) (a, b and c) location (given by the black star in the optical photograph) and FTIR spectra. The chemical compositions as well as the carbonate level are very inhomogeneous: a) high proportion of PACC (black arrow) with a very high carbonation rate (red arrow); b) high proportion of CA (black arrow) with a low carbonation rate (red arrow); c) spectrum of proteins with a low proportion of calcium phosphate (black arrow).
We would like to assess now the second set of samples (Samples F to M) for which we try to establish a possible relationship between the physicochemical characteristics of the calcifications and the pathology. On these samples, μFTIR experiments as well as FE-SEM observations at different magnifications have been performed. As an illustration, experiments on sample F (Figs. 9 and 10) and sample K (Figs. 11 and 12) are shown. For both samples, μFTIR data indicate the presence of ACCP and CA.
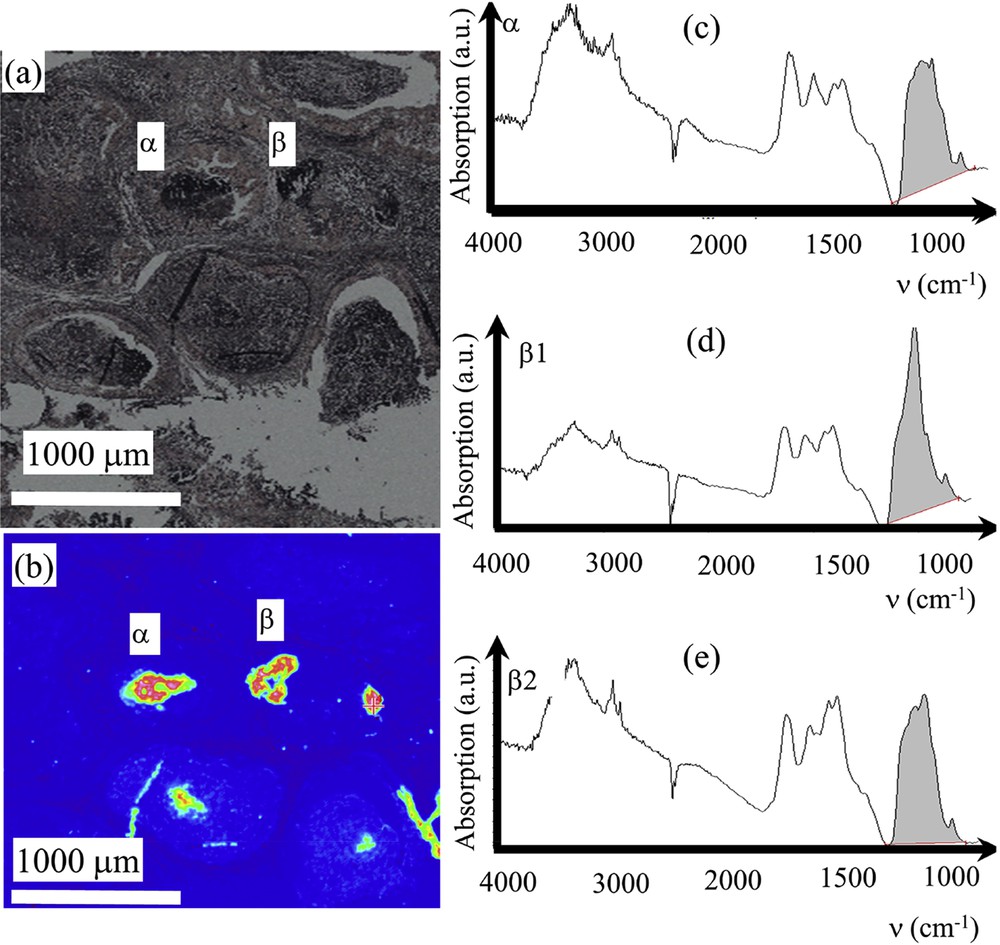
Sample F – 13H3279 – DCIS: (a) Optical image collected by the FTIR spectrometer. (b) Spatial repartition of Ca phosphate apatite in the breast biopsy as given by the absorption bands at 1000 cm−1. (c) infrared absorption spectrum collected for the deposit α. (d) and (e) two infrared absorption spectra collected for the deposit β showing various mixing of ACCP and CA.
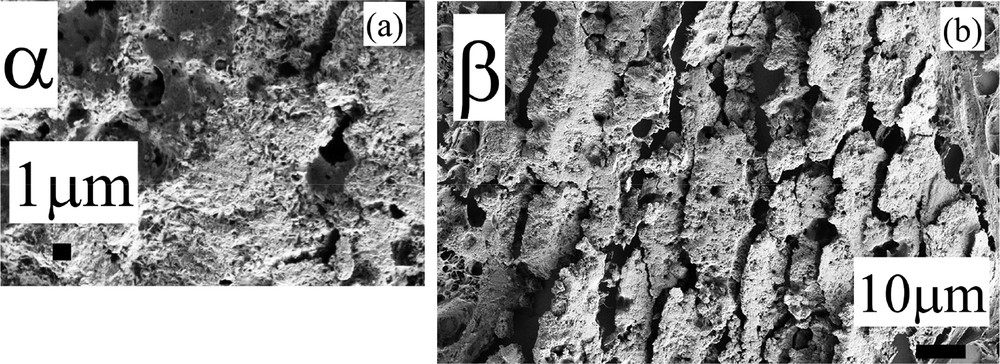
Sample F – 13H3279 –DCIS: (a) and (b) SEM observations at high magnification for the deposits α and β.
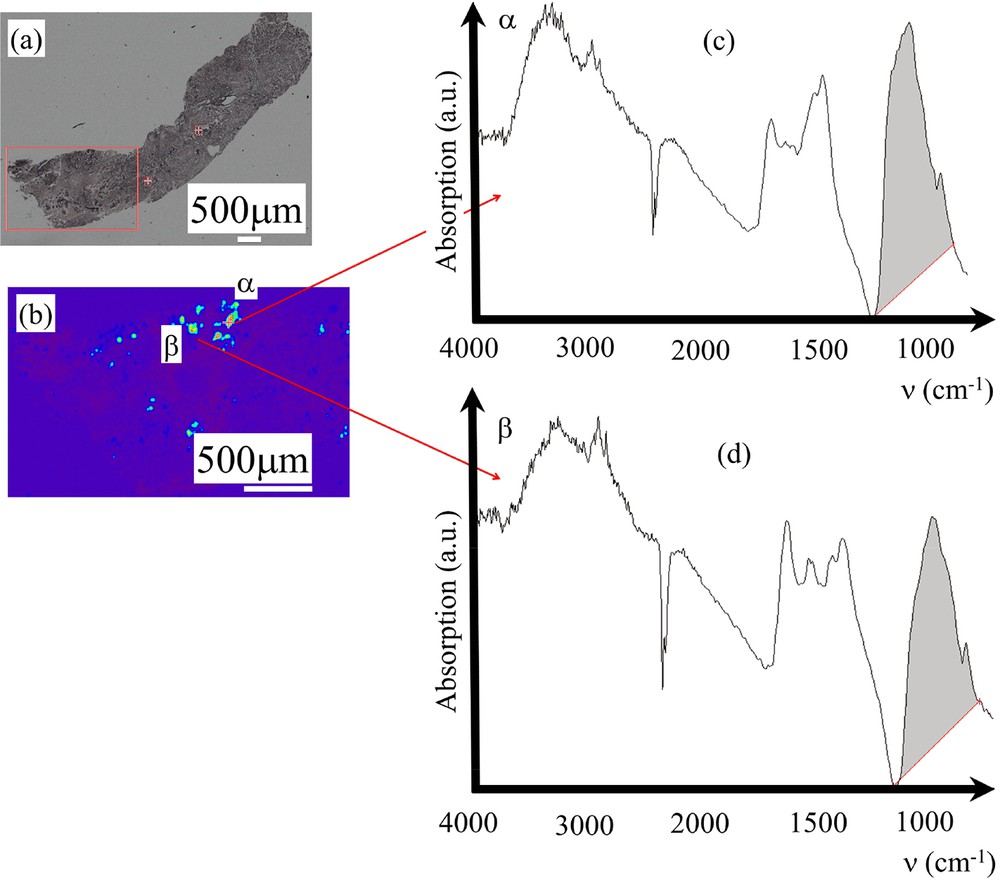
Sample K – 14H2554- benign: (a) Optical image collected by the FTIR spectrometer. (b) Spatial repartition of Ca phosphate apatite in the breast biopsy as given by the absorption bands at 1000 cm−1 (c) and (d) Infrared absorption spectra collected for the deposits α and β.
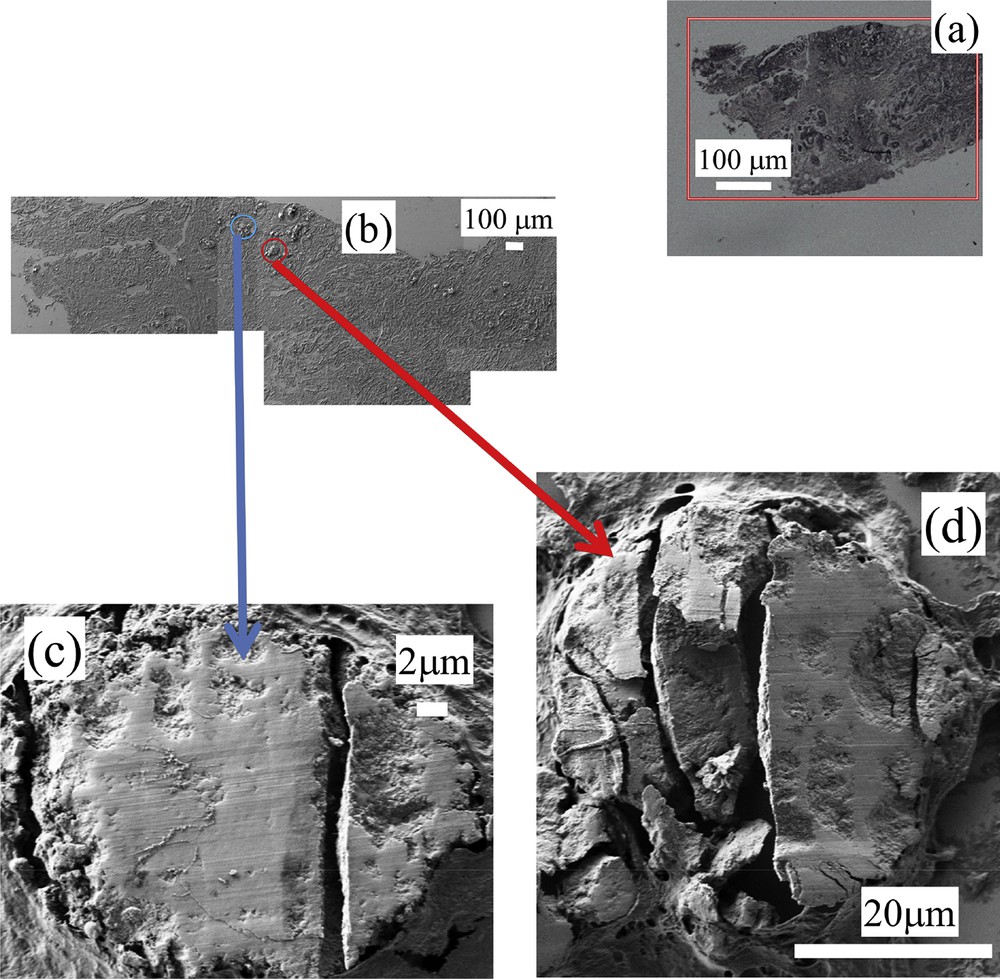
Sample K – 14H2554- benign: (a) optical map, FE-SEM observations at low (b) and high (c and d) magnifications.
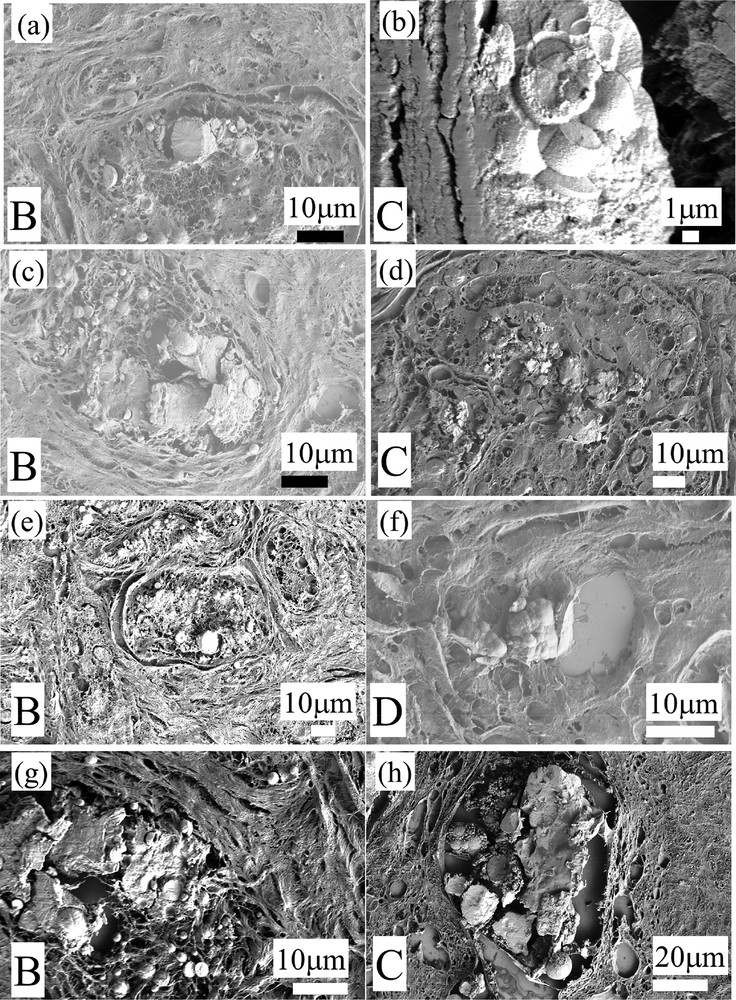
At a first sight, the complete set of observations performed through FE-SEM seems to show that the two kinds of calcifications are quite similar (Fig. 13) One striking point is related to the fact that for some samples (samples E,F and G) related to DCIS, FE-SEM observations clearly show a specific morphology at the micrometer scale (Fig. 14).
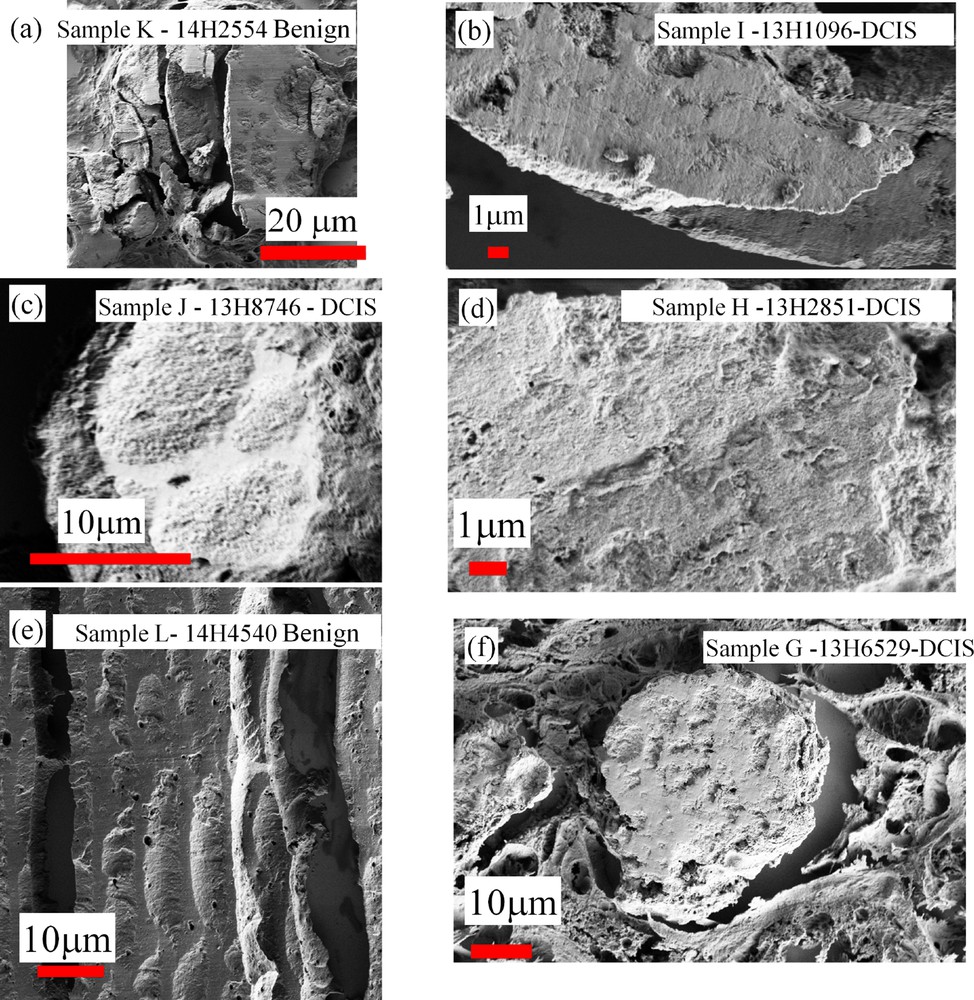
SEM observations collected for different samples. Samples K and L are related to benign calcifications while samples G,H and I are related to DCIS.
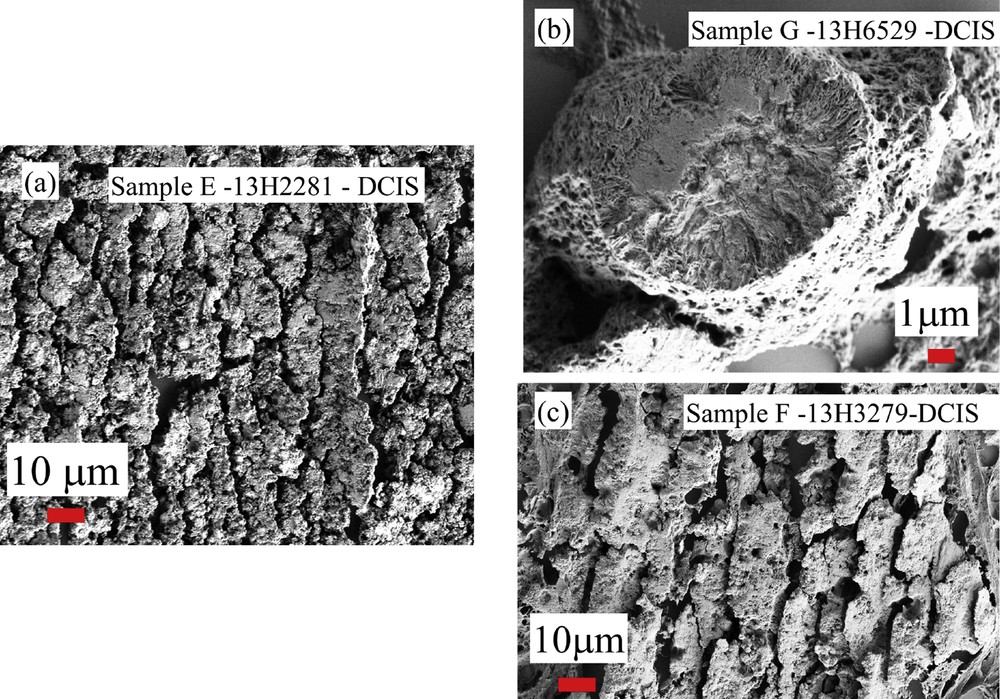
SEM observations collected for breast calcifications (samples E,F and G) related to DCIS.
4 Conclusion
In this investigation, we have characterized ectopic calcifications in breast tissues using last generation experimental devices i.e., FE-SEM and μFTIR spectrometer. Such approach allows us to describe the morphology of these mineral deposits and to identify precisely their chemical nature. Several striking results have been obtained. While the literature regarding ectopic calcifications in breast tissues [see for examples 8–25, 104–108] shows that only two chemical phases have been identified, through a careful analysis of μFTIR spectroscopy, our study demonstrates clearly the presence of a third phase, namely ACCP (Fig. 8, sample E). In the case of duct carcinoma in situ, this chemical phase was present at the center of the duct. At our best knowledge, it is the first time that this chemical phase has been reported in ectopic calcifications. Through μFTIR spectroscopy, we underline a very inhomogeneous distribution of the chemical phases as well as the carbonate levels in the pathological calcifications. It is thus very difficult to relate the carbonation rate of CA to the pathology as previously suggested. Finally, SEM observations underline a diversity in the internal structure of spherule entities. For some samples related to DCIS, special features at the micrometer scale seem to be related to this pathology because they were not found for the other pathologies. In order to establish a relationship between the physicochemical characteristics of the calcifications and pathology, a double blind trial has to be performed.
Moreover, as underlined in previous publications, we can add data coming from other techniques. In the case of ectopic calcifications made of apatite, the presence of trace elements such as Zn which can play a major role in the pathogenesis, has to be assessed through X-ray fluorescence [109–120] and one technique specific to synchrotron radiation, namely X-ray absorption spectroscopy (XAS) [85,86,121–126]. For example, it is possible to underline the inflammation process through the content of Zn, an information which can be very important for a clinician [113,114]. Through XAS, it is also possible to assess the localisation of trace elements versus the calcification [86].
Acknowledgments
This work was supported by the Physics and Chemistry Institutes of CNRS and by contracts ANR-09-BLAN-0120-02, ANR-12-BS08-0022, ANR-13-JSV-10010-01, convergence UPMC CVG1205 and CORDDIM-2013-COD130042. Different experiments performed on ectopic calcifications using the Soleil SR Facility (proposal numbers DISCO-20130967, SMIS- 20130016, DISCO-20120747, SMIS-20120070, SMIS-20110084, SMIS-20100566, DISCO- 20100565, DISCO-20100505, DISCO-20100502, SMIS-20100039, DIFFABS-20060357, DIFFABS-20080028, and DIFFABS-20110059) allowed us to start this research.