

1 Introduction
Nitrogen oxides, NO, NO2 and N2O, generated by fuel combustion processes, are a serious threat to the environment and human health, therefore new legal standards impose more and more restrictions on NOx emissions. The method to eliminate nitrogen oxides from stationary sources is the reduction with ammonia (SCR) [1,2]. This process may be realized on industrial scale either as selective non-catalytic reduction (SNCR) in the temperature range of 850–950 °C or selective catalytic reduction (SCR), the latter being more efficient. The standard industrial catalyst used for SCR process is V2O5/WO3/TiO2 on a ceramic monolith [3], with vanadium oxide as the active component, tungsten oxide to increase the temperature window, SiO2 to stabilize the structure and MoO3 to make the catalysts more resistant towards poisoning by SO2. The catalyst exhibits good catalytic properties at temperatures ranging from ca. 300 to ca. 400 °C [4] and is usually applied in the so-called “high-dust” configuration where the temperature is appropriate, but the catalyst may undergo deactivation, among others by SO2 and the components of fly ash [5]. It may be possible to locate the catalyst downstream of the electrostatic precipitator, or at the “tail position”, but because of temperature required for the effective operation of the catalyst, the reheating of flue gas is necessary [6].
Over the past 20 years, many new catalysts for NO reduction were proposed, such as supported metal oxides, modified clays, metal exchanged zeolites, amorphous alloys or perovskites [7–10]. Unfortunately, in most cases, these catalysts proved to have either too low activity in the low temperature region (under 250 °C) or low selectivity in the high-temperature region (over 400 °C), or the low hydrothermal stability. These properties limit their application in industrial processes. It would be of advantage, if SCR catalysts had the best performance at temperatures below 250 °C because they could be then applied at tail-end position, where the influence of fly ash and SO2 would be decreased. Until now few materials may be thus used, among them activated carbon promoted by transition metal or modified with nitrogen compounds [11–15]. Other promising candidates for NO removal in the low temperature region are mixed oxide catalysts derived from hydrotalcite-like compounds [16–22].
Hydrotalcite (HTlcs), also known as layered double hydroxides (LDHs), have a general formula , where MII and MIII represent divalent and trivalent metal ions, and An− any hydrated anion. It has been reported by Cavani et al. that monovalent and tetravalent cations, such as Li+, Zr4+, Ti4+ and Sn4+ could also be incorporated into the hydroxide layer [23]. Therefore, hydrotalcite-derived oxides can be adjusted with the corresponding acid–base sites and redox properties for specific catalytic applications.
A limited number of approaches have been reported for hydrotalcite-like derived oxides for the removal of NOx, either by SCR–NH3 or NO decomposition. Yuan et al. investigated the influence of Lewis acid site concentration on catalyst performance, showing that with the increase of Lewis sites, the amount of nitric species, which are an important intermediate in SCR, increased [16]. Labidi et al. [17] reported that low cobalt loading improved NO conversion and N2 selectivity, while high amount of Co led to an opposite effect (Co0.37Mg0.38Al0.23 > Co0.75/Al0.24). Yu et al. [18] used CaCoAl- and CaCoLaAl-oxides for the direct decomposition of nitrogen oxide with a yield of 55–75% NO to N2 at 300 °C. Cheng et al. [19] reported also that Ti incorporated hydrotalcite-derived oxides exhibited high sulfur resistance with good performance for NO direct decomposition. Chmielarz et al. studied hydrotalcite catalysts, comprising in their structure Co2+, Cu2+, or Cu2+ and Co2+ ions and reported the increase in activity in the SCR reaction in the following sequence: Cu–Mg–Al > Cu–Co–Mg–Al > Cu–Mg–Al at temperatures range from ca. 250 °C to ca. 300 °C [20]. These studies showed additionally that selectivity to N2 was dependent on the metal content of the catalyst.
The goal of this work was to study hydrotalcite-like materials containing Mn–Cu–Co, as prospective low-temperature catalysts for SCR–NH3 and to test the influence of the manganese content and of the method of introduction on catalytic performance. Manganese as an additional component was chosen based on literature data, which showed high activity of oxides of manganese supported on activated carbon [12–15] or Al2O3 [21] in the low-temperature region. It was also proven by Grzybek et al. [22] that the distribution of Mn species influenced selectivity, so two methods were chosen for Mn introduction into the catalysts, co-impregnation and adsorption.
2 Experimental
2.1 Synthesis of the catalysts
Hydrotalcite-like catalysts containing Al (trivalent M(III) metal) and divalent M(II) metals (Mg, Co, Cu and Mn) with a M(III)/M(II) molar ratio of 0.33, a constant amount of Co and a changing ratio Cu:Mn of Cu to Mn (as shown in Table 1), were prepared using co-precipitation method at constant pH. Two aqueous solutions, one containing sodium hydroxide (1 M) and the second containing mixed nitrates of divalent and trivalent metals, were added dropwise into a flask containing an aqueous solution of sodium carbonate and kept under vigorous stirring at 65 °C and constant pH of 9.5–10. The mixture was subjected to aging for 24 h and then filtered, washed with heated (50 °C) deionized water and dried at 80 °C overnight.
The chemical composition of fresh hydrotalcites and their designation.
| [MeyMgxAl0.25(OH)2](CO32−)0.125·0.5H2O | |||||
| Sample | wt% | Mn/Cu molar ratio | |||
| Cu | Co | Mn | Mg | ||
| HT | – | – | – | – | |
| Mn0.0625HT | – | – | 4.4 | 21.6 | – |
| Mn0.01Co0.08Cu0.16HT | 11.9 | 5.8 | 0.5 | 14.3 | 0.06 |
| Mn0.02Co0.08Cu0.14HT | 10.7 | 5.8 | 1.5 | 14.3 | 0.14 |
| Mn0.016Co0.08Cu0.15HT | 11.3 | 5.8 | 1 | 14.3 | 0.10 |
| Co0.08Cu0.16HT | 11.9 | 5.8 | – | 14.6 | – |
| Mn(IE)Co0.08Cu0.16HT | 11.9 | 5.8 | 0.87a | 14.6 | n.d. |
| Mn0.08Co0.08Cu0.08HT | 6.3 | 5.8 | 5.4 | 14.4 | 1 |
a Determined by AAS for sample after calcination.
One of hydrotalcites Co0.08Cu0.16Mg0.5 was promoted with Mn by ion exchange, similarly as described by Rojas et al. [24] for Ni–Zn layered hydroxides. The procedure included the following steps: first 1 g of the parent hydrotalcite was suspended in 100 mL of water and stirred for 30 min. A solution of manganese–DTA complex containing the calculated amount of manganese (0.5 wt%) was prepared. The solution was added to 100 mL of water containing hydrotalcite. pH was adjusted to 3.5 to dissolve the reagents and form the complex, and then it was increased to 5.5 by adding the required amount of 0.1 M NaOH solution. The ion exchange was performed under nitrogen atmosphere.
Prior to the reaction, the catalysts were calcined in air at 500 °C for 5 h.
2.2 Characterization of the catalysts
The catalysts were characterized by X-ray diffraction, infrared spectroscopy and low-temperature nitrogen sorption.
The structure of fresh and calcined catalysts and, for Mn promoted CoCu-HT samples after reaction, as well as the size of the crystallites were determined by XRD at room temperature. The choice of the calcination temperature was based on XRD experiments, which were additionally carried out as a function of temperature at 25 °C and from 100 °C to 900 °C, with the step size of 100 °C. The XRD patterns for the samples tested in SCR were obtained after a whole catalytic series carried out up to 400 °C as described in Section 2.3. The measurements were carried out using PANalytical–Empyrean diffractometer, equipped with Cu Kα (λ = 1.5406 Å) radiation source, within the 2θ range from 5 to 90° and with a step size of 0.02 °/min. XRD measurements were also performed for uncalcined samples as a function of temperature: at 25 °C, and then from 100 to 900 °C (with a 100 °C step).
The specific surface area and the volume and size of mesopores were determined from nitrogen adsorption/desorption at –196 °C. The measurements were performed with a Gemini V series apparatus (Micromeritics). Before the measurements, the catalysts were outgassed at 250 °C for 4 h. The resulting adsorption/desorption isotherms were used to determine the surface area using the BET method and the mesoporosity by BHJ method.
Fourier-transform–infrared spectra (FT–IR) were obtained for fresh catalysts with a Thermo Nicolet 380 FT–IR spectrometer. Thirty-two scans were taken for each spectrum for wave numbers from 400 cm−1 to 4000 cm−1 registered with a resolution of 4 cm−1. The hydrotalcite samples were mixed with KBr at 1:100 ratio and pressed into disks.
The presence of manganese for the sample prepared by Mn–EDTA adsorption was checked by XRF. The content of manganese in this sample was determined after calcination by atomic absorption spectroscopy. The X-ray fluorescence measurement was performed using handheld TRACER III-SD Bruker spectrometer. The TRACER is equipped with an X-ray tube with a rhodium anode (max. voltage 40 kV) and 10 mm2 XFlash SDD detector. The spectrum was recorded in the energy range from 1.5 to 40 keV with voltage 40 kV and without additional manual filters. For the determination of manganese concentration, Hitachi Spectrophotometer Z-2000 with Zeeman effect background correction and HCL (hollow cathode lamp) as source of radiation was used. For the measurements, the calcined sample was digested in concentrated HNO3 and HF acids in Berghof microwave digestion system: Speedwave Four.
2.3 Catalytic measurements
The activity tests in the selective catalytic reduction of nitrogen oxide (NO) by ammonia were performed at atmospheric pressure in a fixed-bed flow reactor containing 0.3 g of catalyst (grain size between 0.09 and 0.16 mm). The temperature inside the reactor was measured by a thermocouple, near the centre of the catalyst, with an electronic temperature controller (Lumel RE19). The reaction mixture contained 800 ppm NO, 800 ppm NH3, 3.5 vol% O2 and balance He. The total flow was 100 cm3/min. The concentrations of NO and N2O were analyzed by FT–IR detector (ABB 2000 AO series). Prior to the reaction, the catalysts were calcined at 500 °C for 5 h in air. The catalytic tests were performed at temperatures ranging from 150 to 400 °C, for 1 h at every temperature, with a 50 °C step.
NO conversion was calculated according to the equation:
Additionally selective catalytic oxidation (SCO) of ammonia was performed for selected samples in order to verify:
- • if N2O in the product stream originates from a parallel reaction of NO reduction to N2O or from ammonia oxidation;
- • if activity trends in SCO and SCR reactions at temperatures between 300 and 400 °C are similar.
The selective catalytic oxidation (SCO) of ammonia was performed in a fixed-bed flow reactor containing 0.1 g of catalyst. The reaction mixture contained 1500 ppm NH3, 4.4 vol% and balance He. The total flow was 50 cm3/min. The concentrations of NO, N2O, NH3 and N2 were analyzed using a quadrupole mass analyzer (PREVAC). Prior to the analysis, the samples were treated at 400 °C for 1 h in the flow of pure He. The catalytic tests were performed at temperatures ranging from 150 to 400 °C, for 1 h at every temperature, in steps of 50 °C. NH3 conversion was calculated from an equation similar to that used for NO conversion. The mixture after reaction contained unreacted NH3, and N2O and N2 as products. No nitric oxide was evidenced in the products. Selectivity to N2 and N2O was determined as:
3 Results and discussion
3.1 Physicochemical characterization
3.1.1 Textural parameters
Fig. 1 depicts the N2 adsorption/desorption isotherm of selected hydrotalcite samples. All isotherms for the obtained samples are of type IV, typical of mesoporous materials, with H1 type hysteresis.
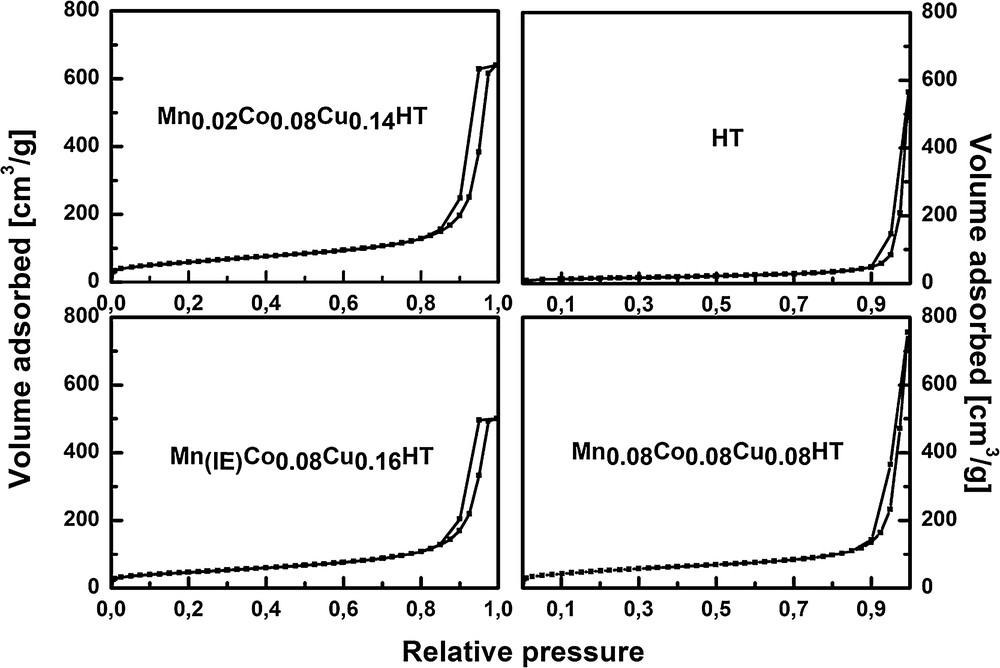
N2 sorption isotherms of selected samples.
Specific surface areas and volume and size of mesopores for the calcined samples are summarized in Table 2.
Specific surface area (SBET) and mesoporosity parameters for the studied catalysts.
| Sample | BET surface area (m2/g) | Mesopore volume (cm3/g) | Mesopore diameter (nm) |
| HTa | 52 | 0.87 | 33.9 |
| Mn0.08Co0.08Cu0.08HT | 182 | 1.12 | 33.4 |
| Mn0.01Co0.08Cu0.16HT | 187 | n.d. | n.d. |
| Mn0.02Co0.08Cu0.14HT | 187 | n.d. | n.d. |
| Mn(IE)Co0.08Cu0.16HT | 166 | 0.75 | 23.9 |
| Mn0.016Co0.08Cu0.15HT | 176 | 0.95 | 23.9 |
a Non-calcined samples.
The samples were predominantly mesoporous and the BJH mesopore volume ranged from ca. 0.87 to ca. 1.12 cm3/g. For the uncalcined hydrotalcite HT sample, the surface area was 52 m2/g. SBET values for the calcined samples are similar and range from 166 to 187 m2/g, which is in agreement with the values obtained by Chmielarz et al. [25], who reported SBET for Cu–Co hydrotalcite of 158 m2/g. The slightly higher specific surface areas in our work may be due to different calcination conditions. Chmielarz et al. studied the influence of temperature for Co–Mg–Al and Cu–Mg–Al hydrotalcites calcined at 600–900 °C [26]. For Cu–Mg–Al hydrotalcite, specific surface area decreased from 212 to 196, 120 or 50 m2/g, respectively after calcination at 600, 700, 800 and 900 °C [26]. For Co–Mg–Al hydrotalcite, SBET decreased from 198 to 180, 125 and 96 m2/g, respectively, for samples calcined at 600, 700, 800, and 900 °C [26].
3.1.2 Structure of the fresh catalysts
Fig. 2 shows the infrared spectra for uncalcined hydrotalcites in the region between 400 and 4000 cm−1.
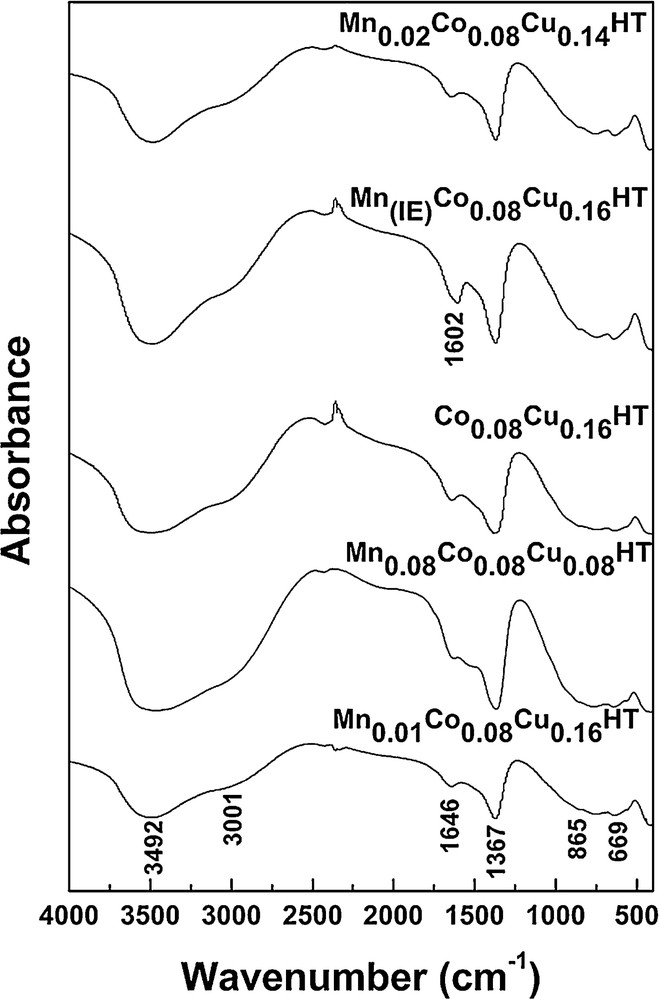
IR spectra of selected samples.
All synthesized samples exhibit several common absorption bands at the wave numbers of 3500 cm−1, 3000 cm−1, 1370 cm−1, 870 cm−1 and 670 cm−1. The band at 3500 cm−1 is assigned to stretching vibrations of OH groups attached to Al, Mg, Co, Cu and Mn in the layers [27,28]. This maximum may be shifted to higher wave number values, depending on the molar fraction of trivalent cations, as far as 3700 cm−1 for molar fraction of 0.4 [23]. The absorption band at 3000 cm−1, which is partially superimposed on the 3500 cm−1 band, may arise from hydrogen bonds vibrations of carbonate and water CO32−–H2O present in the interlayer. The four bands observed around 1650 cm−1, 1370 cm−1, 870 cm−1 and 670 cm−1 indicate also the presence of carbonate ions. The peaks observed in the low wave numbers region below 800 cm−1 are ascribed to Co–, Cu–, Mn–, Mg–, and Al–O lattice vibrations. The sample subjected to ion exchange exhibited an additional absorption band at 1610 cm−1, which may be attributed to stretching vibrations of COO− groups present in EDTA [23,29]. As the catalyst is used in SCR after calcination, it is important to confirm the presence of manganese in the calcined catalyst. This is why an XRF spectrum was taken for Mn(IE)Co0.08Cu0.16HT after calcination. As non-quantitative XRF confirmed the presence of Mn, the concentration was determined by AAS (Table 1). This proves that the chosen method resulted in the successful incorporation of manganese species into the hydrotalcite catalytic system.
3.1.3 The influence of calcination on the structure of the catalysts
Figs. 4 and 5 show the XRD diffractograms of as-synthesized and calcined samples, respectively. In Fig. 3, at low θ angles, sharp reflections are present, while at higher angular values the reflections are less intense.
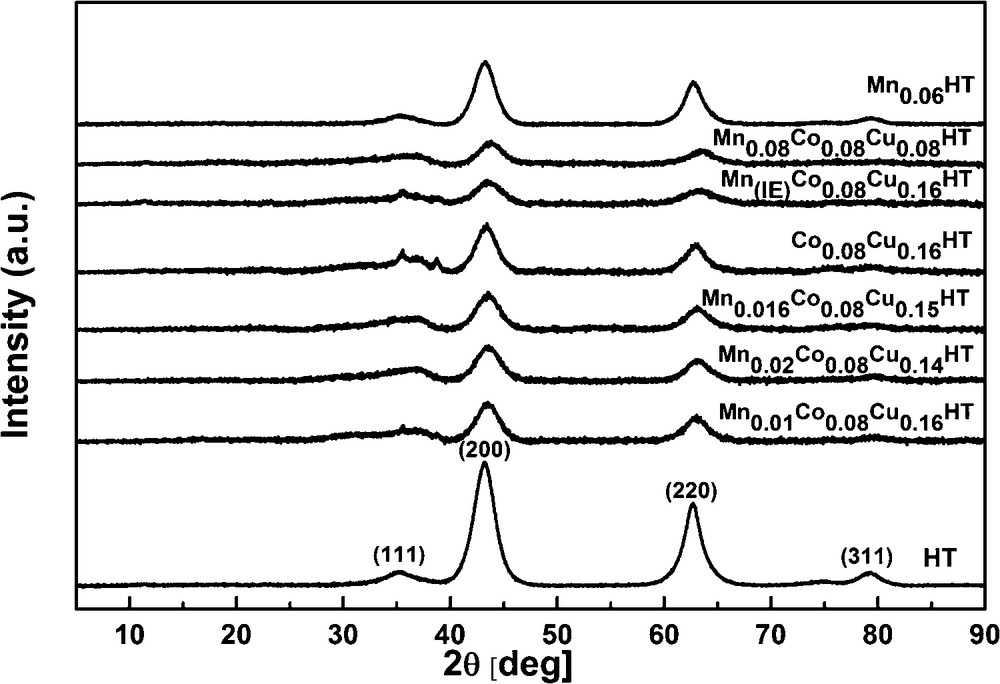
XRD patterns of selected calcined samples.
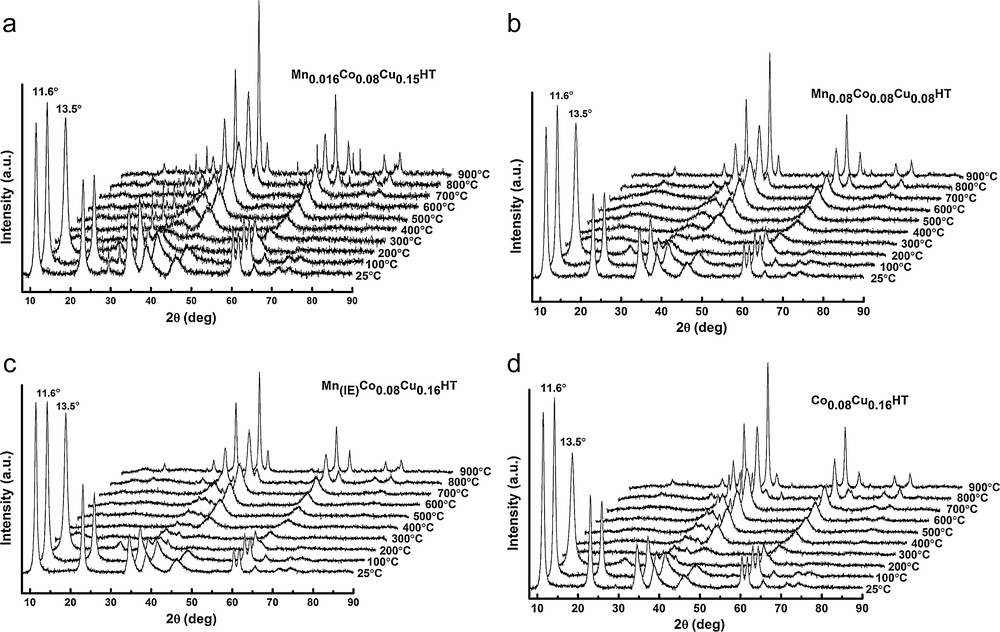
a: high-temperature XRD patterns of Co0.08Cu0.16HT; b: high-temperature XRD patterns of Mn0.08Co0.08Cu0.08HT; c: high-temperature XRD patterns of Mn(IE)Co0.08Cu0.16HT; d: high-temperature XRD patterns of Mn0.016Co0.08Cu0.15HT.
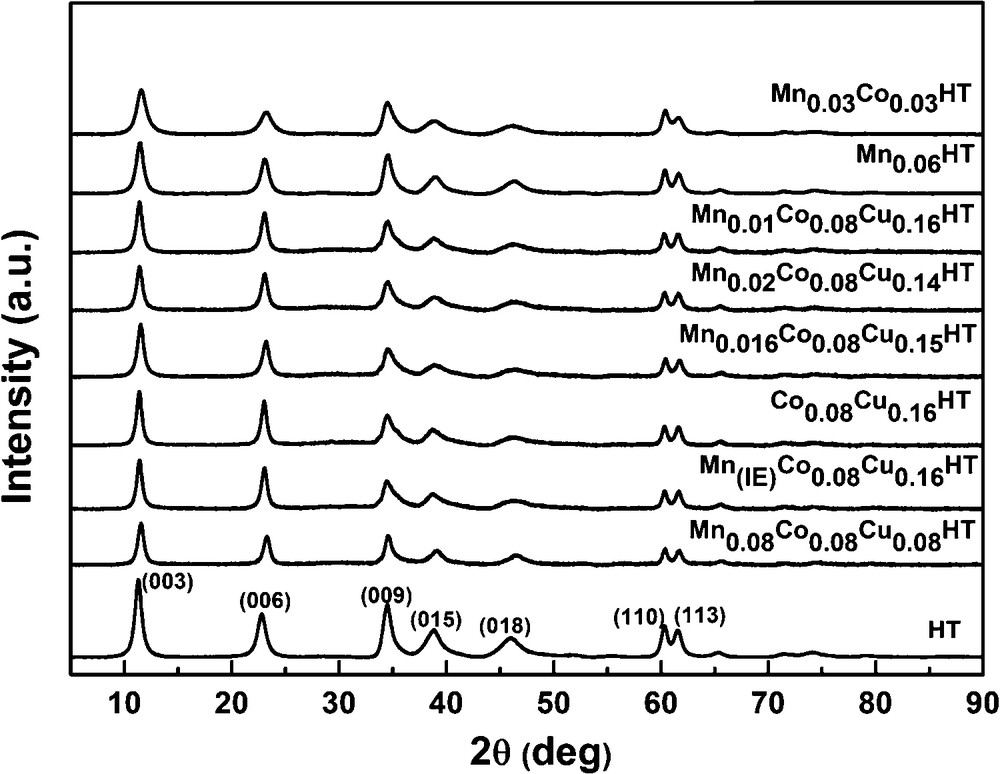
XRD patterns of selected synthesized samples.
All fresh, uncalcined samples show typical reflections of the hydrotalcite phase at 2θ = 11°, 24° and 35°, corresponding to (003), (006) and (009) planes, respectively, thus indicating the existence of a multilayer structure [32]. The values of unit cell parameters were calculated based on the XRD diffractograms according to the methodology proposed by Rives [33]. The hydrotalcite structure shows in XRD diffractograms, at values of 2θ between 10 and 40°, three sharp reflections originating from the diffraction of X-rays on planes (003), (006) and (009). The parameter c of the hydrotalcite unit cell can be calculated from the position of the first reflection (c = 3d(003)) or from the position of three first reflections c = d(003) + 2d(006) + 3d(009). The value of the parameter c, which represents three times the distance between layers, depends strongly on the type and orientation of interlayer anions. Thus, based on the value of this parameter, the type of interlayer anion may be established. The c parameters values for different types of anions in the interlayer spaces were reported by Cavani et al. [23]. In this work, the parameter c was calculated from the position of the first reflection. When it comes to the parameter a of the unit cell, it describes the average cation–cation distances in the hydrotalcite layers, and its value depends on the type of cations in the layers (ionic radius). It can be calculated from the position of the first reflection at 2θ = 60°, which originates from the diffraction by planes (110) according to the formula a = 2d(110). All calculated values are summarized in Table 3.
Unit cell parameters and crystallite sizes of the obtained fresh materials.
| Sample | Unit cell parameter a (Å) | Unit cell parameter c (Å) | c′ parameter (Å) | Crystallite size (nm) |
| HT | 3.04 | 23.42 | 7.81 | 11.48 |
| Mn0.06HT | 3.06 | 23.20 | 7.73 | 10.19 |
| Mn0.03Cu0.03HT | 3.06 | 23.02 | 7.67 | 7.66 |
| Mn0.01Co0.08Cu0.16HT | 3.06 | 23.28 | 7.76 | 9.42 |
| Mn0.02Co0.08Cu0.14HT | 3.06 | 23.28 | 7.76 | 9.06 |
| Mn0.016Co0.08Cu0.15HT | 3.06 | 23.04 | 7.68 | 8.21 |
| Co0.08Cu0.16HT | 3.06 | 23.31 | 7.77 | 9.39 |
| Mn(IE)Co0.08Cu0.16HT | 3.06 | 23.25 | 7.75 | 9.65 |
| Mn0.08Co0.08Cu0.08HT | 3.06 | 23.01 | 7.67 | 8.62 |
All prepared hydrotalcites exhibit rhombohedral symmetry. The value of parameter a for almost all samples is 3.06 Å, which corresponds to the average distance cation–cation in the hydrotalcite layer. The unit cell parameter a is in good agreement with the values reported by Chmielarz et al. which were between ca. 3.04 and 3.06 Å for hydrotalcites with similar contents of Co and Cu, as studied in this work [20]. The c′ parameter calculated as (1/3) c is approximately 7.76 Å for the as-synthesized samples. According to the literature data, it is possible to determine the type of anions present in the interlayer space based on the c parameter. In case of carbonate anions, the value of the c′ parameter is 7.7 Å [28,30], which leads to the conclusion that in the interlayer space of the synthesized materials, CO32− anions are present. For the manganese–EDTA ion exchanged sample, the c′ value did not change, which suggests that the complex was not incorporated into the interlayer space of hydrotalcite. Taking into account FT–IR spectra proving the presence of COO− ions arising from EDTA, it may be assumed that the Mn2+ complexes were deposited on the outer surfaces of the hydrotalcite crystallites. The XRD patterns of the ion exchanged hydrotalcite sample did not show any reflections from manganese compounds, thus indicating that either very small manganese entities or perhaps even single cations, or amorphous aggregates, were present. The former explanation seems more probable, as high dispersion of cations on the surface of hydrotalcite introduced by ion exchange with Ni–EDTA complex were reported by Tsyganok et al. [34].
After calcination at 500 °C (cf. Fig. 4), the samples exhibited reflections at 2θ = 43.5 and 63° characteristic of the periclase-like structure of mixed oxides, which is typical for products of hydrotalcite calcination [33]. In the diffractogram of sample Co0.08Cu0.16HT, two additional reflections were observed at 2θ = 35 and 39°, originating from the copper magnesium oxide structure (Cu4MgO5) [35]. No reflections arising from hydrotalcite structure were observed, pointing to the complete collapse of the layered structure of catalysts precursors and the formation of the phase of mixed nano-oxides.
As hydrotalcites may undergo several phase transitions, which, in certain temperature regions, may be reversible, structural changes were studied for Mn–Cu–Co-HTs by XRD as a function of temperature. The appropriate XRD patterns are shown in Fig. 5a–d. Four types of structures may be observed: from room temperature to ca. 200 °C, at 200 °C, from ca. 300 to ca. 600 °C and over 600 °C. XRD patterns reveal that the layered structure of HTs turned to almost amorphous around 200 °C, followed by the formation of mixed oxides periclase-like structure at 300–600 °C, and then by spinel structure over 900 °C. It was reported in the literature that hydrotalcites lose their layered structure on heating and form amorphous nano-oxides, which are characterized by the so-called memory effect, i.e. they may rebuild the former layered structure in the presence of appropriate ions and water. This is why a calcination temperature of 500 °C was chosen. Many authors suggested that mixed oxide obtained by thermal treatment at temperatures equal or higher than 500 °C do not exhibit the ability of complete regeneration of hydrotalcite structure [30] and explained the effect by the increase in the crystallinity of the periclase phase, followed by the formation of spinel structure. A calcination temperature in a somewhat higher range (600 °C) was proposed for Cu, Co or Cu and Co-HTs by Chmielarz et al. [31], but as in our work, no drastic changes were registered between the structure of the catalysts calcined at 500 and 600 °C, the former calcination temperature was chosen.
In all figures, it may be observed that:
- • all hydrotalcite samples exhibit sharp reflections typical of these materials at 25 and 100 °C;
- • the reflections at 2θ = 11°, 24° and 35° decreased and broadened with increasing temperature. At 200 °C, a reflection shifted for all samples, indicating a decrease in interlayer distance, which may have been caused by CO2 and H2O removal. These reflections disappeared completely at 300 °C;
- • from 300 °C reflections at 2θ = 43° and 63°, corresponding to (200) and (220) planes, characteristic of the appearance of a periclase structure. They arise from the respective oxides Mg(Al)O and Mg(Me(II),Al)O. The intensity of these reflections increased with temperature up to 900 °C, indicating the increasing crystallinity of the mixed oxide phase;
- • diffraction patterns at 900 °C show reflections at 2θ = 35°, 44° and 65° (from (300), (211), (141) planes), arising from the spinel structure (MgAl2O4). Other reflections characteristic of spinel structure can be observed, especially for higher angles. The XRD results at 900 °C indicate the co-existence of two phases – spinel and mixed oxide with periclase structure.
3.2 Catalytic performance
Catalytic activity tests were carried out for all synthesized samples after calcination at 500 °C. All tested catalysts exhibited catalytic activity in SCR with ammonia. The dependence on temperature of NO conversion and N2O concentration in the products is shown in Figs. 6 and 7. Additionally, for comparison, the results for Mn-HT and Mn0.03Cu0.03HT reported by Wlodarczyk et al. are added [36]. These results were obtained under exactly the same conditions as given in this work. All catalysts showed high activity in the low-temperature range (≤ 250 °C). The incorporation of Co and Cu into Mn-HT shifted the maximum activity to lower temperatures, increased the activity of the catalysts and influenced selectivity, to an extent depending on the Mn content. For comparison, NO conversion at 250 °C for the Co0.08Cu0.16 sample was 92%, while for the Co–Cu-HTs containing manganese the conversion was higher and for Mn0.016Co0.08Cu0.015HT the content reached 97%. The introduction of Mn via ion exchange had a negative influence on conversion, when compared to catalyst Co0.08Co0.16HT. When compared to the Mn0.01Co0.08Cu0.16HT sample obtained by co-precipitation method, the difference in NO conversion was even higher: 85.2 and 96.7% at 250 °C, for the former and Mn(IE)Co0.08Cu0.16HT, respectively. It should be mentioned, however, that Mn-HT exhibited a totally different activity pattern and maximum NO conversion at 250 °C was only 58%.
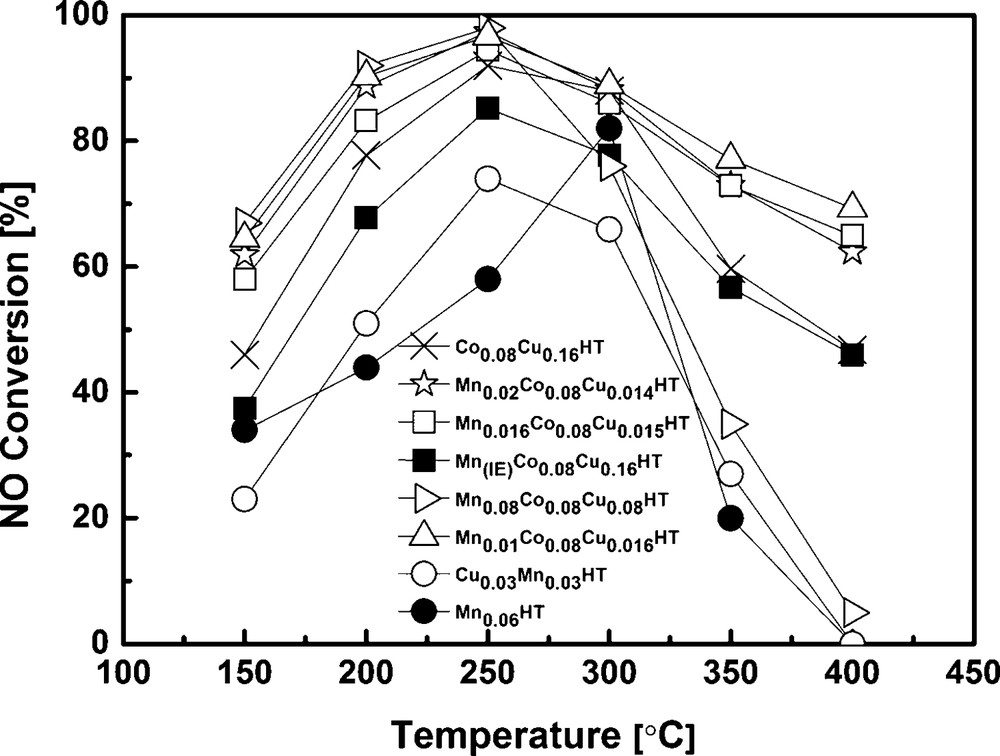
Results of catalytic tests performed for selected samples.
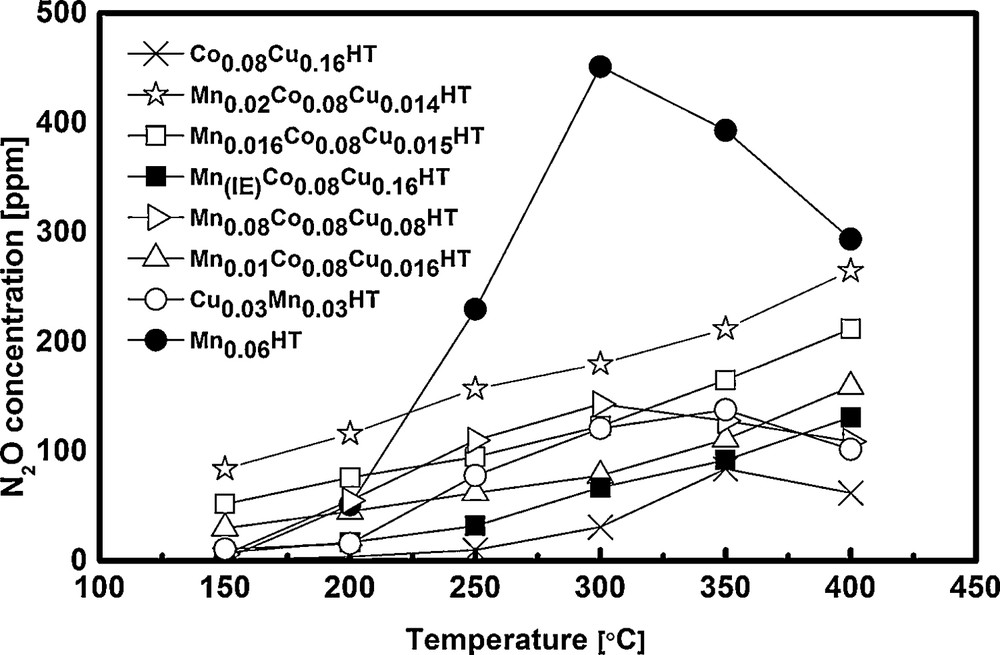
Concentration of N2O in the flue gas after reaction.
Above 200 or 300 °C, depending on the catalyst, NO conversion decreased for all catalysts, which is usually ascribed to preferential ammonia oxidation [20,37,38].
In case of pure hydrotalcite, in which magnesium is partly substituted only with manganese (without the addition of Co and Cu), the main product is N2O. At a conversion of 80% at 300 °C, the amount of N2O was 400 ppm, which indicates that N2O was most probably formed in SCR–NH3 and not in SCO (selective ammonia oxidation). In case of the samples where additionally copper and cobalt were introduced, the appropriate sequence for N2O formation at 250 °C was: Mn(IE)Co0.08Cu0.16HT < Co0.08Cu0.16HT < Mn0.01Co0.08Cu0.16HT < Mn0.016Co0.08Cu0.15HT < Mn0.08Co0.08Cu0.08HT < Mn0.02Co0.08Cu0.14HT << Mn-HT. As an example, the N2O concentration in the products at 250 °C was 32 and 62 ppm for Mn(IE)Co0.08Cu0.16HT and Mn0.01Co0.08Cu0.16HT, respectively. The explanation may be connected with the size of Mn aggregates. It was observed before by Grzybek et al. that high dispersion of Mn oxides/hydroxides led to the decreased formation of dinitrogen oxide in comparison to catalysts that contained bigger MnOx aggregates [13]. It should be mentioned, however, that at lower temperatures, which are of interest in the current work (i.e. 200 and 150 °C), the concentration of N2O in the products of MnCoCu-HT catalysts was very low, of the order of the error of the equipment used for this study.
The comparison of the performances of different MnCoCu-containing hydrotalcites leads to a general conclusion that the composition and structure of these catalysts may be tailored to obtain appropriate SCR–NH3 properties in the low-temperature region (below 250 °C). The main focus should be put on the amount of introduced manganese, because of its highly oxidizing properties, which may result in the overabundance of unrequired N2O in the products.
It is rather difficult to compare the performances of the studied materials with other low-temperature catalysts proposed in the literature because of different experimental conditions. An exception is carbonaceous materials studied by Grzybek et al. and Klinik et al. under similar conditions as used in this work [39,40]. Appropriately modified activated carbons proved to have NO conversions at 200–250 °C comparable to those reported here and higher at 150 °C. Especially, activated carbons modified with nitrogen compounds (urea or a mixture of NH3 and O2) or promoted with Mn oxides/hydroxides proved efficient. However, the successful modification required several preparative steps and additionally, the presence of oxygen in flue gases results in the formation of CO2 and thus the loss of the catalyst as a function of time.
The results of selective catalytic oxidation of NH3 are shown in Figs. 8 and 9.
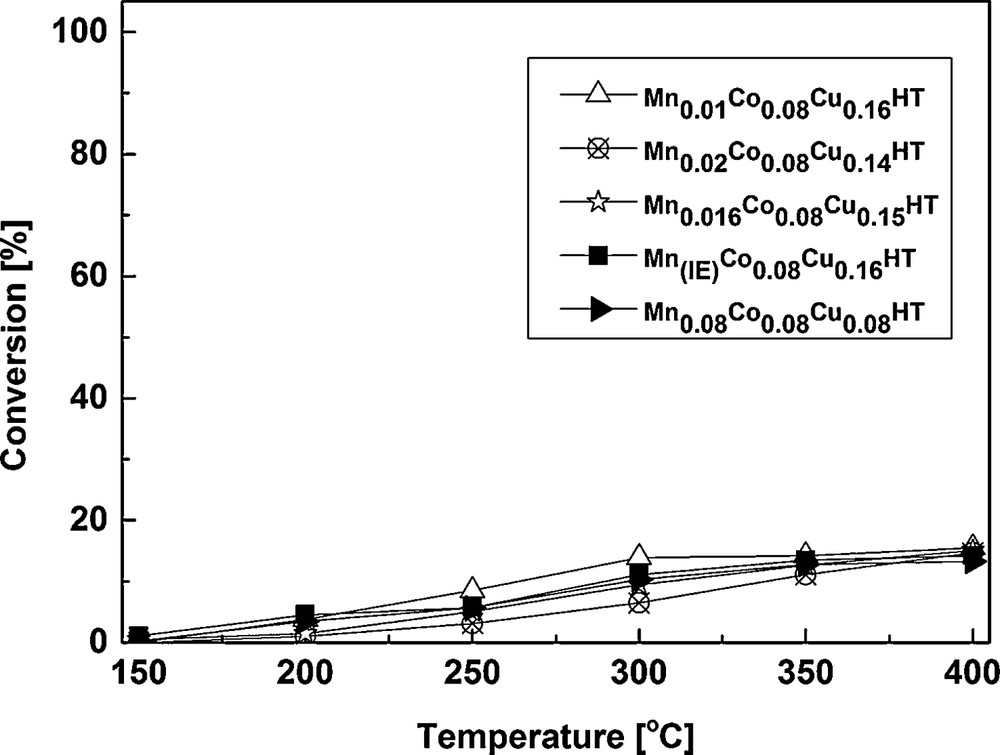
Conversion results of catalytic tests for the SCO process.
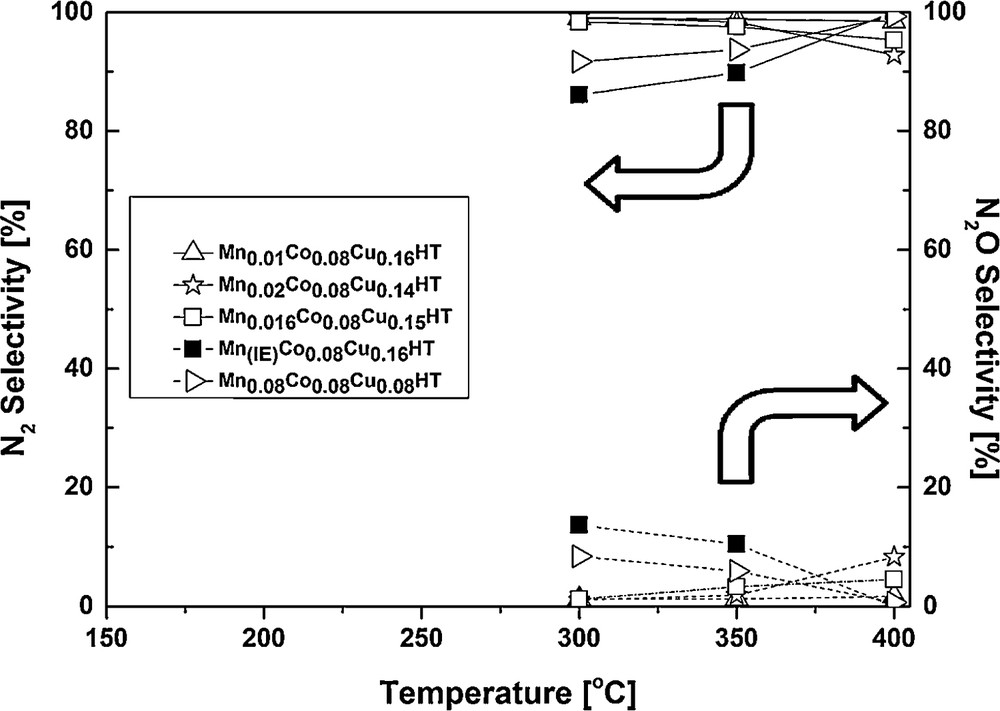
Selectivity results of catalytic tests for the SCO process.
It can be observed that NH3 conversion was low at the range of special interest i.e. low temperatures (250 °C and lower). This is in good agreement with high NO conversion for the most active samples shown in Fig. 6. E.g., for Mn0.01Co0.08Cu0.16HT, Mn0.016Co0.08Cu0.16HT and Mn0.08Co0.08Cu0.16HT, NO conversion at 250 °C was ca 94.5–97.4%. Assuming that a part of ammonia was oxidized, a maximum of 2.6–5.5% could have been used in SCO. Taking into account the stoichiometry of SCO (2 moles NH3 forming 1 mole N2O) and the ammonia concentration used in SCR experiments (800 ppm), the maximum amount of N2O formed by ammonia oxidation would be 10–22 ppm. As seen in Fig. 7, the mentioned catalysts exhibited ca 60 to ca 160 ppm N2O in the products, leading to a conclusion that the reaction of NO reduction leads mainly to N2, but a side reaction leading to N2O may be also present for the studied catalysts.
From 300 °C, ammonia oxidation began to increase slightly, with N2 as the main product and small amounts of N2O as a side product. The observed trend of N2O formation in SCO–NH3, however, only partly explains the decrease in NO conversion for SCR–NH3 at temperatures from 300 to 400 °C. Although it indicates that SCO–NH3 becomes a competitive reaction (which in case of 1:1 NO:NH3 stoichiometry results in the lack of appropriate amounts of the reducing agent for SCR), it does not fully explain the decrease in NO conversion observed for SCR. Fig. 8 shows that SCO activity of these samples is quite similar at 350 and 400 °C, for the catalysts with the different contents of Mn, while from Fig. 6 (SCR activity), it may be seen that the decrease in NO conversion (at 350 and 400 °C) follows a different trend: Mn0.08Co0.08Cu0.16HT > Mn(IE)Co0.08Cu0.16HT > Mn0.02Co0.08Cu0.16HT > Mn0.016Co0.08Cu0.16HT ≈ Mn0.01Co0.08Cu0.16HT, with a strong dependence on the content of manganese. These two contradicting trends (for SCR and SCO) suggest that SCO reaction is not the only reason for the loss of activity in the higher temperature range for the studied samples in SCR. As structural changes could be one of the possible reasons of deactivation in SCR, the Mn–Co–Cu-HTs after the exposure to the full SCR experiment (i.e. the sequence from 150 to 400 °C) were studied by XRD. Fig. 10 presents a comparison of XRD patterns for Mn0.01Co0.08Cu0.16HT. Other samples showed the same tendencies, so they were omitted in the figure.
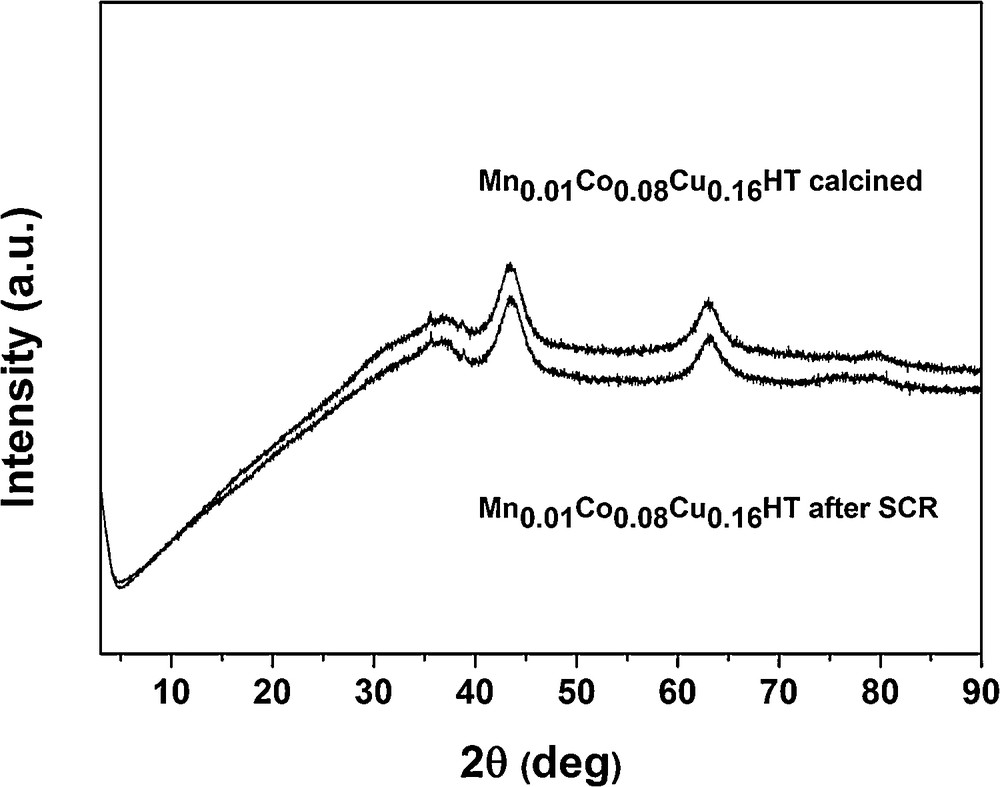
XRD patterns of catalyst Mn0.01Co0.08Cu0.16HT after calcination and SCR reaction.
As no structural changes were observed, it proves, among others, that (i) structural changes are not the main reason for the observed deactivation at higher temperature region and, additionally, (ii) H2O which is one of the reaction products does not influence the structure of the studied samples. It should be stated, however, that water content is much higher in flue gases than that which is present as a product of SCR (or SCO) reaction and thus additional studies are necessary to elucidate the role of water in SCR for the studied hydrotalcites. Motak et al. [41] proved that Cu-HTs did not show a memory effect after a series of tests with a mixture typical for Diesel engines with containing, apart from NO, CO, H2 and hydrocarbons, in each case also 15% CO2 and 10% H2O. The total time of exposure was ca. 20 h and XRD measurement after such a test did not show structural changes. However, it must be mentioned that Cu-HTs in this work were calcined at 600 °C and not at 500 °C as in our work.
Among the analyzed N-containing products of SCO, N2 and N2O were observed. No nitric oxide was registered.
The appropriate sequence for N2 selectivity at 300 °C was: Mn(IE)Co0.08Cu0.16HT < Mn0.08Co0.08Cu0.08HT (1 Mn/Cu ratio) < Mn0.01Co0.08Cu0.16HT, Mn0.016Co0.08Cu0.15HT and Mn0.02Co0.08Cu0.14HT (0.06, 0.10 and 0.14 Mn/Cu ratio, respectively). At 400 °C, the selectivity to N2 increased to almost 100% for the samples Mn0.08Co0.08Cu0.08HT and Mn(IE)Co0.08Cu0.16HT, while it decreased slightly for the other samples. Mn0.01Co0.08Cu0.16HT exhibited almost 100% selectivity to N2 in the entire temperature range. The selectivity for temperatures below 300 °C was not shown because of very low ammonia conversions.
The selectivity to N2O in SCO at 300 °C formed a sequence: Mn(IE)Co0.08Cu0.16HT > Mn0.08Co0.08Cu0.16HT > Mn0.016Co0.08Cu0.15HT ≈ Mn0.02Co0.08Cu0.14HT ≈ Mn0.01Co0.08Cu0.14HT (0%), while the respective trend for SCR was Mn0.02Co0.08Cu0.14HT > Mn0.08Co0.08Cu0.16HT > Mn0.016Co0.08Cu0.15HT > Mn0.01Co0.08Cu0.16HT > Mn(IE)Co0.08Cu0.16HT. The respective trends for 350 and 400 °C were also different for SCO and SCR. At 400 °C, the difference in the amount of N2O formed in SCR increased for the compared samples (cf. Fig. 7), while very similar selectivities to N2O were registered in SCO (cf. Fig. 9). This again suggests that N2O at higher temperatures studied here was formed both in the side reaction of NO reduction with ammonia and ammonia oxidation, while at lower temperatures (up to 250 °C) the main source of dinitrogen oxide was SCR.
4 Conclusions
New catalysts were developed for the low-temperature SCR containing Mn, Co, Cu in Mg/Al hydrotalcite structure. The catalysts with different manganese contents were prepared using two methods: co-precipitation and ion exchange. XRD analyses before calcination confirmed the multilayer structure of synthesized hydrotalcites. After calcination, the multilayer structure was transformed to periclase-like structure of mixed nano-oxides. Ion exchange method and co-precipitation led to different distributions of manganese, which in the former case was present as small entities or perhaps even single cations on the outer surface of hydrotalcite crystallites. The addition of Mn to CoCu-containing hydrotalcites improved catalytic activity to an extent depending on the amount of introduced Mn and influenced selectivity to N2O. N2O concentration in the products strongly increased with Mn content, but could be tailored to acceptable levels for lower temperatures. The best catalyst contained Mn0.01Co0.08Cu0.16, which with a relatively high conversion at 250 °C showed high selectivity to N2. Above 250 °C, the catalytic oxidation of NH3 started competing with SCR, this being one of the reasons for the decrease in NO conversion.
Acknowledgments
M. Motak and R. Baran would like to acknowledge AGH grant 11.11.210.213. R. Debek would like to acknowledge the grant of KIC BioEcoMatic.